This is a repository copy of Modelling of H production in a packed bed reactor via sorption₂ enhanced steam methane reforming process.
White Rose Research Online URL for this paper: http://eprints.whiterose.ac.uk/117799/
Version: Accepted Version Article:
Abbas, SZ, Dupont, V orcid.org/0000-0002-3750-0266 and Mahmud, T (2017) Modelling of H production in a packed bed reactor via sorption enhanced steam methane reforming ₂
process. International Journal of Hydrogen Energy, 42 (30). pp. 18910-18921. ISSN 0360-3199
https://doi.org/10.1016/j.ijhydene.2017.05.222
(c) 2017 Published by Elsevier Ltd on behalf of Hydrogen Energy Publications LLC. This manuscript version is made available under the CC BY-NC-ND 4.0 license
http://creativecommons.org/licenses/by-nc-nd/4.0/
eprints@whiterose.ac.uk https://eprints.whiterose.ac.uk/
Reuse
Items deposited in White Rose Research Online are protected by copyright, with all rights reserved unless indicated otherwise. They may be downloaded and/or printed for private study, or other acts as permitted by national copyright laws. The publisher or other rights holders may allow further reproduction and re-use of the full text version. This is indicated by the licence information on the White Rose Research Online record for the item.
Takedown
If you consider content in White Rose Research Online to be in breach of UK law, please notify us by
Paper accepted in International Journal of Hydrogen Energy on 31 May 2017
Modelling of H2 production in a packed bed reactor via sorption enhanced
steam methane reforming process
S. Z. Abbas
*, V. Dupont, T. Mahmud
School of Chemical and Process Engineering, University of Leeds, LS2 9JT, UK
ABSTRACT
The sorption enhanced steam reforming (SE-SMR) of methane over the surface of 18 wt. %
Ni/ Al2O3 catalyst and using CaO as a CO2-sorbent is simulated for an adiabatic packed bed
reactor. The developed model accounts for all the aspects of mass and energy transfer, in both
gas and solid phase along the axial direction of the reactor. The process was studied under
temperature and pressure conditions used in industrial SMR operations. The simulation
results were compared with equilibrium calculations and modelling data from literature. A
good agreement was obtained in terms of CH4 conversion, hydrogen yield (wt. % of CH4
feed), purity of H2 and CO2 capture under the different operation conditions such as
temperature, pressure, steam to carbon ratio (S/C) and gas mass flux. A pressure of 30 bar,
923 K and S/C of 3 can result in CH4 conversion and H2 purity up to 65% and 85%
respectively compared to 24% and 49% in the conventional process.
Keywords: Mathematical modelling; Sorption enhanced steam methane reforming;
Simulation; Equilibrium
*Corresponding Author
Tel.: +44-7451919251
1.
Introduction
In any industrial chemical process, the reactor is considered as the heart of the process. In a
catalytic reactor, reactions between the reactants take place on the surface of the catalyst.
Downstream of the reactor, separation is required to achieve high product purity. Separation
processes are usually very costly and contribute towards higher investment and operational
costs [1]. Mayorga et al.[2] presented a concept of a reactor in which reaction and separation
took place at the same time in a single reactor. This concept of hybrid reactor reduces the
capital cost of the process, as no downstream unit operation is required to achieve the desired
product purity.
CO2 accounts for 99 wt.% of total greenhouse gas emission [3],causing global warming.
Almost 75% of CO2emission in the atmosphere for the last 20 years is due to the burning of
the fossil fuels [4]. Fired processes in the chemical industry represent a significant
contribution to total CO2 emissions in developed countries. Due to increasing concern about
the CO2 emission, attention has been given to manage CO2 emission during the conventional
steam methane reforming (SMR) process. The SMR process is the most widely used
technique for H2 production and over 50% of the world’s H2 production is from the SMR
process [4]. The higher degree of endothermicity of the process makes it operate at high
temperature conditions. In industrial SMR processes, CO-shift reactors are needed
downstream of the reformer to convert the undesired CO and steam into CO2 and H2 product.
Later on, amine scrubbing or pressure swing adsorption (PSA) process is required to achieve
the higher purity of H2 [5]. To address the issue of global warming, researchers developed the
concept of combining the reforming process with in-situ CO2 separation by solid adsorption.
This process was named sorption enhanced steam methane reforming (SE-SMR) process
The SE-SMR is the process that produces H2 and at the same time captures CO2 by featuring
a CO2 sorbent in the reactor. This process works on the principle of hybrid reactor as
presented by Mayorga et al. [2]. Williams et al. [5] issued a patent in which they explained
the SE-SMR process for the production of H2. Tsekhovoi et al. [6] showed that the SE-SMR
process saves the overall energy demand of the system and this process has the potential of
saving up to 20-25% energy as compared to the conventional SMR process. The SE-SMR
process has the advantage of increasing CH4 conversion, H2 production and removing CO2
from the product stream. As the CO2is captured on a sorbent, the equilibrium of water gas
shift (WGS) reactions results in more H2 production at low temperature (723-873 K) than the
conventional SMR process (1073-1300 K) [7, 8]. In SE-SMR process, no WGS reactor is
required downstream of the steam methane reformer unlike the conventional SMR process
[9].
Fernández et al. [10] compared the performance of different sorbents on the basis of H2 yield.
They reported that using CaO as sorbent results in a weakly exothermic process, whilst using
Li2ZrO3makes the overall reaction weakly endothermic. In order to enhance the conversion
of CH4 and achieve a maximum net efficiency, S/C for each process was adjusted and
optimum operating temperature and pressure was derived. It was concluded from the findings
that CaO is the most favourable CO2 sorbent from thermodynamics point of view and it
favours higher H2 production as compared to other sorbents such as Li2ZrO3, K-doped
Li2ZrO3, Na2ZrO3 and Li4SiO4. Stability of CaO is a key issue for the fixed-bed sorption
enhanced reactor technology. A drop of the carbonation extent for a pure CaO in
re-carbonation/decomposition cycles is well-recognized. The main reasons for the decay of CO2
capture capacity of CaO are pore blockage and sorbent sintering. However, the study of
Alvarez et al. [11] revealed that the pore blockage is negligible for the 100 cycles at shorter
According to Molinderet al. [12], CaO undergoes three different reactions. CaO is highly
hydroscopic and below 400 °C it undergoes CaO hydration reaction (R1). Then this reaction
proceeds towards Ca(OH)2 carbonation reaction (R2).
CaO H O Ca OH H kJ mol R
Ca OH CO CaCO H O H kJ mol R
Fernández et al. [13] developed a mathematical model of SE-SMR process in a fixed bed
reactor using Ca/Cu looping process and CaO as the sorbent and studied the effect of
operating variables, such as catalyst to sorbent ratio, space velocity, S/C, pressure and
temperature, on the composition of product gases. They used the experimental work of Lee et
al. [14] for their model validation. Koumpouras et al. [15] developed a mathematical model
and investigated the effect of sorbent on CH4 conversion in a fixed bed reformer. Three cases
were considered to investigate the effect of sorbent. In the first case, no sorbent was used so it
represented a conventional SMR process. In the second case, sorbent was used but its ability
to adsorb CO2 was set to zero. So in this case, it only acted as a heat carrier. In the third case,
sorbent was used as a heat carrier as well as CO2 acceptor. It was found that a highest CH4
conversion along the length of the reactor was obtained in third case. Ding et al. [16] and Xiu
et al. [17] developed models of SE-SMR process and validated model predictions against
their own experimental data.
In the literature, the mathematical model of SE-SMR process, under the industrial conditions
has not been reported. In this paper, one dimensional heterogeneous mathematical model of
SE-SMR process is developed and implemented in gPROMS model builder 4.1.0®. The
predictions of reactor model are validated against the modelling data published by Fernández
et al. [13]. The model predictions are also compared with the equilibrium data generated on
2.
Mathematical modelling
A 1-D heterogeneous mathematical model of the SE-SMR process in an adiabatic packed bed
reactor has been developed using gPROMS. This model accounts for the mass and energy
transfer in both gas and solid phase. In this model it is assumed that;
a) The flow pattern of the gas phase in the packed bed reactor isa non-ideal plug flow in
nature.
b) The temperature and concentration variations along the radial direction of reactor are
considered negligible.
c) The active surface of the catalyst and sorbent facilitate the reforming and sorption
reactions.
d) Ideal gas behaviour is applicable.
e) The process is adiabatic in nature.
f) The size of the catalyst and sorbent are uniform throughout the packed bed.
g) The porosity of the packed bed is constant.
2.1
Governing equations
The SMR reaction (R3) is highly endothermic in natureand non-equimolar (more products
molesare formed than the reactants), so both high temperature and low pressure favour this
reaction at equilibrium. On the other hand, the WGS reaction (R4) is exothermic and
equimolar and is therefore favoured by low temperature, while its equilibrium is not pressure
dependent. As the reforming reactions proceed and CO2 is released, a CaO material captures
this CO2 gas by chemisorption producing solid CaCO3. This sorption of CO2 favours the
enhanced CO consumption, also that of the SMR reaction towards more conversion of CH4.
In this model, only CO2 is considered to be adsorbed on the surface of the sorbent. The
adsorption of CO2 on the surface of CaO is a highly exothermic carbonation reaction above
400 °C (R5);
CH H O CO H H kJ mol R
CO H O CO H H kJ mol R
CaO CO CaCO H kJ mol R
The overall SE-SMR reaction is slightly exothermic in nature as shown in R6;
CaO CH H O CaCO H H kJ mol R
On the basis of the assumptions reported above, the mathematical equations for mass and
energy balances within the reactor filled with sorbent and catalyst particles are listed in Table
1. The equations used to calculate the physical properties and model parameters are listed in
[image:7.595.75.526.535.719.2]Appendix A.
Table 1: Summary of mass and energy balance equations used in the 1-D heterogeneous packed bed
reactor model
Mass and energy balances in the gas phase for reforming process;
C t
uC
z k a C C D
C
z
C Tt u C Tz h a T T z T
Mass and energy balance in the solid phase;
C Tt h a T T
H R H r
Pressure drop calculations across the reactor bed;
Pg
L d u d u
In Table 1, is the ratio of the amount of the catalyst to the amount of sorbent filled in the
packed bed reactor. rads is the rate of the adsorption of the CO2. In literature, many
expressions have been reported to describe the carbonation kinetics of CaO-based sorbents
[13, 14, 18]. Lee et al. [14] performed experiments in a tubular reactor having an inner
diameter 22 mm and a bed length of 290 mm containing 16.4 g Ni based reforming catalyst
and 83.6 g CaO based sorbent. Through series of experiments in temperature range of
650-750°C, they determined the carbonation conversion data.In the past, many efforts were made
to describe the kinetics of CO2 adsorption on the surface of CaO based sorbent [14, 18-20].
Rodriguez et al.[21] proposed a first-order carbonation reaction rate and developed arate
equation for CO2 adsorption on the surface of CaO sorbent.
dq
dt k X X
Where Xmax is the maximum conversion of CaO, kcarb [s-1] is the reaction rate constant of
active CaO sorbent and CO2,eq is the volume fraction of CO2 in equilibrium and it is given
as[19];
Where, X is the carbonation conversion of CaO. Dedmanet al. [22] reported that the
carbonation rate of CaO is zero order with respect to CO2 partial pressure. Bhatia et al.[20]
proposed the carbonation rate expression which was independent of partial pressure of
CO2.Lee et al.[14] performed TGA analysis and determined the maximum conversion of
active CaO at different temperatures. The experimental data revealed that the conversion of
CaO was very low even at a high temperature (750 °C). This may be due to the large size of
the CaO particles and low surface area. It was observed that using large size of the pellet,
there was no sign of particle deterioration even after many cycles of carbonation and
calcination. An expression to calculate the maximum conversion of CaO at any given
temperature is given by:
X exp T exp T
The rate equations, reaction rate constants and equilibrium constants used in this model are
given in Appendix B. On the basis of reactions involved in SE-SMR, the rate of formation or
consumption of component i is given as;
r R i CH CO CO H and H O
Where j is the effectiveness factor of reaction j, ij is the stoichiometric coefficient of
component i in reaction j, and ij is negative for reactants and positive for products.
The reactor model equations (Eqs. 1-4) consist of linear and non-linear partial differential
equations (PDEs) and algebraic equations. The initial and boundary conditions used in
solving these equations are as follows;
Boundary conditions;
At z = 0
At z = L
C
z T
z T
z
Initial conditions;
C C T T T T q
At initial conditions, it was considered that no gas was present within the reactor so the
concentration of gas species was zero at the start i.e. at t = 0. But setting the concentration of
H2 zero made the rates of reforming reactions infinite (B.1-3). To avoid this, a very small
initial concentration (~10-6) of the H2 was used in the solution.
The first-order backward finite difference method (BFDM) was used to solve the PDEs using
gPROMS. In this software, the differential algebraic solver (DASOLV) was used to convert
the PDEs into the ordinary differential equation (ODEs), and a 4th order Runge-Kutta
technique was used to solve the system of ODEs. The reactor was axially discretised into a
number of intervals and the sensitivity of the model was first checked for discretization
ranging from 10-1000 intervals. The model predictions were found independent of the
number of intervals. Finally, the reactor was axially discretized by 100 uniform intervals for
this paper and the output results were reported after every second.
3.
Results and discussion
3.1
Model validation
The developed reactor model of SE-SMR process was first validated against the modelling
results reported by Fernández et al. [13]. In addition, modelling results for the process were
compared independently with equilibrium results generated by chemical equilibrium and
applications (CEA) software [44, 45]. The reactor geometrical parameters such as length of
packed bed(L), catalyst particle size (dp), bed porosity ( b) and process variables like; S/C,
reported by Fernández et al. [13]. In this work, the temperature range of 923-1023K, pressure
range of1.0-35bar, S/C of 3-7 and residence time between 0.1s-1 and 0.38s-1 were used. The
[image:11.595.110.489.225.671.2]values used for reactor parameters and operating variables are listed in Table 2.
Table 2: Physical parameters and operating conditions used in reactor model validation[13]
Reactor characteristics and operating conditions
Gas feed temperature, [Tin] 923K
Initial solid temperature, [To] 923K
Wall temperature, [Tw] 1073 K
Total pressure, [P] 35bar
Steam to carbon ratio, [S/C] 5.0
Intel gas mass flux, [Gs] 3.5 kgm-2s-1
Maximum fractional carbonation conversion of CaO, [Xmax] 0.4
Apparent density of reforming catalyst, [ cat] 550 kgm-3
Apparent density of CaO based sorbent, [ CaO] 1125 kgm-3
Diameter of particles, [dp] 0.01 m
Reactor bed length, [L] 7 m
Bed porosity, [ b] 0.5
The overall production of H2, conversion of CH4 and CO2 capture in the SE-SMR process
chemisorption characteristics of the sorbent. The adsorption of CO2 on the surface of sorbent
is highly exothermic reaction and it causes a gradual rise in the temperature of the system. On
the other hand, the overall SMR process is endothermic in nature and needs heat to proceed.
The gas temperature variation results obtained from the reactor model developed in this work
were compared with modelling values reported by Fernandez et al. [13] and an excellent
[image:12.595.146.404.273.499.2]agreement is observed, as shown in Figure 1.
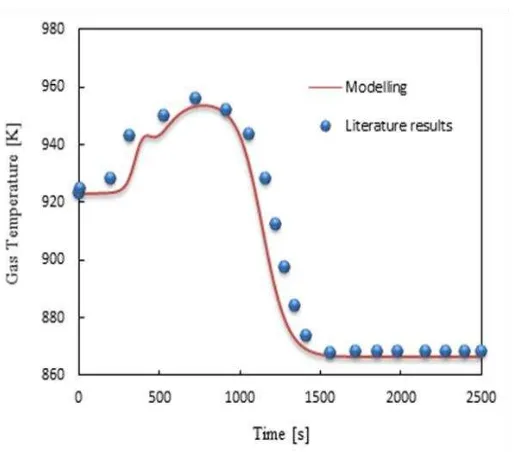
Figure 1: Predicted temperature profiles at the outlet of reactor at a feed temperature of 923K, S/C of
5.0, 35 bar and gas mass flow velocity of 3.5 kg m-2s-1 under adiabatic conditions. Dots are literature
values [13] andsolid linerepresents modelling results of this study.
In the pre-breakthrough period (t<720s), rise in the outlet gas temperature is observed
because of the CO2sorption process. In this period, adsorption of CO2 is maximum as the rate
of carbonation reaction is high. The maximum temperature obtained in this work is 953.7K
i.e. an increase of 30.7K from the feed temperature, while a rise of 32K above the feed
In the breakthrough period (720s ≤ t ≤ 1500 s), a drop in temperature is observed,but after
1500s the temperature becomes constant. The minimum temperature reached is 866.3 K i.e. a
decrease of 56.7 K from feed temperature compared to a drop of 55 K [13]. The sorbent is not
active in the post-breakthrough period and only SMR process is happening in this period,
hence the overall process is endothermic and the temperature of the adiabatic systemdrops
from 923K to 866.3K.
Fernandez et al.[13] also reported the modelling of the SE-SMR undernon-adiabatic
conditions.For the non-adiabatic SE-SMR process, the energy balance equation wasmodified
and the transfer of heat from the wall to the process gas was included. The modified energy
balance equation is given by;
C Tt h a T T
H R H r h T T D
In this equation, hw is the heat transfer coefficient atthe wall of the reactor, Tw is the
temperature of the reactor wall and Dr is the inner diameter of the reactor. The modelling
results of this work and the results of Fernandez et al.[13]under the same operating conditions
Figure 2: Predicted gas temperature profiles at the outlet of reactor at a feed temperature of 923K, S/C
of 5.0, 35 bar and gas mass flow velocity of 3.5 kg m-2s-1 under non-adiabatic conditions. Dots are
literature values [13] and solid line represents modelling values of this study.
By analysing both adiabatic and non-adiabatic processes, it is observed that in the
pre-breakthrough period of the adiabatic process temperature is higher than the temperature in the
non-adiabatic process. This higher temperature results in more CO2 production and hence the
carbonation rate is maximum. The higher carbonation rate thus makes the duration of
pre-breakthrough shorter in the adiabatic process as compared to the non-adiabatic process.
Although the rise of temperature is the same in both cases, the shorter pre-breakthrough
period of the adiabatic process is more favourable under fast cycling operations. On this
basis, the adiabatic process is selected for further analysis.
The reaction rate constant of CaO (kcarb) plays a major role in the kinetics of carbonation
reaction (R5). The effect of carbonation reaction rate constant on the temperature profile of
the SE-SMR under the adiabatic conditions was studied by Fernandez et al.[13]. Their
findings are used to validate the modelling results. In Figure 3, three rate constants are used
and it is quite clear that the reactor temperature is dependent on the value of carbonation rate
constant. For a smaller value of carbonation rate constant (kCO2 = 0.18 s-1), the
pre-breakthrough period is longer (~1500s) than higher values of kCO2 (~500s). The lower value
of kCO2 suggests that the sorbent is not highly reactive and the rate of CO2 adsorption is slow.
While in the case of higher value of kCO2 (0.7s-1), the rate of CO2 adsorption on the surface of
sorbent is very fast and hence the sorbent reached its full absorption capacity earlier. The
higher value is preferable for fast cycles of SE-SMR process. For the three different values of
carbonation rate constant, the final temperature of the system is the same i.e. 867.9K as this is
Figure 3: The effect of carbonation rate constant on the gas temperature profile at the outlet of reactor
at a feed temperature of 923K, S/C of 5.0, 35 bar and gas mass flow velocity of 3.5 kg m-2s-1 under
adiabatic conditions. Dotted lines are literature values [13] and solid lines are modelling results of this
study.
3.2
Sensitivity analysis of SE-SMR model
The optimum operating conditions for the SE-SMR process were determined by evaluating
the process performance under various conditions of temperature, pressure, S/C and gas mass
flow velocity. The simulation resultsobtained using the reactor modelare also compared with
the equilibrium results generated using CEA software.
3.2.1
Methodology of equilibrium calculationsusing CEA
The CEA software was used to generate the equilibrium data [44, 45]. This software is based
on minimization of Gibbs free energy (G) [46]. The chemical equilibrium analysis was done
by considering the gas species involved in the reactant and product streams, which are CH4,
allows specification of a restricted pool of species as potential equilibrium products. The
calculations of individual equilibrium molar outputs were performed on the basis of N2
balance, which allowed the determination of the total moles of product at equilibrium in post
processing, and its product with the relevant mole fractions predicted by the CEA output. The
solid carbon equilibrium product was not included as it is not significant in conditions of
excess stoichiometric steam of the present study.To study the effect of temperature, pressure
and S/C were fixed and the CEA code runs in temperature-pressure (tp) mode, corresponding
to an isothermal and isobaric process. Similarly, to study the pressure effect; temperature and
S/C conditions were fixed, still in tp mode.
3.2.2
Effect of temperature
The conventional SMR process is carried out in industry under high temperature
(800-1000°C) and high pressure (20-35bar) conditions [23, 24]. The SE-SMR process is simulated
under various temperatures (500-800 °C) but at a pressure of 30 bar, Ca/C of 1 and S/C of 3
using the CEA software.From the equilibrium results generated usingCEA it is concluded
that 99% conversion of CH4 is achieved at a high temperature between 700-800°C, S/C of
3.0, 1bar and Ca/C of 1.0. But at such a high temperature, H2 purity is just 76% because the
CO2 capture efficiency is almost zero at such a high temperature conditions. So there is a
trade-off between the conversion of CH4 and H2 purity.
In Figure 4, the effect of temperature on CH4 conversion, H2 purity and yield (wt. % of CH4)
and CO2 capture efficiency is presented. The simulation results generated using gPROMS are
compared with the equilibrium results generated using CEA to provide the maximum
conversion and H2 yield values permitted by equilibrium in the same conditions.
A CH4 conversion of 69.7% was achieved at 973K (72.7% at equilibrium). The higher
lower CO2 capture efficiency. As temperature is increased from 973K to 1050K, the drop in
H2 purity drops from 83.4% to 76.6%, caused by lower CO2 capture efficiency.This shows
that the carbonation reaction (R5) is not active at temperature higher than 973 K, hence a
drop in CO2 capturing efficiency results in more CO2 in the product, reducing the partial
pressure of the reforming reactants. Therefore, a drop in H2 is observed after 973 K. In
Figure 4(d), the drop in CO2 capturing is higher after 973K in modelling results as compared
to equilibrium results. This steep drop is because of the carbonation kinetic values used in the
modelling are not favourable at such a high temperature. The optimum temperature range for
the SE-SMR process at 30 bar and S/C of 3.0, Ca/C of 1 and gas mass flow velocity of 3.5 kg
[image:17.595.102.499.354.706.2]Figure 4: The effect of temperature on the a) CH4 conversion; b) H2 purity; c) H2 yield (wt. % of CH4)
and d) CO2capture efficiency at 30bar, S/C of 3.0, CaO/C of 1.0 and gas mass flow velocity of 3.5 kg
m-2s-1
In Figure 5, dynamic profiles of dry mole percent of H2 and CO2 in the temperature range of
873-973K are presented. The activity of sorbent was higher at lower temperatures (873K and
923K) and as the temperature increased beyond 923K, the activity of sorbent decreased.
Thepre-breakthrough period in the case of 873K and 923K was smaller than that of 973 K.
The higher activity of sorbent made the system with a lower temperature of 873 K preferable
in fast cyclic operation as high capacities were reached faster and were less limited by the
equilibrium maximum. The mole percent of CO2 and H2 in the pre-breakthrough period for
the SE-SMR process having 973K as feed temperature were 2.9% and 84.1% respectively.
By comparison at 923K feed temperature, the mole percents of CO2 and H2were 0.34% and
[image:18.595.170.426.452.650.2]87.3% respectively.
Figure 5: Composition profile of H2 and CO2 on dry basis at T=873-973K, 30bar, S/C of 3.0 and gas
The modelling results presented in Figure 4 and 5 show that 923K is the optimum
temperature in terms of CH4 conversion, H2 purity and yield, CO2 capture efficiency and
sorbent activity for the SE-SMR process operating under 30bar and S/C of 3.0.
3.2.3
Effect of pressure
Temperature has a positive effect on the dynamics of the reforming process as seen in
previous section, but according to Le-Chatelier’s principle pressure has a negative
equilibrium effect on the reforming process. Pressure has a positive effect on the kinetics of
CO2 sorption capture, as adsorption of CO2 on the surface of sorbent is favourable at a
pressure higher than 1bar [25]. In industrial processes, high pressure H2 is required
downstream of reformer and it is ill advised to generate H2 at a low pressure and then use
energy intensive compressors to pressurise it according to required storage conditions [26].
In the previous section, 923K is selected as an optimum temperature. So, the effect of
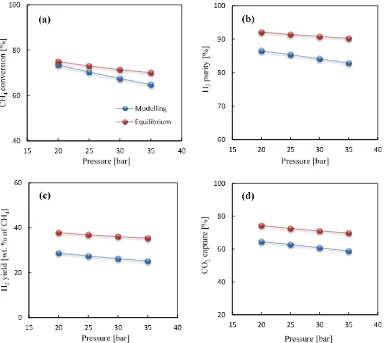
pressure on the SE-SMR is studied at this constant temperature. In Figure 6(a-d), it is
observed that with the increase in pressure from 20 to 35 bar the conversion of CH4 reduces
from 73.5% to 64.8% and same is the case with H2 purity and CO2 capture i.e. both reduce
from 86.5 to 82.9% and 64.5 to 58.8% respectively in the reactor model.
The dynamic behaviour of the SE-SMR process under different operating pressure conditions
is presented in Figure 6 (a-d). At 20 bar and S/C of 3.0, CH4 conversion is 73.5%. To study
the process atan industrial scale, 30bar is used and at this pressure the equilibrium
CO2capture efficiency and H2 purity is 71.0% and 90.8% respectively. Underthe same
operating conditions, the reactor model yields 60.8% CO2capture efficiency and 84.1% H2
Figure 6: The effect of pressure on the a) CH4 conversion; b) H2 purity; c) H2 yield (wt. % of CH4)
and d) CO2capture efficiency at 923 K, S/C of 3.0, CaO/C of 1.0 and gas mass flow velocity of 3.5 kg
m-2 s-1
The CO2capture efficiencyvaries with pressure because pressure has a significant effect on
the rate of adsorption of CO2 on the active site of the CaO based sorbent. In Figure 7, the
effect of pressure on the carbonation rate is illustrated. The rate of carbonation is higher at
20bar, hence more capture of CO2is expected at this pressure as compared to pressure higher
than 20 bar. The maximum value of carbonation rate for 20and 35 bar is 7.63×10⁻⁴ and
6.27×10⁻⁴mol kg-1 s-1respectively. This shows that the carbonation rate is almost 1.2 times
higher in the case of 20 bar than 35 bar. The pre-breakthrough period at 20 and 35 bar is 600s
and 700s respectively. So the sorbent reaches its maximum activity much earlier at 20 bar
Figure 7: The effect of pressure on the rate of carbonation at 923K, S/C of 3.0, CaO/C of 1.0 and gas
mass flow velocity of 3.5 kg m-2s-1
3.2.4
Effect of S/C
One of the vital parameters in the performance of SE-SMR process is S/C. The comparison of
modelling and equilibrium results in terms of CH4 conversion, H2 purity and yield (wt. % of
CH4) andCO2capture efficiencyare presented in Table 3 for S/C from 1 to 3, and dynamic
profiles of H2 and CO2 mole% are shown in Figure 8 for S/C up to 6.
Table 3: Effect of S/C on the CH4 conversion, H2 yield (wt. % of CH4), H2 purity and CO2capture
efficiency at 923K, 30bar and gas mass flow velocity of 3.5 kg m-2s-1
S/C
CH4 Conversion
[%]
H2 yield
[wt.% of
CH4]
H2 purity [%]
CO2 capture
[%]
[image:21.595.102.496.612.746.2]E : 34.4 E : 17.4 E : 67.6 E : 34.0
2
M : 51.7 M : 20.0 M : 74.7 M : 46.1
E : 56.2 E : 28.3 E : 83.5 E : 55.8
3
M : 67.5 M : 26.2 M : 84.1 M : 60.8
E : 71.4 E : 36.1 E : 90.8 E : 71.0
Where; M: gPROMS modelling results and E: Equilibrium results generated via CEA
Tabulated results show that the higher S/C is favourable for higher conversion of CH4. In the
S/C range 1to 3, the maximum conversion of CH4 and H2 purity are achieved at S/C of 3.0. It
is quite clear from the results in Figure 8 that more steam enhances the purity of H2 (74.7%
to 97.5% as S/C increases from 2 to 6). The higher amount of steam in the SE-SMR process
enhances the selectivity of H2 and the lower amount of CO2slows down the carbonation rate.
Ascan be seen in Figure 8, the pre-breakthrough period is shorter for S/C of 2 as compared to
the process having a higher S/C. The pre-breakthrough periods for the process having S/C of
2 and 6 were 600s and 1000s respectively. It is concluded from the results that higher S/C is
preferred for higher purity of H2, CH4 conversion and H2 yield althoughthis would reduce the
thermal efficiency of the process as more heat is required for the generation of the excess
steam. Since there is always a trade-off between the H2 purity/yield and the thermal
Figure 8: Dynamic profile of H2 and CO2 composition (dry basis) at the outlet of reactor for various
S/C (2-6) under the adiabatic conditions at 923K, 30bar and 3.5kg m-2s-1 gas mass flow velocity
Fernandez et al.[28] modelled the SE-SMR process for Ca/Cu looping system and they
studied the variation of temperature at the exit of the reactor for various S/C. They found that
temperature variation is almost negligible for S/C range of 2 to 6 and the length of the
pre-breakthrough period changed from 600 s to 1000 s. In Figure 9, the dynamic profile of
temperature generated in this work is presented for S/C of 2 to 6 and it is in excellent
agreement with literature results. At the start there is a rise in the temperature, it is because of
the exothermicity of the SE-SMR process. The rise in temperature for all S/C (2 to 6) is about
20K from the feed temperature. As expected from previous results, the pre-breakthrough
period in case of higher S/C is longer than the lower S/C.
The minimum temperature was reached in the post-breakthrough period when all the sorbent
was saturated. In the post-breakthrough period, only conventional SMR process took place.
For all S/Cin the range studied, the minimum temperature achieved was 881K i.e. drop of
42K from the feed temperature. Fernandez et al.[13]used 35bar and reported a minimum
Figure 9: Dynamic profiles of temperatures at the exit of reactor for various S/C at 30bar, 923K feed
temperature and 3.5kg m-2s-1 gas mass flow velocity
3.2.5
Effect of gas mass flow velocity
The gas mass flow velocity (Gs) is another important operating variable that affects the
performance of the system. The selection of Gsis highly dependent upon the length of the
reactor. Rostrup et al.[29] proposed 1.5-2 m s-1 velocity as the optimum velocity to get the
conversion of CH4 close to the equilibrium conditions.
In this work, various values ofGsare used to study the effect on the performance of the
SE-SMR process. In Figure 10, the dynamic variation of CO2 and H2 composition (dry basis) is
presented under the operating conditions of 923 K, 30 bar, S/C of 3.0 and various Gs (2 to 7
kg m-2 s-1). The lower G
s resulted in a longer pre-breakthrough period as the residence time ishigher in the reactor and a higher conversion of CH4 is achieved. For Gs of 2 kg m-2s-1, the
conversion of CH4was 71%. This was very close to equilibrium value of 71.4% under the
same operating conditions. As Gs increased, the CH4 conversion decreased because of shorter
residence time. The longer pre-breakthrough periods for lower Gs may be unsuitable for fast
from 7 kg m-2s-1to 2 kg m-2s-1. The optimum Gs selected was 3.5 kg m-2s-1due to having a
pre-breakthrough period of 700s. At this Gs,CH4 conversion and H2 purity is 67.5% and 84.2%
[image:25.595.171.427.195.387.2]respectively, corresponding to 71.4% and 90.8% atequilibrium.
Figure 10: Dynamic profile of H2 and CO2 composition (dry basis) at the outlet of reactor for various
Gsunder the adiabatic conditions, at 923K, 30bar and S/C of 3.0
3.3
Comparison of SE-SMR and SMR models
To compare the performance of the SE-SMR process with a conventional SMR process,
optimum values obtained through sensitivity analysis in previous sections are used.
In Figure 11, the effluent composition (dry basis) profiles are presented for the SE-SMR and
SMR processes under the operating conditions of 923K, 30bar, S/C 3.0 and Gs of 3.5 kg m-2s
-1. The compositions of H
2 and CO2 at equilibrium under the same operating conditions are also presented in this figure. Modelling results show that the composition of CO2 was almost
zero up to 700s in the SE-SMR and after t ≥1500s (~25 min), the CO2 compositions in SMR
is87% in SE-SMR but only 50% in SMR. In the CO2 post-breakthrough period (t≥1500s), the
sorbent was no longer active hence both SE-SMR and SMR processeshave the same CO2 and
[image:26.595.172.428.194.398.2]H2 compositions.
Figure 11: Effluent mole percent profiles of H2 and CO2 in SE-SMR and SMR process at 923K,
30bar, S/C of 3.0 and gas mass flow velocity of 3.5kg m-2s-1
The adsorption of CO2 on the active site of the sorbent is highly exothermic and it releases
considerable amount of heat (-178 kJ molCaO-1). In adiabatic conditions this results in higher
temperatures in the reactor bed for the SE-SMR, which is more favourable for the reforming
reactions. The enhancement in conversion of CH4 due to CO2 sorption is calculated. The
conversion enhancement reveals the advantage of using sorbent within the system as shown
in Figure 12 (a). The conversion enhancement factor E (t) is calculated as;
E t X X X
Where (XCH4)ad is the conversion of CH4 in the presence of adsorbent (ad) and (XCH4)nad is the
decreases at breakthrough when the sorbent gets saturated. As it can be seen that conversion
[image:27.595.99.498.164.360.2]enhancement is zero in the post-breakthrough period.
Figure 12: a) CH4conversion enhancement and b) Comparison of temperature profiles generated at the
exit of packed bed reactor in SE-SMR and SMRat 923K, 30bar, S/C of 3.0 and mass flow velocity of
3.5kg m-2s-1
The presence of sorbent with catalyst actually enhances the reforming reaction rates by
increasing the temperature of the process. The comparison of temperature profile for both
SE-SMR and SE-SMR is also presented in Figure 12 (b).
4.
Conclusion
The one-dimensional SE-SMR model developed using gPROMS mimics the modelling data
reported in literature [13]and shows an excellent agreement. The mathematical model under
both adiabatic and non-adiabatic conditions performs well according to the literature data.
Operating parameters, such as; temperature, pressure, S/C and gas mass flow velocity have a
strong influence on the performance of the SE-SMR process. The optimum temperature
67.5% CH4 conversion at S/C of 3.0 and 30bar and the purity of H2 achieved is 84.1%. The
selection of optimum pressure for industrial scale is a trade-off between H2 purity, plant
capital cost and downstream pressure requirements. The pressure as high as 30bar is
considered as optimum in this study as it fulfils the requirement of industrial pressure of H2
and gives a considerable purity of H2 (84.1%). Selection of optimum S/C is also a trade-off
between the purity of H2 and operational cost of the plant. The higher amount of steam
enhances the conversion of CH4 and gives more pure H2 but high steam requirement is not
feasible in terms of operational cost of the plant. S/C of 3.0 is selected to meet the
requirements of H2 purity at a minimum operational cost. The selection of gas mass flow
velocity is done on the basis of operational time of the process and H2 purity achieved at the
outlet of the reactor. The gas mass flow velocity of 2 kg m-2s-1induces onset of
pre-breakthrough period at 1200s while in the case of gas mas flow velocity of 7 kg m-2s-1this
period is 90s. The gas mass flow velocity of 3.5 kg m-2s-1is picked as an optimum value
having a pre-breakthrough period of 700 s and 67.5% CH4 conversion against the equilibrium
conversion of 71.4%. Furthermore, the comparison between the predictions of the SE-SMR
and SMR models shows enhancement of CH4 conversion by 180% due to the presence of the
sorbent in the reactor. The adsorption of CO2 on the active surface of the sorbent is highly
exothermic process and it releases considerable amount of heat (-178 kJ mol-1). This heat
promotes the reforming reactions and conversion above the conventional SMR process is
achieved.
Acknowledgement
NOMENCLATURE
av Interfacial area per unit volume of catalyst bed, m2/m3
Ci Concentration of component i, mol/m3
Ci,in Inlet concentration of component i, mol/m3
Ci,o Concentration of component i at t=0, mol/m3
Ci,s Concentration of component i on solid surface, mol/m3
Cpg Heat capacity of gas at constant pressure, J/(kg.K)
Cp,bed Heat capacity of bed at constant pressure, J/(kg.K)
Di Effective diffusion coefficient, m2/s
Dm Average molecular diffusivity, m2/s
dP Catalyst particle diameter, m
Dr Inner diameter of the reactor, m
Dz Axial dispersion coefficient, m2/s
Ej Activation energy of reaction j, J/mol
E(t) Conversion enhancement
Gs Gas mass flow velocity, kg/(m2.s)
hf Gas to solid heat transfer coefficient, W/(m2.s)
JD,i Chilton-Colburn j-factor for mass transfer
JH Chilton-Colburn j-factor for heat transfer
k Thermal conductivity, W/(m.K)
keff Effective thermal conductivity, W/(m.K)
kg,i Gas to solid mass transfer coefficient of component i, m3/m2s
Ki Adsorption constant of species i
Ko,i Reference adsorption constant of species i
Kj Thermodynamic equilibrium constant of reaction j
kz Axial thermal conductivity, W/(m.K)
L Packed bed length, m
pi Partial pressure of specie i, bar
P Total pressure, bar
pifeed Partial pressure of component i in feed, bar
Po Pressure at z=0, bar
Pin Inlet pressure of the feed, bar
Pr Prandtl number
qCO2
Solid phase concentration of CO2 (average on the surface of sorbent), mol/m3
R, Rg Ideal gas constant, J/(mol.K)
ri Rate of production of component i, mol/(kgcat.s)
rads Rate of adsorption of CO2, mol/(kg.s)
Re Reynolds number
Rj Rate of reaction j, mol/(kgcat.s)
Sci Schmidt’s number
T Temperature within system, K
Tin Inlet temperature, K
Ts Temperature of catalyst particles, K
Ts,o Temperature of solid particles at ‘t=0’, K
Tw Wall temperature, K
us, v Superficial velocity, m/s
XCH4 Fractional conversion of CH4
Hrex Heat of reaction at standard condition, J/mol
Hads Heat of adsorption reaction at standard condition, J/mol
P Pressure drop across the reactor, bar
Greek Letters
Denominator term in the reaction kinetics
zf Effective thermal conductivity, W/(m.K)
g Average gas thermal conductivity, W/(m.K)
s Solid thermal conductivity, W/(m.K)
zo Effective thermal conductivity of motionless fluid, W/(m.K)
f Density of fluid, kg/m3
cat Density of catalyst, kg/m3
ad Density of sorbent, kg/m3
j Effectiveness factor of reaction ‘j’
ij Stoichiometric coefficient of component ‘i’ in reaction ‘j’
g Viscosity of gas, Pa.s
APPENDIX A
Physical properties used in the reactor model are given as;
The axial mas dispersion coefficient is given as[30];
D D u dD u d A
Where Dz is the axial dispersion coefficient (m2/s), dp is the diameter of particle (m), us is the
interstitial gas velocity (m/s) and Dm is the average molecular diffusivity (m2/s).
The effective thermal conductivity is given by the following relations[31];
PrRe A
A
Where g is the average thermal conductivity of gas (W m-1 K-1)and s is the average thermal
conductivity of solid material(W m-1 K-1). The mass transfer coefficient is given as[32];
k j ReSc D
d A
j Re Sc A
The dimensionless numbers are given as,
Re u d Re A
Sc D Sc A
The heat transfer coefficient and its dimensionless numbers are given by the following
relations [32, 33];
h j C G
j Re Re A
j Re Re A
Pr C A
APPENDIX B
The kinetic rate equations and kinetic data used for this modelling work are given as;
R k
p p p
p p
K B
R p p pk p pK B
R k
p p p
p p
K B
k k exp RTE exp RT B
k k exp RTE exp RT B
k k exp RTE exp RT B
K exp T B
K exp T B
K K K B
K p K p K p K pp B
REFERENCES
[1] Yang RT. Gas separation by adsorption processes: Butterworth-Heinemann; 2013.
[2] Mayorga SG, Hufton JR, Sircar S, Gaffney TR. Sorption enhanced reaction process for
production of hydrogen. Phase 1 final report. Air Products and Chemicals, Inc., Allentown,
PA (United States); 1997.
[3] Barelli L, Bidini G, Gallorini F, Servili S. Hydrogen production through
sorption-enhanced steam methane reforming and membrane technology: a review. Energy.
2008;33:554-70.
[4] Metz B, Davidson O, De Coninck H, Loos M, Meyer L. IPCC special report on carbon
dioxide capture and storage. Prepared by Working Group III of the Intergovernmental Panel
on Climate Change. IPCC, Cambridge University Press: Cambridge, United Kingdom and
New York, USA. 2005;4.
[5] Roger W. Hydrogen production. Google Patents; 1933.
[6] Brun-Tsekhovoi A, Zadorin A, Katsobashvili YR, Kourdyumov S. The process of
catalytic steam-reforming of hydrocarbons in the presence of carbon dioxide acceptor.
Hydrogen energy progress VII, proceedings of the 7th world hydrogen energy
conference1988. p. 25-9.
[7] Hufton J, Mayorga S, Sircar S. Sorption enhanced reaction process for hydrogen
production. AIChE Journal. 1999;45:248-56.
[8] Ochoa-Fernández E, Haugen G, Zhao T, Rønning M, Aartun I, Børresen B, et al. Process
design simulation of H2 production by sorption enhanced steam methane reforming:
evaluation of potential CO2 acceptors. Green Chemistry. 2007;9:654-62.
[9] Han C, Harrison DP. Simultaneous shift reaction and carbon dioxide separation for the
[10] Ochoa-Fernández E, Haugen G, Zhao T, Rønning M, Aartun I, Børresen B, et al. Process
design simulation of H 2 production by sorption enhanced steam methane reforming:
evaluation of potential CO 2 acceptors. Green Chemistry. 2007;9:654-62.
[11] Alvarez D, Abanades JC. Determination of the critical product layer thickness in the
reaction of CaO with CO2. Industrial & engineering chemistry research. 2005;44:5608-15.
[12] Molinder RA. CO2 capture materials for sorption enhanced steam reforming: University
of Leeds; 2012.
[13] Fernandez J, Abanades J, Murillo R. Modeling of sorption enhanced steam methane
reforming in an adiabatic fixed bed reactor. Chemical Engineering Science. 2012;84:1-11.
[14] Lee DK, Baek IH, Yoon WL. Modeling and simulation for the methane steam reforming
enhanced by in situ CO 2 removal utilizing the CaO carbonation for H 2 production.
Chemical Engineering Science. 2004;59:931-42.
[15] Koumpouras GC, Alpay E, Stepanek F. Mathematical modelling of low-temperature
hydrogen production with in situ CO< sub> 2</sub> capture. Chemical Engineering Science.
2007;62:2833-41.
[16] Ding Y, Alpay E. Adsorption-enhanced steam–methane reforming. Chemical
Engineering Science. 2000;55:3929-40.
[17] Xiu G, Li P, Rodrigues AE. Adsorption-enhanced steam-methane reforming with
intraparticle-diffusion limitations. Chemical Engineering Journal. 2003;95:83-93.
[18] Li Z-s, Cai N-s. Modeling of multiple cycles for sorption-enhanced steam methane
reforming and sorbent regeneration in fixed bed reactor. Energy & Fuels. 2007;21:2909-18.
[19] Baker E. 87. The calcium oxide–carbon dioxide system in the pressure range 1—300
atmospheres. Journal of the Chemical Society (Resumed). 1962:464-70.
[20] Bhatia S, Perlmutter D. Effect of the product layer on the kinetics of the CO2 lime
[21] Rodríguez N, Alonso M, Abanades J. Experimental investigation of a circulating
fluidized bed reactor to capture CO2 with CaO. AIChE Journal. 2011;57:1356-66.
[22] Dedman A, Owen A. Calcium cyanamide synthesis. Part 4.—The reaction CaO+ CO 2=
CaCo 3. Transactions of the Faraday Society. 1962;58:2027-35.
[23] Rostrup-Nielsen JR. Catalytic steam reforming: Springer; 1984.
[24] Rostrup-Nielsen JR, Rostrup-Nielsen T. Large-scale hydrogen production. Cattech.
2002;6:150-9.
[25] Rydén M, Ramos P. H 2 production with CO 2 capture by sorption enhanced
chemical-looping reforming using NiO as oxygen carrier and CaO as CO 2 sorbent. Fuel Processing
Technology. 2012;96:27-36.
[26] Meyer J, Mastin J, Bjørnebøle T-K, Ryberg T, Eldrup N. Techno-economical study of
the Zero Emission Gas power concept. Energy Procedia. 2011;4:1949-56.
[27] Stevens JF, Krishnamurthy B, Atanassova P, Spilker K. Development of 50 kW fuel
processor for stationary fuel cell applications. Chevron Techology Ventures, LLC; 2007.
[28] Fernandez J, Abanades J, Grasa G. Modeling of Sorption Enhanced Steam Methane
Reforming. Part II: Simulation within a novel Ca/Cu chemical loop process for hydrogen
production. Chemical Engineering Science. 2012.
[29] Rostrup-Nielsen J, Sehested J, Nørskov JK. Hydrogen and synthesis gas by steam-and
CO 2 reforming. Advances in Catalysis2002.
[30] Edwards M, Richardson J. Gas dispersion in packed beds. Chemical Engineering
Science. 1968;23:109-23.
[31] Yagi S, Kunii D, Wakao N. Studies on axial effective thermal conductivities in packed
beds. AIChE Journal. 1960;6:543-6.
[33] Handley D, Heggs PJ. The effect of thermal conductivity of the packing material on
transient heat transfer in a fixed bed. International Journal of Heat and Mass Transfer.

![Table 2: Physical parameters and operating conditions used in reactor model validation[13]](https://thumb-us.123doks.com/thumbv2/123dok_us/1991753.161096/11.595.110.489.225.671/table-physical-parameters-operating-conditions-reactor-model-validation.webp)