UNIVERSITI TEKNIKAL MALAYSIA MELAKA
OPTIMIZATION OF FIBER OPTIC SENSOR IN DETECTING
THE CONDITION OF CORN OIL FOR DAILY USAGE OF
HEALTHY DIET BY USING FACTORIAL DESIGN
This report is submitted in accordance with the requirement of the Universiti Teknikal Malaysia Melaka (UTeM) for the Bachelor of Electronic Engineering
Technology (Telecommunication) with Honours.
by
STUDENT NAME: NUR HIDAYAH BINTI MOHD ROSDI
MATRIX NUMBER: B071410453
IC NUMBER: 950608035500
UNIVERSITI TEKNIKAL MALAYSIA MELAKA
BORANG PENGESAHAN STATUS LAPORAN PROJEK SARJANA MUDA
TAJUK: OPTIMIZATION OF FIBER OPIC SENSOR IN DETECTING THE CONDITION OF CORN OIL FOR DAILY USAGE OF HEALTHY DIET BY USING FACTORIAL DESIGN
SESI PENGAJIAN: 2017/18 Semester 1
Saya NUR HIDAYAH BINTI MOHD ROSDI
mengaku membenarkan Laporan PSM ini disimpan di Perpustakaan Universiti Teknikal Malaysia Melaka (UTeM) dengan syarat-syarat kegunaan seperti berikut:
1. Laporan PSM adalah hak milik Universiti Teknikal Malaysia Melaka dan penulis. 2. Perpustakaan Universiti Teknikal Malaysia Melaka dibenarkan membuat salinan untuk
tujuan pengajian sahaja dengan izin penulis.
3. Perpustakaan dibenarkan membuat salinan laporan PSM ini sebagai bahan pertukaran antara institusi pengajian tinggi.
4. **Sila tandakan ( ) SULIT
TERHAD
TIDAK TERHAD
(Mengandungi maklumat yang berdarjah keselamatan atau kepentingan Malaysia sebagaimana yang termaktub dalam AKTA RAHSIA RASMI 1972)
(Mengandungi maklumat TERHAD yang telah ditentukan oleh organisasi/badan di mana penyelidikan dijalankan)
Alamat Tetap:
Lot 1874 Kampung Morak, Palekbang, 16040
Tumpat Kelantan
Tarikh: September 2017
Disahkanoleh:
Cop Rasmi:
Tarikh: September 2017
DECLARATION
I hereby, declared this report entitled Optimization of Fiber Optic Sensor in Detecting Condition of Corn Oil for Daily Usage of Healthy Diet by using Factorial Design is the results of my own research except as cited in references.
Signature : Hidayah
Author‘s Name : Nur Hidayah Binti Mohd Rosdi
APPROVAL
This report is submitted to the Faculty of Engineering Technology of UTeM as a partial fulfillment of the requirements for the degree of Bachelor of Electronic Engineering Technology (Telecommunication) with Honours. The member of the supervisory is as follow:
i
ABSTRAK
Tujuan projek ini adalah untuk mengoptimumkan prestasi sensor gentian optik untuk
mengesan keadaan minyak masak. Sensor gentian optik digunakan sebagai alat
pengesan dengan menggunakan gentian optik. Serat boleh digunakan kerana saiznya
yang kecil atau kerana tiada kuasa elektrik diperlukan di lokasi terpencil, atau
kerana banyak sensor dapat dikombinasi sepanjang panjang serat dengan
menggunakan pergeseran panjang gelombang cahaya untuk setiap sensor, atau
dengan merasakan kelewatan masa sebagai cahaya pas sepanjang gentian melalui
setiap sensor tetapi bergantung kepada aplikasi. Sensor gentian optik juga
merupakan sistem yang terdiri daripada kabel gentian optik (FOC) yang
disambungkan kepada sensor jauh atau penguat. FOC ialah kabel yang
mengandungi satu atau lebih serat optik yang digunakan untuk membawa cahaya.
Sensor gentian optik boleh mengukur parameter perbezaan seperti cecair, kimia,
suhu dan sebagainya. Untuk kajian ini, sensor optik gentian telah digunakan untuk
mengukur parameter yang diberikan seperti sumber cahaya, jenis serat dan masa
mencelup. Oleh itu, kajian ini adalah untuk menganalisis prestasi sensor gentian
optik apabila ia digunakan sebagai sensor cecair untuk mengesan keadaan minyak
goreng (minyak jagung) dengan menggunakan aplikasi matematik untuk mengetahui
ii
ABSTRACT
iii
DEDICATION
iv
ACKNOWLEDGEMENT
v
TABLE OF CONTENT
Abstrak i
Abstract ii
Dedication iii
Acknowledgement iv
Table of Content v
List of Tables viii
List of Figures ix
CHAPTER 1 : INTRODUCTION 1
1.0 Introduction 1
1.1 Problem Statement 2
1.2 Objective 3
1.3 Scope 4
CHAPTER 2 : LITERATURE REVIEW 5
2.0 Introduction 5
2.1 Fiber Optic Sensor 5
2.2 Optical Fiber
2.2.1 Fiber Material 2.2.2 Light Sources 2.2.3 Components 2.2.4 Fiber Attenuation 2.2.5 Dispersion 2.2.6 Crosstalk
7 9 10 10 11 11 12 2.3 Fiber Optic Cable
2.3.1 Single Mode Fiber Optic 2.3.2 Multimode Fiber Optic 2.3.3 Fiber Optic Connectors
12 14 15 17
vi 2.4.1 Repetition of Factorial Design 21 2.5 Design of Experiment
2.5.1 Choosing Factors and Response Variable
2.5.2 Performing Simulation Experiments
21 22
22 2.6 Corn Oil
2.6.1 Composition of Corn Oil
23 23
CHAPTER 3 : METHODOLOGY 25
3.0 Introduction 25
3.1 Methodology of Project 25
3.1.1 3.1.2 3.1.3 3.1.4 3.1.5 3.1.6 3.1.7 Title Finding Literature Review Deciding Raw Material Develop Sensor
Testing the Sensor Analyze Sensor
Writing Formal Report
26 27 27 28 28 28 28
3.2 Flowchart 29
3.3 Method Selection (Factorial Design Method) 30
3.4 Setup and Assign Parameter 31
3.4.1 3.4.2 Equipment Used Parameter used 31 34
3.5 Cut and Splicing Process 35
3.5.1 3.5.2
Splicing and Cleaving Process Splicing Process
35 36 3.6 Data collection
3.6.1 Types of Analysis
39 39
3.7 Design Expert Software 41
CHAPTER 4 : RESULT AND DATA ANALYSIS 45
4.0 Introduction 45
vii 4.1.1 Experimental Results for First Usage
of Corn Oil
45
4.1.1.1 Analysis for First Usage of Corn Oil
47
4.1.2 Experimental Results for Second Usage of Corn Oil
56
4.2.2.1 Analysis for Second Usage of Corn Oil
57
4.1.3 Experimental Results for 3rd Usage of Corn Oil
66
4.2.3.1 Analysis for Third Usage of Corn Oil
67
4.2 Optimization Result 68
4.2.1 4.2.2
Optimization Result First Usage Optimization Result Second Usage
68 72
4.3 Discussion 74
CHAPTER 5 : CONCLUSION AND RECOMMENDATION 76
5.1 Conclusion 76
5.2 Recommendation 78
REFERENCES 79
viii
LIST OF TABLES
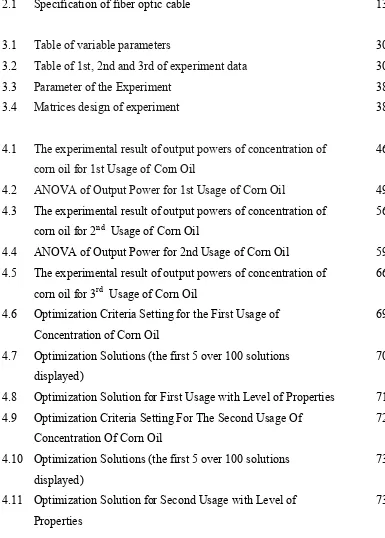
2.1 Specification of fiber optic cable 13
3.1 Table of variable parameters 30
3.2 Table of 1st, 2nd and 3rd of experiment data 30
3.3 Parameter of the Experiment 38
3.4 Matrices design of experiment 38
4.1 The experimental result of output powers of concentration of corn oil for 1st Usage of Corn Oil
46
4.2 ANOVA of Output Power for 1st Usage of Corn Oil 49
4.3 The experimental result of output powers of concentration of corn oil for 2nd Usage of Corn Oil
56
4.4 ANOVA of Output Power for 2nd Usage of Corn Oil 59 4.5 The experimental result of output powers of concentration of
corn oil for 3rd Usage of Corn Oil
66
4.6 Optimization Criteria Setting for the First Usage of Concentration of Corn Oil
69
4.7 Optimization Solutions (the first 5 over 100 solutions displayed)
70
4.8 Optimization Solution for First Usage with Level of Properties 71 4.9 Optimization Criteria Setting For The Second Usage Of
Concentration Of Corn Oil
72
4.10 Optimization Solutions (the first 5 over 100 solutions displayed)
73
4.11 Optimization Solution for Second Usage with Level of Properties
[image:12.595.124.509.162.700.2]ix
LIST OF FIGURES
2.1 Basic Fiber Optic 5
2.2 Extrinsic Fiber Optic Sensor 6
2.3 Optical Fiber Configuration 8
2.4 Cross section of typical communication fiber 9
2.5 Example fiber optic cable 12
2.6 Diameter of single mode fiber 14
2.7 Transmission over a single mode fiber 14
2.8 Diameter of multimode fiber 15
2.9 Example of fiber optic connectors 17
2.10 SC Multimode Buffered Fiber Connector 18
2.11 SC Singlemode Buffered Fiber Connector 18
3.1 Step of the Project Methodology 26
3.2 Flowchart of the Project 29
3.3 Single mode fiber optic cable with SC type connector 32
3.4 Multimode fiber optic cable with SC type connector 32
3.5 Fiber optic stripper 32
3.6 Seven holes fiber optic stripper 32
3.7 Splicing machine 33
3.8 Fiber optic cleaver 33
3.9 Canned Isopropyl Alcohol 33
3.10 Fiber optic cleaning kit 33
3.11 Light source devices 34
3.12 Optical fiber power meter 34
3.13 Selecting the Regular Two Level Factorial Design 41 3.14 Specifying name, units and type of all factors 42
3.15 Matrix Design 42
x
3.17 Optimization section 44
4.1 Half-Normal Plot for Output Power for 1st Usage of Corn Oil 48
4.2 Normal Plot for Output Power for 1st Usage of Corn Oil 48
4.3 Normal Plot of Residuals for Output Power for 1st Usage of Corn Oil
51
4.4 Residuals vs. Predicted for Output Power for 1st Usage of Corn Oil
51
4.5 One Factor Effect Plot for Output Power (Type of Fiber) for 1st Usage of Corn Oil
52
4.6 One Factor Effect Plot for Output Power (Type of Light Source) for 1st Usage of Corn Oil Concentration of Corn Oil
53
4.7 Interaction Effect Plot for Output Power (Type of Fiber and Type of Light Source)
53
4.8 Interaction Effect Plot for Output Power (Type of Fiber and Type of Light Source)
54
4.9 Half-Normal Plot for Output Power for 2nd Usage of Corn Oil 57 4.10 Normal Plot for Output Power for 2nd Usage of Corn Oil 58 4.11 Normal Plot of Residuals for Output Power for 2nd Usage of
Corn Oil
61
4.12 Residuals vs. Predicted for Output Power for 2nd Usage of Corn Oil
61
4.13 One Factor Effect Plot for Output Power (Type of Fiber) for 2nd Usage of Corn Oil
62
4.14 One Factor Effect Plot for Output Power (Type of Light Source) for 2nd Usage of Corn Oil
63
4.15 Interaction Effect Plot for Output Power (Type of Fiber and Type of Light Source)
63
4.16 Interaction Effect Plot for Output Power (Type of Fiber and Type of Light Source)
1
CHAPTER 1
INTRODUCTION
1.0 Introduction
2 healthy diet. Healthy diet implies a variety of foods that give you the nutrients that you need to maintain your health, feel good, and have energy. Peoples, whose want maintain a good diet normally people take corn oil as their daily usage because corn oil is a replacement of saturated fats. Variable parameter that has been used in this research are type of fiber, type of light source and dipping time. The expected result from this research is output power. The output power of this research is power that display at optical fiber power meter that are in decibel (dB). In this research, to analyse the performance of fiber optic sensor when it used as liquid sensor to detect condition and viscosity of cooking oil by using the factorial design method to develop fiber optic sensor as sensor in detecting condition of corn oil.
1.1 Problem Statement
Most of people nowadays are prefer to practise a healthy diet in their daily life. But, sometimes in the healthy life diet they didn‘t concern about their oil used. Oil used is one of the most important element in healthy diet because oil is the main ingredient to make a food. Normally, people who takes a healthy diet life style, preferred to use corn oil in their food taking because corn oil full of good fats and a powerful antioxidant that can keep good health in their daily life.
3
1.2 Objective
The objectives of this project are to:
I. To study and develop Fiber Optic Sensor (F.O.S) as viscosity corn oil detection. II. To investigate best combination of fiber optic sensor which optimize the output
power.
4
1.3 Scope
Before new technology or technique is applied, the system must be tested so that the performance of the design and analysis can be known. However, for any project to be done, the limitation of the scope of the work must be very realistic and applicable. In order to achieve the objective of study, the following were outline as follows:
I. Analyze the concentration corn oil in three condition which is different with first, second, and third usage
II. Develop the fiber optic sensor to detect the viscosity of corn oil
5
CHAPTER 2
LITERATURE REVIEW
2.0 Introduction
In this chapter, the research has been done by other person which are related with the research that we were discussed. The facts from their research were used to guide this research in correct way. The sources come from journals or articles written by the previous researchers related to this project. Their theories and results help this research as they can be a comparison between this research and their researches.
[image:19.595.228.413.605.707.2]2.1 Fiber Optic Sensor
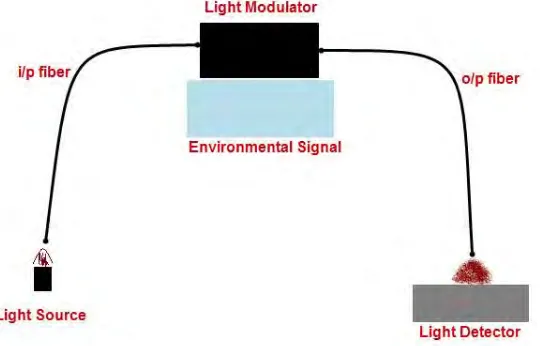
6 Fiber optic sensor has an optical fiber that connected to a light source to allow for detect in tight space. It is suitable for checking tension in solid structures because of its small size, low cost, ability to be embedded internally, and multiplexing ability. In particular, it uses an optical fibers as the sensing element, which are recognized intrinsic sensor, or uses them to transport signals from the remote sensor to the signal processing module.
Figure 2.2: Extrinsic Fiber Optic Sensor
It is the basis for recognizing between multiple multiplexed sensors and distributed sensors. In sensors distributed there is only one element of the detector, and the objective of signal processing is to obtain measurement as a position element along the sensing component. In contrast, point multiplexing multiplexing comprises measurements of the appropriate dimensions for each discrete detection component. It must be explained that both types of sensors may coincide within the same network, which occur once again in hybrid networks. As far as the type of optical signal is concerned, one can make an initial qualification between the network capable of combining the sensor by using the optic signal level for data transmission (interferometric sensor network), or that relies on classifying the intensity of light (by some multiplexing techniques) which we will call intensity sensor network. It is an equation of this group that is used in most of its established.
7 networks in general and in the sensor ones in specifically is the optimized value of the received transmission level of each sensors. The optical fiber transmission system always has accessible to the scope of optical power scope, for example the current contrast between the maximum level of signal that can be received by a unsaturated detector and the corresponding minimum where the system will work with the acceptable signal to noise ratio. (R.A. Perez-Herrera ⇑, 2013)
According to (R.McColpin, 2013) , with optical fiber sensing distributed, analyzing the reflections of laser light from various spots in the fibers, temperature and glass strain can be determined at any point in the well , and the fiber can be transformed into a series of distributed microphones and hydrophones.
In communication system, systems were initially considered as utilizing single mode, high limit fibers in conjuction with laser sources. It soon was recognized, however that highly multimode fibers in combination with LED (or laser) sources had a vital place too.
2.2 Optical Fiber
Optical fiber is a kind of medium which transmits light beam, it is small and adaptable. Optical fiber is the inner core of the optical cable which is used for transmission. Optical fibers are small, lightweight, and adaptable that can work over a wide range of environmental condition and react to various physical properties. Optical fiber sensor technologies are also developed in recent years that offer a few points of interest such as increased sensitivity, insusceptibility of electromagnetic interference, small volume and light weight.
8 contrary to what is happening in all other sensing technologies. The ultimate advantage is total immunity to external electromagnetic interference, multi-way reflection of artificial and man-made goods and terrible climate disorders. In addition, it displays broad bandwidth and low transmission loss, empowering broad geographical coverage, where necessary, bypassing the fibers allowing the sensors to be incorporated into the monitored structure, they can work without electrical power from local batteries outside the terminal and they reduce the danger of early conditions. (Lopez-Amo, 2012)
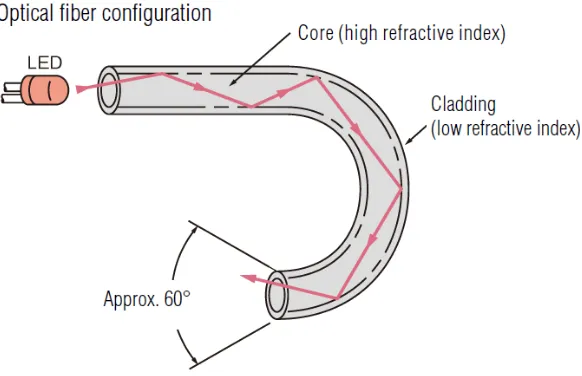
Figure 2.3: Optical Fiber Configuration
9 Optical fibers experience power loss and signal dissipation when signals are sent along the length of the fiber. It is a very low fiber loss and the possibility of zero diffusion at a certain wavelength that promotes us to adapt the fiber to replace the wire or future signal transmission system in the future. (Yeh, 2013)
2.2.1 Fiber Materials and properties
Silica fiber is a fiber optic communication system of basic building blocks. Earlier researchers have focused on enhancing the purity of silica fiber and have achieved fiber losses as low as 0.14dB/km at a wavelength of 1.55um. (Yeh, 2013).
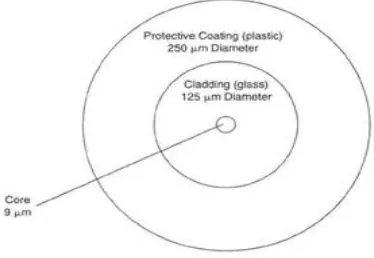
[image:23.595.242.429.543.672.2]Long distance transmission is not only thing a matters of communications. It is also important to be able to bring a lot of information, which in the communications world is called bandwidth. The wider the bandwidth, more information signal can be carried. Optical fiber can transmit those signals without seriously limiting their bandwidth. Optical fiber are regularly compared to human hair. The sizes are close, but fiber is stiffer. On a microscopic scale, a well-made optical fiber is also much smoother than a human hair. (Hecht, 2015)
10
2.2.2 Light Sources and Detectors
To take the advantage of low fiber loss and zero dispersion at longer wavelengths, the pattern in optical fiber communication systems has been consistently moving toward longer wavelength. (Yeh, 2013).
2.2.3 Components
In spite fiber loss has been reduced as 0.14dB/km for single mode fiber, the losses in connector, splices and other components are still very high. Typically, a single connector can have losses in excess of dB, which limits system performance. Optical coupling between optical fiber and source detectors still leave room for improvement. (Yeh, 2013).
2.2.3.1 Optical Cable Performance
Cable insertion loss is comprised of the sum of the attenuation (length dependent) and short length (length-independent) losses. Both sources of loss must be considered when choosing or designing a cable for particular application. (Barnoski, 2012)
2.2.3.2 Mechanical Performance