the hydroxyl radical with the atmospheric biogenics isoprene, alpha-pinene and
delta-3-carene
.
White Rose Research Online URL for this paper:
http://eprints.whiterose.ac.uk/122956/
Version: Published Version
Article:
Dillon, Terry J. orcid.org/0000-0001-8974-9410, Dulitz, Katrin, Groß, Christoph B M et al.
(1 more author) (2017) Temperature-dependent rate coefficients for the reactions of the
hydroxyl radical with the atmospheric biogenics isoprene, alpha-pinene and
delta-3-carene. Atmospheric Chemistry and Physics. pp. 15137-15150. ISSN 1680-7324
https://doi.org/10.5194/acp-17-15137-2017
eprints@whiterose.ac.uk https://eprints.whiterose.ac.uk/ Reuse
Items deposited in White Rose Research Online are protected by copyright, with all rights reserved unless indicated otherwise. They may be downloaded and/or printed for private study, or other acts as permitted by national copyright laws. The publisher or other rights holders may allow further reproduction and re-use of the full text version. This is indicated by the licence information on the White Rose Research Online record for the item.
Takedown
If you consider content in White Rose Research Online to be in breach of UK law, please notify us by
https://doi.org/10.5194/acp-17-15137-2017 © Author(s) 2017. This work is distributed under the Creative Commons Attribution 4.0 License.
Temperature-dependent rate coefficients for the reactions of the
hydroxyl radical with the atmospheric biogenics isoprene,
alpha-pinene and delta-3-carene
Terry J. Dillon1,a, Katrin Dulitz1,b, Christoph B. M. Groß1, and John N. Crowley1 1Department of Air Chemistry, Max Planck Institute for Chemistry, 55128 Mainz, Germany
anow at: Wolfson Atmospheric Chemistry Laboratories, Department of Chemistry, University of York, YO10 5DD, York, UK bnow at: Physikalisches Institut, University of Freiburg, Hermann-Herder Str. 3, 79104 Freiburg, Germany
Correspondence:Terry J. Dillon (terry.dillon@york.ac.uk)
Received: 16 June 2017 – Discussion started: 3 July 2017
Revised: 6 October 2017 – Accepted: 18 October 2017 – Published: 21 December 2017
Abstract. Pulsed laser methods for OH generation and de-tection were used to study atmospheric degradation reac-tions for three important biogenic gases: OH+isoprene (Reaction R1), OH+α-pinene (Reaction R2) and OH +1 -3-carene (Reaction R3). Gas-phase rate coefficients were characterized by non-Arrhenius kinetics for all three reactions. For (R1), k1 (241–356 K)=(1.93±0.08)× 10−11exp{(466±12)/T}cm3molecule−1s−1 was deter-mined, with a room temperature value ofk1(297 K)=(9.3± 0.4)×10−11cm3molecule−1s−1, independent of bath-gas pressure (5–200 Torr) and composition (M=N2or air). Ac-curacy and precision were enhanced by online optical mon-itoring of isoprene, with absolute concentrations obtained via an absorption cross section, σisoprene=(1.28±0.06)× 10−17cm2molecule−1atλ=184.95 nm, determined in this work. These results indicate that significant discrepancies be-tween previous absolute and relative-rate determinations of
k1 result in part from σ values used to derive the isoprene concentration in high-precision absolute determinations.
Similar methods were used to determine rate coefficients (in 10−11cm3molecule−1s−1) for (R2)–(R3): k2 (238– 357 K)=(1.83±0.04)×exp{(330±6)/T} and k3 (235– 357 K)=(2.48±0.14)×exp{(357±17)/T}. This is the first temperature-dependent dataset for (R3) and enables the calculation of reliable atmospheric lifetimes with respect to OH removal for e.g. boreal forest springtime condi-tions. Room temperature values of k2 (296 K)=(5.4± 0.2)×10−11cm3molecule−1s−1 and k3 (297 K)=(8.1± 0.3)×10−11cm3molecule−1s−1were independent of bath-gas pressure (7–200 Torr, N2 or air) and in good
agree-ment with previously reported values. In the course of this work, 184.95 nm absorption cross sections were determined:
σ=(1.54±0.08)×10−17cm2molecule−1forα-pinene and
(2.40±0.12)×10−17cm2molecule−1for1-3-carene.
1 Introduction
Large quantities and varieties of volatile organic compounds (VOC) are released into Earth’s atmosphere from vegeta-tion; such biogenic emissions exceed those of anthropogenic origin by a factor of∼10 (Goldstein and Galbally, 2007). Isoprene (2-methyl-1,3-butadiene, C5H8)contributes about 40 % (Guenther et al., 1995) of this gigaton (1015g C) emis-sion of biogenic VOC. The hydroxyl radical, OH, is the pri-mary oxidant in the troposphere, initiating the degradation of most important VOC such as CH4, isoprene and the monoter-penes (two isoprene units; molecular formula of C10H16). (Atkinson and Arey, 2003). VOC lifetimes are thus con-strained by OH, and its abundance is an important test of model reliability.
mechanisms.
OH+isoprene→(products) (R1)
Contrary to these predictions, results from field campaigns have demonstrated that a high OH concentration is main-tained (Butler et al., 2008; Lelieveld et al., 2008; Martinez et al., 2010; Stone et al., 2011), with the greatest discrepancies (factor of≈3 to 10) between measured and modelled [OH] being observed where isoprene mixing ratios were large (Ku-bistin et al., 2010). The representation of photochemistry in models relies almost exclusively on lab-based measurements e.g. of absorption cross sections, quantum yields, rate co-efficients and product yields. For (R1), the rate coco-efficients
k1(T )reported in the literature are characterized by small but significant differences, notably at temperatures away from 298 K. Accordingly, in the work presented in this paper, ab-solute rate coefficientsk1(241–356 K) were determined by highly accurate methods at realistic atmospheric temperature conditions.
The largest global contribution to atmospheric terpene emissions is from boreal forests covering Canada, north-ern Europe and Siberia, together encompassing one-third of Earth’s forests. Emissions peak in summer due to strong cor-relations with temperature and photosynthetic activity. How-ever, similar emission maxima have been observed in the au-tumn and in late winter/early spring when they are attributed to an increase in photorespiration rate (Back et al., 2005; Hakola et al., 2003). Throughout the year shorter bursts of terpene emission, associated with damage induced by e.g. an-imals (Heijari et al., 2011), pathogens, storms (Haase et al., 2011) and harvesting, may impact on the local OH bud-get (Noelscher et al., 2012). Elsewhere, monoterpenes have been detected from other vegetation, notably the forest floor (Hellen et al., 2006) and over active phytoplankton blooms in the Southern Ocean (Yassaa et al., 2008).
Oxidation of terpenes proceeds to a vast number of gas-and condensed-phase products, with consequent production of tropospheric ozone, peroxyacyl nitrates and secondary or-ganic aerosol (Atkinson and Arey, 2003). The product distri-bution from any given monoterpene depends upon physical conditions of temperature, pressure and humidity, together with the identity of the primary oxidant. Reactions with OH, O3and perhaps Cl initiate terpene degradation by day, with NO3contributing at night (Ng et al., 2017). The relative im-portance of these reactions depends on both the availability of the oxidant and the size of the corresponding rate co-efficient k(T ). These rate coefficients are often reasonably well-established at around ambient temperature, though the database is sparse for terpene reactions for low-temperature conditions (T <298 K) most relevant to high northern lati-tudes.
Summertime observations in the Finnish boreal forest (Williams et al., 2011) demonstrate that more than half the total terpene concentration measured above the boreal forest
canopy was accounted for by two species:α-pinene (2,6,6-trimethylbicyclo-[3.1.1]hept-2-ene) and 1-3-carene (3,7,7-trimethylbicyclo[4.1.0]hept-3-ene) (Hakola et al., 2012; Yas-saa et al., 2008). Accordingly, this paper describes lab-based experiments to study (R2)–(R3) of OH with these two partic-ularly important biogenic VOC:
OH+α-pinene→(products) (R2)
OH+1-3-carene→(products) (R3)
The techniques employed here allowed the first absolute ki-netic studies of (R2 and R3) at the temperatures most repre-sentative of boreal forests, which can be as low as 253 K dur-ing late-autumn and early-sprdur-ing months throughout which monoterpene emissions persist (Hakola et al., 2012).
2 Experimental
The technique of pulsed laser photolysis (PLP) radical gener-ation coupled to pulsed laser-induced fluorescence (LIF) de-tection of OH has been used in several absolute kinetic stud-ies of OH+VOC reactions from this laboratory. Details of the apparatus and methods were published previously (Dil-lon et al., 2012; Karunanandan et al., 2007), and therefore only a brief description is given here.
Experiments were conducted in a 500 cm3 quartz reac-tor. Cell temperature was controlled by circulating a cryo-genic fluid through an outer jacket and monitored with a J-type thermocouple; pressure was monitored using capac-itance manometers. Gas flow rates of up to 2000 cm3min−1 ensured that a fresh gas sample was available for photol-ysis at each laser pulse. Fluorescence from OH was de-tected by a photomultiplier tube screened by a 309 nm in-terference filter and a BG 26 glass cut-off filter. Excita-tion of the A26(ν=1)←X25(ν=0),Q11(1) transition at 282 nm was achieved using the frequency-doubled emission from a Nd:YAG pumped dye laser. The detection limit at
P =50 mbar (air) was found to be≈109molecule cm−3for aS / N=1 (20 scans). An exciplex laser operating at 248 nm (KrF) was used to initiate radical chemistry via photolysis of H2O2(Reaction R4).
H2O2+hν(248 nm)→2OH (R4)
Typically a laser fluence of 12 mJ cm−2 was used with [H2O2]=1×10¹⁴molecules cm−3to generate [OH]≈3× 10¹¹molecules cm−3. Data analysis (see Sect. 3) was consid-erably simplified by working under pseudo-first-order condi-tions of [H2O2] ≫[OH], even when the concentrations of the organic reactant were low, OH then reacting mainly with H2O2.
OH+H2O2→HO2+H2O (R5)
and the probe lasers was stepped from 0 to a maximum of 15 ms. Accuracy and precision of the rate coefficients deter-mined in this work was further enhanced by online monitor-ing of the terpenoids isoprene,α-pinene and1-3-carene by vacuum ultraviolet (VUV) absorption spectroscopy. In order to achieve this, absorption cross sections,σ, were determined experimentally by recording the attenuation of VUV light by static samples of each terpenoid. Two absorption cells were used with optical path lengthl=30.4 cm (fitted with heated quartz windows) and l=1 cm. Concentrations were deter-mined by manometric methods, with absolute cell pressure measured to an accuracy of ±0.01 Torr using a calibrated 10 Torr capacitance manometer. Samples were supplied ei-ther undiluted from the headspace above a liquid sample or from a glass storage bulb as a dilute mixture (≈1 part in 1000 N2). These two supply methods had complementary ad-vantages and disadad-vantages. Use of undiluted samples was more direct but had uncertainties due to the measurement of small sample pressures and the potential for VOC (present at high concentrations) to condense onto the windows of the 1 cm absorption cell (high surface area to volume ratio). These problems were minimized when using dilute VOC at higher pressure in the 30 cm cell (with relatively small sur-face area to volume ratio) but with the potential for errors associated with sample preparation and storage.
Collimated light from either a low-pressure Hg lamp (λ=184.95 nm) or a D2lamp (180–260 nm) transmitted the sample and was focussed onto the entrance slit of a 0.5 m monochromator equipped with a grating (300 lines mm−1 blazed at 200 nm) and a diode array detector. The volume around the lamp, cell and monochromator was purged with N2to minimize absorption by O2, O3or H2O. Spectra were recorded at an experimental resolution of 0.4 nm, estimated from full width at half maximum observed for either the
λ=184.95 nm or 253.65 nm Hg lines, as appropriate. Ab-sorption cross sections were obtained via the Beer–Lambert Law (Eq. 1).
I =I0×exp{−σ l[terpenoid]} (1)
whereI andI0are respectively the transmitted and incident light intensity and l is the optical path length.
Online reagent monitoring in kinetic experiments was con-ducted downstream from the photolysis cell, using an ab-sorption cell (l=43.8 cm) equipped with a low-pressure Hg lamp and a 185 nm interference filter. This set-up was used to measure absolute reagent concentrations via VUV optical absorption at λ=184.95 nm. Following the application of small corrections for measured 254 nm stray light intensity (<8 %) and differences inT (<30 %) andP (<1 %) between the cells, [terpenoids] of the order of 1012molecule cm−3 could be measured (see Sect. 3.1). A comparison of these optically derived concentrations to approximate manometric measurements was used to confirm that no significant frac-tion of any of the terpenoids was deposited at the walls in low-temperature experiments.
180 190 200 210 220 230
섈/nm 0
2 4 6 8
섕
/1
0
-1
7cm
m
ol
ec
ul
e
2
-1
Campuzano-Jostetal. (2004)
[image:4.612.309.547.63.276.2]Martins etal. (2009) This work
Figure 1.UV absorption spectra for isoprene from this work and from the literature. The red solid line represents data recorded at a resolution of±0.4 nm; the red star depicts σisoprene=(1.28± 0.02)×10−17cm2molecule−1 at 184.95 nm (see Fig. 2) subse-quently used to derive absolute concentrations for kinetic experi-ments. Results from this work agree well with the more extensive, high-resolution dataset from Martins et al. (2009) represented here as a blue dotted line.
The chemicals isoprene (Aldrich 99 %, Sigma-Aldrich),
α-pinene (Aldrich, 98 %) and 1-3-carene (Aldrich, 99 %) were degassed by repeated freeze–pump–thaw cycles at 77 K and diluted in N2for storage and supply. H2O2(Roth, 35 % by weight) was concentrated by pumping away water and in-troduced to the experiment via a bubbler. N2and O2(Messer 99.999 %) were used without further purification.
3 Results and discussion
Detailed below are determinations of absorption cross sec-tions for the terpenoids isoprene,α-pinene and1-3-carene (σ, Sect. 3.1) and temperature-dependent rate coefficients for their reactions with OH: k1 in Sect. 3.2 and k2 and k3 in Sect. 3.3. A discussion of possible systematic uncertainties and a comparison of the results from this work with the ex-isting literature is presented in Sect. 3.4. All other uncertain-ties quoted throughout are precision only, representing two standard errors.
3.1 Absorption cross sections (σ )for isoprene, α-pinene and1-3-carene
Table 1.UV absorption cross sections for isoprene from this work.
λ(nm)a σb λ(nm) σb λ(nm) σb λ(nm) σb
184.95∗ 1.28 204 4.72 215 7.73 226 2.75 194 1.66 205 5.13 216 7.88 227 1.92 195 1.85 206 5.50 217 7.44 228 1.31 196 2.07 207 5.83 218 6.62 229 0.90 197 2.33 208 6.38 219 5.86 230 0.62 198 2.62 209 6.84 220 5.46 231 0.44 199 3.04 210 6.93 221 5.43 232 0.32 200 3.29 211 6.81 222 5.59 233 0.24 201 3.58 212 6.69 223 5.50 234 0.19 202 3.99 213 6.80 224 4.84
203 4.36 214 7.23 225 3.78
aData obtained at a resolution of1λ≈0.4nm, averaged and reported at 1 nm intervals except for∗σat 184.95 nm from high-resolution experiment (see Sect. 3.1 and Fig. 2).bσin units of 10−17cm2molecule−1.
0.0 0.2 0.4 0.6 0.8 1.0
[C5H8] /1017molecule cm-3 0
0.2 0.4 0.6 0.8
OD
/cm
-1
30.4 cm cell 1 cm cell fit to all
0 2 4
[C5H8] /1015molecule cm-3 0.00
0.05
OD
[cm
-1]
30.4 cm cell
Figure 2. Beer–Lambert plot used to derive the cross section of isoprene at 184.95 nm. An unweighted proportional fit to all the data yieldsσisoprene=(1.28±0.02)×10−17cm2molecule−1, rep-resented by the solid black line on both the main plot and insert. This value (also displayed as the red star in Fig. 1) was subsequently used to calculate isoprene concentrations for kinetic experiments.
half maximum of the λ=253.65 nm Hg line) in the range of 194–226 nm and are reported in Table 1 at 1 nm inter-vals. As is evident from Fig. 1, there is excellent agreement (≤1 % difference) between the results from this work and the more extensive and higher-resolution (δλ≈0.075 nm) dataset from Martins et al. (2009) depicted by the blue dot-ted line. Campuzano-Jost et al. (2004) repordot-ted cross sections (black dashed line in Fig. 1) in the range of 203–233 nm that are on average about 10 % smaller. The reasons for this dis-crepancy are unclear, though it seems unlikely to have re-sulted from problems with sample purity, which was>99 % in all three studies when supplied. Differences in spectral resolution were also not a likely source of error, since the
0 0.5 1 1.5
[C10H16] 10/ 16molecule cm-3 0
0.1 0.2
OD
/
cm
-1
-3-carenedata:
Undiluted Frombulb
Fitto all -pinene data:
[image:5.612.53.279.86.207.2] [image:5.612.51.285.248.463.2]Undiluted Frombulb Fitto all
Figure 3.Beer–Lambert plots used to derive 184.95 nm absorption cross sections:σα-pinene (blue square data points) andσ1-3-carene (red circles). Over a wide range of concentrations, good agree-ment was observed for data from both undiluted samples and from pre-prepared dilute bulbs (Sect. 2). Unweighted proportional fits with (Eq. 1) yield (in units of 10−17cm2molecule−1)σα-pinene=
(1.54±0.05)andσ1-3-carene=(2.40±0.03).
highest-resolution study from Campuzano-Jost et al. (2004) (δλ≈0.05 nm) reports the smallest differential cross sec-tions.
Also displayed in Fig. 1, the red star depicts results from this work atλ=184.95 nm that used a low-pressure Hg lamp as light source. Figure 2 displays the corresponding plot of ln(I0/I )/ lvs. [isoprene], which was used to obtainσisoprene via Eq. (1). Note the good agreement between data obtained across a wide range of concentrations and over different op-tical path lengths. A proportional fit to all the data yields a value ofσisoprene=(1.28±0.02)×10−17cm2molecule−1 atλ=184.95 nm, the wavelength used to derive [isoprene] in subsequent experiments (Sect. 3.2). Evident from Fig. 1 is the good agreement between this discrete value (the red star) and the literature spectrum from Martins et al. (2009), who reportedσisoprene=1.29×10⁻¹⁷cm2molecule−1. Tak-ing into account potential systematic errors from e.g. mano-metric measurements and sample purity we estimate an overall uncertainty of≈5 %, i.e.σisoprene=(1.28±0.06)× 10−17cm2molecule−1.
Figure 3 displays similar plots of ln(I0/I )/ lvs. [monoter-pene] used to obtain (via Eq. 1) 184.95 nm absorption cross sections forα-pinene and1-3-carene. A proportional fit to theα-pinene data (blue squares) yields a gradientσα-pinene=
those supplied dilute from a glass bulb (see Sect. 2). Tak-ing into account potential systematic errors we estimate an overall uncertainty of≈5 %, i.e.σα-pinene=(1.54±0.08)× 10−17cm2molecule−1 at 184.95 nm. This value is signif-icantly larger than that listed in the UV spectrum (116– 250 nm) of Kubala et al. (2009), who report a value of 1.28×
10−17cm2molecule−1. The reasons for this≈15 % discrep-ancy are unclear. The Kubala spectrum does display some structure in the region of 175–190 nm, though these features are orders of magnitude coarser than the reported experi-mental resolution (δλ=0.075 nm) or the narrow-bandwidth (δλ<0.001 nm) Hg-line light source used in this work. In the present study, cross sections at λ=184.95 nm were re-quired to convert online optical measurements into absolute [α-pinene] for rate-coefficient determinations (see Sect. 3.2). As the light source used forα-pinene monitoring was also a narrow-bandwidth Hg lamp, it is appropriate to use the
σα-pinenevalue determined in this work.
Similar procedures were followed and a similar quality of data obtained (red circles in Fig. 3) in the determina-tion ofσ1-3-carene=(2.40±0.03)×10−17cm2molecule−1. There appear to be no previously published values for this parameter. It is significantly larger than σα-pinene and similar to values reported for other terpenes, e.g. σ (in 10−17cm2molecule−1)=2.3 for β-pinene (Kubala et al., 2009) and 4.6 for limonene (Smialek et al., 2012). As-sessment of potential systematic errors results in an over-all uncertainty of ≈ 5 %, i.e. σ1-3-carene=(2.40±0.12)× 10−17cm2molecule−1atλ=184.95 nm.
3.2 Absolute determinations ofk1(OH + isoprene)
PLP–LIF studies were carried under pseudo-first-order con-ditions of [isoprene]≫[OH], such that the OH time profiles,
S(t ), were described by a simple exponential decay:
S(t )=S0exp{−Bt} (2)
[image:6.612.310.546.62.276.2]The parameterS0describes (in arbitrary units) the LIF sig-nal att=0 and is proportional to the initial [OH] produced by the laser pulse (R4). The parameter B is the pseudo-first-order rate coefficient for OH decay (and includes com-ponents from both reactive and transport losses). Figure 4 displays typical OH decay profiles recorded in the pres-ence of three different excess [isoprene], whilst other con-ditions of P =100 mbar (N2), T =298 K and [H2O2] ≈ 1×10¹⁴molecule cm−3 were unchanged. The OH decays were exponential over at least 2 orders of magnitude and were fit with Eq. (2) to yield values of B with a high de-gree of precision (two standard errors were generally less than±2 %). Systematic errors from unwanted radical chem-istry were unlikely, since isoprene absorbs only weakly at the photolysis wavelength (σ=1.18×10⁻¹⁹cm2molecule−1at 248 nm from Martins et al. 2009), whilst the use of low [OH] ensured that losses of OH by reaction with itself or with prod-ucts from (R1) or (R5) could be disregarded in this analysis.
Figure 4.Time-resolved OH LIF signals,S, recorded in the pres-ence of different [isoprene] used to determine k1 (298 K). Pho-tolysis Reaction (R5) of [H2O2]=2.3×10¹⁴molecule cm−3was used to generate [OH]≈5×10¹¹molecule cm−3inP=103 Torr
(N2). Unweighted fits with Eq. (2) yield first-order rate coefficients
B for [isoprene]=0 (black diamonds) B=(513±12)s−1 and [isoprene]=57×1012molecule cm−3 (red squares)B=(6654± 44)s−1; [isoprene]=574×1012molecule cm−3(blue circles)B=
(53 473±700)s−1.
Nonetheless, test experiments were conducted using an in-variant [isoprene] = 3.2×10¹⁴molecule cm−3whilst photol-ysis laser fluence, and thus radical concentrations, was var-ied by a factor of 15. No systematic influence was discerned (<1 % variation inBparameters) from such test experiments conducted both in N2 and in air, reinforcing confidence in these results.
Figure 5 displays plots ofBvs. [isoprene] at three temper-atures, which were fit (Eq. 3) to obtain the bimolecular rate coefficientsk1(T ).
B=k1[isoprene] +kloss (3)
wherek1is the bimolecular rate coefficient of interest. The termkloss(s−1)accounts for other losses of OH, here domi-nated by (R5) with the photolysis precursor H2O2, with some small contribution from diffusion and flow out of the reaction zone.
0 0.5 1 1.5 2 2.5 [C5H8] /10
14
molecule cm-3 0
10 20 30
B
/1
0
3s
-1
T=297 K
T=241 K
T=356 K
Figure 5.Plots ofB parameters vs. associated [isoprene] used to determinek1at three different temperatures. Weighted linear fits (Eq. 3) to the data yield (in units of 10−11cm3molecule−1s−1): k1 (241 K)=(12.9±0.2) from the blue square data points; k1 (297 K)=(9.43±0.14) from the black circles andk1 (356 K)=
(6.92±0.13)from the red triangles. Note that error bars on
indi-vidual data points are too small to be seen here (typically a few hundred on decay rates of several thousand per second).
all such determinations ofk1are listed in Table 2. Note that the optical derivation of [isoprene] at 184.95 nm means that ratios ofk1/σisoprene were actually determined and that any subsequent improvements in the database for isoprene cross sections may be used to update the kinetic results from this work. Taking into account potential systematic errors, prin-cipally fromσisoprene, and a small (2 to 4 %) uncertainty in carrying out the optical measurements, we estimate a re-alistic overall error of ±5 % or k1 (297 K)=(9.3±0.4)× 10−11cm3molecule−1s−1.
The data displayed in Fig. 5 further reveal the “nega-tive” or non-Arrhenius temperature dependence fork1, with the largest slopes obtained in experiments conducted at the lowest temperatures (241 K). This trend for k1(T ) is well-established in the literature; results from these previous stud-ies, together thek1values from this work (listed in Table 2), are depicted in Fig. 6.
3.2.1 Comparison ofk1with literature values
The kinetic database for (R1) displays some inconsistencies, with results for k1 (298 K) from a recent absolute determi-nation by Campuzano-Jost et al. (2004) some 15 % smaller than other values reported, mostly from relative-rate stud-ies (Atkinson et al., 2006b). The ambient temperature results from this work lie in between these two extremes. Absolute determinations ofk1were generally conducted at lower
pres-Table 2.Summary of rate coefficientsk1,k2andk3determined in this work.
T /K P /Torra [terpene]b nc k/10−11 d
OH+isoprene→(products) (R1)
241 6.0 22–222 5 12.9±0.2
241 6.1∗ 22–222 5 13.2±0.3
268 6.7 21–187 6 11.3±0.14
298 3.8 39–287 5 9.20±0.06
297 7.5 27–200 6 9.43±0.14
298 42.9 72–438 8 9.19±0.05
298 71.0 29–223 7 9.12±0.10
298 103 57–574 7 9.20±0.05
298 103∗ 112–574 5 9.22±0.09
296 165 19–168 7 9.1±0.4
296 165∗ 19–168 7 9.2±0.4
330 8.1 15–236 6 7.91±0.12
356 9.0 25–216 6 6.92±0.13
OH+α-pinene→(products) (R2)
238 6.0 7–90 7 7.33±0.04
241 211 47–357 6 7.5±0.2
246 96∗ 13–554 4 7.23±0.10
246 97 131–554 4 6.94±0.05
256 6.5 18–84 6 6.76±0.07
274 7.0 8–30 5 6.12±0.14
296 7.5 5–65 7 5.50±0.08
296 96 43–464 5 5.38±0.06
296 97∗ 43–464 5 5.25±0.09
296 197 38–420 6 5.39±0.04
323 7.2 19–157 7 5.44±0.08
357 6.9 24–240 7 4.82±0.05
OH+1-3-carene→(products) (R3)
235 7.5 4–43 6 11.9±0.3
241 211 13–99 6 11.4±0.3
271 96 44–530 5 9.11±0.13
296 95 42–377 8 8.01±0.13
296 95∗ 42–377 8 8.08±0.13
298 7.4 8–63 7 8.10±0.10
298 48 9–90 8 8.27±0.08
298 205 34–262 9 8.1±0.2
323 7.1 8–66 6 7.9±0.2
357 6.9 10–99 7 6.92±0.12
aBath-gas identity M is N
2unless marked∗, where M is air.bUnits
of [terpene] are 1012molecules cm−3, with values derived from
optical measurements using 185 nmσvalues determined in this work.
cn= number of different [terpene] used in determination ofk.dUnits
ofkare 10−11cm3molecule−1s1; uncertainties quoted are statistical only (two standard errors) derived from weighted linear fits (see Figs. 5 and 8).
[image:7.612.51.286.64.275.2]This work IUPAC
Campuzano-Jostet al.(corrected) Campuzano-Jostet al.(2004) 12
13
k1
/
1
0
cm
m
olecule
s
-1
1
3
-1
-1
T /K
1000T-1/ K-1
Hites and Turner (2009)
Spangenberget al.(2004)
Gill and Hites (2002) Kleindienstet al.(1982)
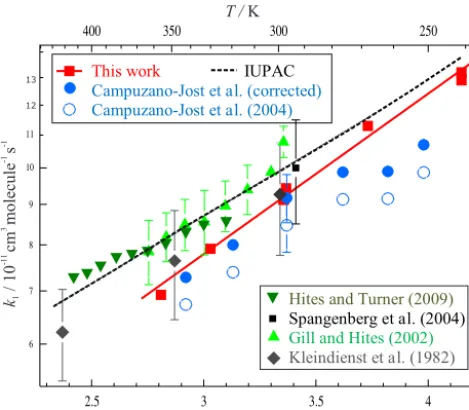
Figure 6. Values of k1(T ) from this work and the literature. A fit of Eq. (4) to our data (red squares) yields k1 (241–356 K)=
(1.93±0.08)×10−11exp{(466±12)/T}cm3molecule−1s−1,
in-dependent of bath-gas pressure and identity (N2 or air). Also displayed are the data from Campuzano-Jost et al. (2004) pre-sented as published (open blue circles) and subsequently cor-rected using isoprene absorption cross sections from Martins et al. (2009) (solid blue circles; see Sect. 3.2.1 for details). Note that error bars were included for all datasets but were commonly smaller than the data markers. The dashed black line represents
the current IUPAC recommendation of k1 (240–430 K)=2.7×
10−11exp(390/T )cm3molecule−1s−1. Not displayed for reasons of clarity are the T <220 K data points from Spangenberg et al. (2004), results from low-pressure studies of Park et al. (2004) or the many literature results at aroundT=298 K only (see IUPAC).
results from Campuzano-Jost et al. (2004) (50 to 600 Torr, N2 or air). Results from two studies of k1 (298 K) con-ducted at lower pressures indicate that the high-pressure limit was close to 3 Torr (He) (Singh and Li, 2007) and 1 Torr (He) (Chuong and Stevens, 2000). In contrast, McGivern et al. (2000) and Park et al. (2004) observed fall-off behaviour fork1(298 K) over the pressure range 0.5<P(Ar) / Torr<20, in line with their CVTST/RRKM calculations. Whilst no low-pressure studies of k1(P ) using N2 or air bath gas are available, the consensus would appear to be that the k1 (298 K) values reported in this work at up to P =165 Torr (N2)and by (Campuzano-Jost et al., 2004) are close to the high-pressure limit, representative ofk1(760 Torr) and thus directly comparable to the relative-rate results in the litera-ture.
The experimental methods used in this work were similar to those employed by Campuzano-Jost et al. (2004), who obtained k1 (297 K)=(8.47±0.59)× 10−11cm3molecule−1s−1, lower than most other de-terminations and at the lower limit of the range quoted in
the IUPAC (Task Group on Atmospheric Chemical Kinetic Data Evaluation) recommendation. Campuzano-Jost et al. (2004) used a cross section of 8.29×10⁻¹⁸cm2molecule−1 at 228.8 nm when determining [isoprene] from optical measurements. The extensive high-resolution dataset from Martins et al. (2009) provides cross sections at both 228.8 and at 184.95 nm (used in this work). If cross sections from Martins et al. (2009) are used to derive [isoprene] for the Campuzano-Jost et al. (2004) results, a value of
k1 (297 K)=(9.2±0.7)×10−11cm3molecule−1s−1 is obtained (see also the filled blue circle data points in Fig. 6), consistent with results from this work. A similar re-evaluation using cross sections from Martins et al. (2009) does not change the rate coefficients from our study.
Evaluation of all ambient temperature literature to date led IUPAC to recommend a room temperature rate coefficient of
k1(298 K)=1.0×10⁻¹⁰cm3molecule−1s−1, slightly larger than the upper limit to our determination, though the two values overlap given that IUPAC quotes an uncertainty of 1log(k1)=0.06 (i.e. in 10−11cm3molecule−1s−1): 8.71<k1 (298 K) <10.15. The results obtained in this work, together with the re-calculation of the results from Campuzano-Jost et al. (2004), could indicate that this eval-uation is quoted with an overly conservative uncertainty.
The results from previous studies ofk1(T )together with the IUPAC recommendation and the data from this work (red squares) are presented in Arrhenius format in Fig. 6. All temperature-dependent investigations characterized k1(T ) with a non-Arrhenius temperature dependence, in qualita-tive agreement with results from this work. However, there are surprisingly few published studies of (R1) over a range of temperatures characteristic of the troposphere, with only Campuzano-Jost et al. (2004) and Park et al. (2004) report-ing values ofk1(T <298 K). As is evident from Fig. 6, the spread ofk1(T <298 K) is large, around±30 % from the un-corrected values from Campuzano-Jost et al. (2004) to the results from Park et al. (2004) at T =279 K. IUPAC have completed an extensive evaluation of this literature, together withk1(249–438 K) results from Siese et al. (1994) and many published values atT ≈298 K (not displayed in Fig. 6 for reasons of clarity). The Arrhenius Eq. (4) was used to pa-rameterizek1:
k1(T )=Aexp
E
RT
(4)
with recommended parameters of k1 (240–430 K)=2.7× 10⁻¹¹exp{390/T}cm3molecule−1s−1, with associated un-certainties of 1logk1 of ±0.06 at 298 K and 1ER of
[image:8.612.51.286.68.273.2][C H ] / 10 molecule cm10 16 13 -3 3.9
35.69.2
0 500 1000
t/섉s
10-4 10-3 10-2
OH
LIF
signa
l/
[image:9.612.50.286.64.269.2]arb.
Figure 7. Plot of typical LIF profiles recorded for three
α-pinene concentrations, used to determine k2 (296 K). For
all experiments photolysis (R4) at t=0 generated [OH]
≈5×10¹¹molecule cm−3 in P=97 Torr (air). Unweighted
fits with (Eq. 2) yield B parameters for [α-pinene]=3.9×
1013molecule cm−3 (black squares), B=(1921±90)s−1; [α-pinene]=9.2×10¹³molecule cm−3 (red triangles),B=(4819± 213)s−1 and [α-pinene]=35.6×10¹³molecule cm−3 (blue cir-cles),B= (17 944±615) s−1.
and the IUPAC recommendation would indicate that the recommended uncertainties could be reduced in any sub-sequent re-evaluation by IUPAC. Results from Spangen-berg et al. (2004), with k1 (58–300 K) reaching a max-imum value of ∼3×10⁻¹⁰cm3molecule−1s−1 at around
T =120 K, demonstrate that large errors could result if the Arrhenius expressions presented here and by IUPAC were extrapolated beyond the temperature range stated.
3.3 Absolute determinations ofk2andk3
Figure 7 displays OH LIF profiles recorded in the pres-ence of three different excessα-pinene concentrations, with conditions of P =97 Torr (air), T =296 K and [H2O2] ≈ 1×10¹⁴molecule cm−3otherwise unchanged. The OH de-cays were exponential over approximately 2 orders of mag-nitude and were therefore fit with Eq. (2) to yield B pa-rameters with a high degree of precision (±5 % or less). As with the determinations of k1 detailed above, system-atic errors due to secondary chemistry were considered unlikely, since monoterpenes absorb only weakly at the photolysis wavelength (the 248 nm cross section is <1×
10−20cm2molecule−1 (Kubala et al., 2009), resulting in photolysis of <1×10¹¹molecule cm−3)of α-pinene. Fur-thermore, use of small OH concentrations and hence low conversion ofα-pinene ensured that perturbations to the LIF profiles by reaction of OH with itself or with the products of
[C10H16] /10 14
molecule cm-3
B
/1
0
4s
-1
k3data
k2data
0 1 2 3 4
[image:9.612.310.546.65.276.2]0 1 2 3
Figure 8.Plots ofB parameters derived from Eq. (2) vs. associ-ated [α-pinene] used to determinek2(OH+α-pinene) andk3(OH +1-3-carene) in conditions ofT =296 K andP=97 Torr (air). Weighted linear fits yield (in units of 10−11cm3molecule−1s−1): k2(296 K)=(5.3±0.15)from the red squares and k3(296 K)= (8.1±0.1)(blue circles). Note that 2σ statistical errors inB, used to weight these fits, were smaller than the symbols in this plot.
(R2) or (R5) could be disregarded in this analysis. All data for (R2) and (R3) recorded in this work were of similar or superior quality to that presented in Fig. 7, where the pres-ence of the efficient fluorescpres-ence quencher O2and relatively large bath-gas pressures had a negative impact on LIF signal quality.
The red squares in Fig. 8 represent results from a series of experiments conducted atP =97 Torr (air) andT =296 K. Values ofBwere plotted against [α-pinene] calculated from its optical extinction at 184.95 nm (see Sect. 2). A weighted linear fit (using statistical errors inB)yields a gradient ofk2 (296 K)=(5.3±0.2)×10−11cm3molecule−1s−1. The ex-perimental conditions used and results obtained for all deter-minations ofk2are listed in Table 1. A mean of the four val-ues obtained at around room temperature yieldsk2(296 K)=
(5.4±0.2)×10−11cm3molecule−1s−1. Within experimen-tal uncertainty, these rate coefficients were independent of the bath-gas pressure (7<P/Torr<197) or identity (N2 or air). This result is in reasonable agreement with a number of experimental and theoretical determinations ofk1at around ambient temperature, summarized in Table 3.
rad-Table 3.Comparison with literature determinations ofk2andk3at around 298 K.
ka T /K Reference Techniques usedb
Absolute determinations ofk2(OH+α-pinene)
5.4±0.2c 296 This work PLP–LIF
6.09±0.3 300 Davis and Stevens (2005) DF–LIF
6.08±0.4 300 Chuong et al. (2002) DF–LIF
6.01±0.82 298 Kleindienst et al. (1982) FP-RF
Relative-rate determinations ofk2
5.33±0.79 298 Dash et al. (2014) GC vs. propene
5.38±0.3 298 Renbaurn-Wolff and Smith (2012) MS vs. isoprene
5.55±0.97 298 Montenegro et al. (2012) DF–MS vs. isoprene
5.0±1.1 298 Gill and Hites (2002) MS vs. 1-butene, 2-methylpropene
and trans-2-butene
5.35±0.31 294±1 Atkinson et al. (1986) GC vs. 2,3-dimethyl-2-butene
5.8±1.7d 305 Winer et al. (1976) GC vs. 2-methylpropene
Rate theory fork2
4.65 298 Dash et al. (2014) CVTST
5.1 298 Vereecken et al. (2007) Estimate using SAR
5.1 300 Fan et al. (2005) CVTST
12 298 Grosjean and Williams (1992) Estimate using SAR
Absolute determinations ofk3(OH+1-3-carene)
8.1±0.3c 297±1 This work PLP–LIF
Relative-rate determinations ofk3
8.7±0.4 294±1 Atkinson et al. (1986) GC vs. 2,3-dimethyl-2-butene
Rate theory fork3
0.506 298 Baptista et al. (2014) QM calculations
8.51 298 Peeters et al. (2007) Estimate using SAR
9.1 298 Grosjean and Williams (1992) Estimate using SAR
aUnits ofk
1are 10−11cm3molecule−1s1.bKey to abbreviations: PLP is pulsed laser photolysis, LIF is laser-induced
fluorescence, FP is conventional flash photolysis, RF is resonance fluorescence, DF is discharge flow, GC is gas chromatography, MS is mass spectrometry, CVTST is canonical variational transition state theory, and SAR is structure activity relationship.
cCalculated usingσvalues from this work. Realistic uncertainty estimate is±8% fork
1andk2(includes systematic errors inσ
and kinetic procedure; see Sect. 3.3).dRecalculated using latestk(298 K)=5.1×10⁻¹¹cm3molecule−1s−1from IUPAC (Ammann et al., 2016; Atkinson et al., 2006a) for reference reaction OH+isobutene.
ical additions to alkenes. Results from these previous studies, together with thek2values from this work (themselves listed in Table 2), are summarized in Table 3 and depicted in Fig. 9. A similar methodology was followed to determinek3(T ) for the reaction of OH +1-3-carene. LIF profiles (not shown) were of a similar quality to those depicted in Fig. 7 and were fit Eq. (2) to obtainB parameters. Optical signals were converted Eq. (1) to absolute [1-3-carene] using values ofl=43.8 cm andσ1-3-carene=2.4×10⁻¹⁷cm2molecule−1 as determined in this work (Sect. 3.1). Figure 8 displays (blue circles) a plot of B vs. [1-3-carene] for a series of experiments conducted atT =296 K andP =96 Torr (air). The rate coefficient for (R3) is clearly larger than that deter-mined for (R2) above; a weighted linear fit yields a gradient
k3(296 K)=(8.1±0.1)×10−11cm3molecule−1s−1.
Exper-iments were repeated using different bath-gas pressures and in N2 (see Table 2). No trends in k3 were observed and a mean of these five results yieldsk3(297±1) = (8.1±0.2)× 10−11cm3molecule−1s−1. Results from all experiments, de-picted as black circles in Fig. 9, demonstrate for the first time the non-Arrhenius temperature dependence fork3(T ).
3.3.1 Comparison ofk2andk3with literature values
[image:10.612.109.485.85.461.2]This work
k3(OH+ -3-carene):
This work
Kleindienstet al.(1982)
Chounget al. (2002)
Gill & Hites (2002)
IUPAC evaluation k2(OH+ -pinene):
Montenegroet al. (2012)
T/ K
k
/10
cm
mol
ecul
e
s
-11
3
-1
-1
1000T-1/ K-1
Figure 9. k2(T )andk3(T )from this work in Arrhenius format, together with previous experimental results and ak2(T )literature evaluation. Data from this work were fit with (Eq. 4) to yieldk2 (238–357 K)=(1.83±0.04)×exp{(330±6)/T} (represented by the black dot-dashed line) and k3 (235–357 K)=(2.48±0.14)× exp{(357±17)/T}(the black dashed line). Not displayed for rea-sons of clarity are literature datasets containing only ambient tem-peraturek2results (these are listed in full in Table 3) and the 44 de-terminations ofk2(297–364 K) from Gill and Hites (2002), which are instead represented (purple dotted line) by a fit with (Eq. 4).
1976). The principal source of error in relative-rate deter-minations often derives from the choice of reference rate coefficient, required to convert an experimentally derived rate-coefficient ratio into an absolute rate coefficient. Con-fidence may be derived from the fact that five different reference reactions were used across the four published relative-rate (R2) studies. Absolute rate-coefficient deter-minations do not depend upon literature rates but do re-quire an accurate knowledge of concentrations of the excess reagent (α-pinene or1-3-carene). The present dataset used in situ optical absorption spectroscopy to accurately mea-sure [α-pinene] and subsequently calculate an absolute k2 (296 K)=(5.4±0.2)×10−11cm3molecule−1s−1. Any er-ror in σα-pinene propagates directly intok2. Taking into ac-count potential systematic errors, principally the 5 % uncer-tainty inσα-pinene (Sect. 3.1), a similar uncertainty in carry-ing out the optical measurements and 2 % for sample purity, a total uncertainty of around 8 % was calculated, so we cal-culatek2(296 K) = (5.4±0.5)×10−11cm3molecule−1s−1. Within combined uncertainties there is reasonable agreement between this result and three previous absolute kinetic stud-ies of (R2) (Chuong et al., 2002; Davis and Stevens, 2005; Kleindienst et al., 1982), all of which relied on manomet-ric determinations of [α-pinene] to derive k2. The IUPAC data evaluation panel currently recommends a value of k2
(298 K)=5.3×10⁻¹¹cm3molecule−1s−1(Ammann et al., 2016; Atkinson et al., 2006b), based on results from Atkin-son et al. (1986), Gill and Hites (2002) and Kleindienst et al. (1982), with an associated 1logk2=0.15 or approxi-mately+40,−30 %. A re-evaluation taking into account the data from this work and from the recent (Montenegro et al., 2012) study yields (via a weighted mean)k2(298 K)=5.4× 10⁻¹¹cm3molecule−1s−1; a considerably smaller1log(k2) of 0.06 (around±15 %) would encompass all experimentally determined ambient temperaturek2values.
[image:11.612.50.287.64.267.2]IUPAC (Ammann et al., 2016; Atkinson et al., 2006b) uses the Arrhenius Eq. (4) to parameterize k2(T ). A weighted fit of Eq. (4) to the data from this work yields k2 (238–357 K)=(1.83±0.04)×10−11exp{(330± 6)/T}cm3molecule−1s−1, represented by the black dot-dashed line in Fig. 9. Where data overlap (290 to 357 K), thesek2(T )lie within the large uncertainty (1logk2=0.15 at 298 K; 1ER =200 K) reported by IUPAC for k2 (290– 430 K)=1.2×10⁻¹¹exp{440/T}cm3molecule−1s−1 (Am-mann et al., 2016; Atkinson et al., 2006b). Represented in Fig. 9 by the solid orange line, this recommendation was based on the results of Gill and Hites (2002) and Kleindienst et al. (1982) and is not in good agreement with the consid-erably smallerk2(T >350 K) from Chuong et al. (2002). The reasons for this discrepancy are unclear. Chuong suggested that for their experimental conditions ofP =5 Torr (He), ob-servedk(T >350 K) may not be high-pressure limited val-ues. However, no evidence for such a pressure dependence in
k2was observed in subsequent relative-rate determinations of k2(T=340 K, P =1−5 Torr He) from Montenegro et al. (2012). This discrepancy is not resolved by any results from the present study, as the apparatus did not permit ex-periments at sufficiently low pressures. The results presented in Table 2 and elsewhere would indicate that the values ofk2 obtained here atP >7 Torr andT ≈298 K were in the high-pressure limit.
The current IUPAC recommendation (Ammann et al., 2016; Atkinson et al., 2006b) does not extend to important atmospheric temperatures lower than 290 K, as no data were available when the evaluation was made. However, there are now two complementary datasets available. The abso-lute values from this work (see Table 2) and results from the most recent literature dataset (Montenegro et al., 2012) de-rived by relative-rate methods are in excellent agreement for
T <298 K conditions. It is clear from Fig. 9 that these two datasets could provide a basis for IUPAC to extend the rec-ommendation fork2toT <290 K.
the relative-rate method to obtaink3(294 K)=(8.7±0.4)× 10−11cm3molecule−1s−1. The good agreement between these two datasets, derived by very different experimental methods, is encouraging. It is clear from the data presented in Table 2 and displayed graphically in Fig. 9 that (R3) is char-acterized by negative or non-Arrhenius k3(T ). A weighted Eq. (4) fit yieldsk3(235–357 K)=(2.48±0.14)×exp{(357± 17)/T}, depicted in Fig. 9 as the dashed black line. These re-sults are the first reported for k3 that were not obtained at room temperature. The non-Arrhenius behaviour observed is common for OH+monoterpene reactions that proceed predominantly by addition of OH to the unsaturated C=C groups, with a smaller contribution (∼10 %) from direct ab-straction of allyl-stabilized hydrogens (Peeters et al., 2001; Vereecken et al., 2007). To a first approximation therefore, (R2) and (R3) should proceed at quite similar rates, as the main reactive site (a methyl substituted endocyclic C=C group) is common to α-pinene and 1-3-carene. The data listed in Table 2 show that (R2) and (R3) are characterized by rate coefficients broadly consistent with this picture, i.e. non-Arrhenius k(T ) values approaching the collision limit of 10−10cm3molecule−1s−1. Note that as discussed above, in the reaction conditions employed here, addition of OH to such large (C10) molecules need not be characterized by any discernable pressure dependence. It is somewhat surprising, however, that the results from this work and from Atkinson et al. (1986) clearly demonstrate that OH reacts some 50 % faster with1-3-carene than withα-pinene. This is unlikely to be due to any enhancement in abstraction rates as1-3-carene has fewer allyl hydrogens available than doesα-pinene. The observed change in reactivity is presumably due to influence on the C=C reactive site by the different location of the (CH3)2C substituent inα-pinene and1-3-carene. Note that systematic attempts to parameterize k2 via structure activ-ity relationships have also failed at this level of detail (see e.g. the predictedk2andk3in Table 3 from Vereecken et al., 2007, and from Grosjean and Williams, 1992).
Finally, it should be reiterated that all k2 and k3 values reported in this work were determined via optically derived [monoterpene] and may more formally be considered as ra-tios such ask2(T )/σα-pineneandk3(T )/σ1-3-carene. Currently the database for 184.95 nm cross sections is sparse, consist-ing of only the results from this work and one other reported value forσα-pinenefrom Kubala et al. (2009). Any subsequent improvements in the database for 184.95 nm absorption cross sections for monoterpenes should be used to obtain up to date rate coefficientsk2(T )andk3(T ).
4 Atmospheric implications and conclusions
Breakdown of isoprene, initiated by reaction with the hy-droxyl radical, is one of the most important oxidation reac-tions in the troposphere. The spectroscopic and kinetic re-sults obtained in this work indicate that significant
discrepan-cies between previous absolute and relative determinations of
k1were most likely the result of using erroneous absorption cross sections to derive [isoprene] in absolute studies. The value ofk1(297 K)=(9.3±0.4)×10−11cm3molecule−1s−1 reported here is in satisfactory agreement with many previ-ous determinations using different methods and confirms an atmospheric lifetime for isoprene of a few hours in typical rainforest conditions.
Absolute rate coefficients were determined for the gas-phase reactions of OH with two monoterpenes of atmo-spheric interest: α-pinene (R2) and 1-3-carene (R3). At around ambient temperature, k2 andk3 were large and in-dependent of bath-gas pressure (7–200 Torr) or composition (N2or air), indicating that these predominantly addition re-actions are approaching their high-pressure limiting rate. The low-temperature rate coefficients derived in this work may be used to calculate atmospheric lifetimes for monoterpenes in realistic boreal forest conditions. Montenegro et al. (2012) usedT =277 K and [OH]=8.1×10⁵molecule cm−3to cal-culateτ2= {k2(T )×[OH]}−1=5.8 h. The values ofT and [OH] used would appear appropriate for daytime boreal for-est conditions during a springtime emission event (Back et al., 2005). When using the absolute value ofk2(277 K) from this work, the calculated value of τ2=5.8 h is unchanged, a result that significantly enhances confidence in this pa-rameter. We note that similar calculations (using mixing ra-tios of 30 ppb for O3and kinetic data from IUPAC) demon-strate thatα-pinene is oxidized by O3at a very similar rate. The publication in this work of the first k3(T ) allows the calculation of realistic atmospheric lifetimes for1-3-carene with respect to (R3). Using [OH]=8.1×10⁵molecule cm−3 andk3(277 K)=9.0×10⁻¹¹cm3molecule−1s−1from this work,τ3=3.8 h was calculated. The corresponding calcula-tion (again using 30 ppb of O3and kinetic data from IUPAC) results in a loss rate some 2.5 slower for1-3-carene with O3. These results demonstrate that the dominant daytime loss process for1-3-carene is reaction with OH (R3).
Data availability. The kinetic data are available in tables in the pa-per; requests to the authors for raw data would be considered on a case-by-case basis depending on proposed usage.
Author contributions. JNC and TJD designed all experiments and planned the overall project; KD conducted the spectroscopic exper-iments; TJD and CBMG conducted the kinetic experexper-iments; TJD prepared the manuscript with contributions from all authors.
Acknowledgements. The authors thank Gerhard Schuster for ever-excellent technical support, Jonathan Williams and Luc Vereecken for helpful discussions regarding the monoterpene reactions and the Max Planck Society for support via a research fellowship.
Edited by: Thorsten Bartels-Rausch
Reviewed by: Anthony Hynes and one anonymous referee
References
Atkinson, R., Aschmann, S. M., and Pitts, J. N.: Rate constants for the gas-phase reactions of the OH-radical with a series of monoterpenes at 298+/− 1 K, Int. J. Chem. Kinet., 18, 287– 299, https://doi.org/10.1002/kin.550180303, 1986.
Atkinson, R. and Arey, J.: Gas-phase tropospheric chemistry of bio-genic volatile organic compounds: a review, Atmos. Environ., 37, S197–S219, https://doi.org/10.1016/s1352-2310(03)00391-1, 2003.
Atkinson, R., Baulch, D. L., Cox, R. A., Crowley, J. N., Hamp-son, R. F., Hynes, R. G., Jenkin, M. E., Rossi, M. J., Troe, J., and IUPAC Subcommittee: Evaluated kinetic and photochemi-cal data for atmospheric chemistry: Volume II – gas phase re-actions of organic species, Atmos. Chem. Phys., 6, 3625–4055, https://doi.org/10.5194/acp-6-3625-2006, 2006a.
Atkinson, R., Baulch, D. L., Cox, R. A., Crowley, J. N., Hamp-son, R. F., Hynes, R. G., Jenkin, M. E., Rossi, M. J., Troe, J., and IUPAC Subcommittee: Evaluated kinetic and photochemi-cal data for atmospheric chemistry: Volume II – gas phase re-actions of organic species, Atmos. Chem. Phys., 6, 3625–4055, https://doi.org/10.5194/acp-6-3625-2006, 2006b.
Back, J., Hari, P., Hakola, H., Juurola, E., and Kulmala, M.: Dy-namics of monoterpene emissions in Pinus sylvestris during early spring, Boreal Environ. Res., 10, 409–424, 2005.
Baptista, L., Francisco, L. F., Dias, J. F., da Silva, E. C., dos Santos, C. V. F., de Mendonca, F. S. G., and Arbilla, G.: Theoretical study of Delta-3-(+)-carene oxidation, Phys. Chem. Chem. Phys., 16, 19376–19385, https://doi.org/10.1039/c4cp02627f, 2014. Butler, T. M., Taraborrelli, D., Brühl, C., Fischer, H., Harder, H.,
Martinez, M., Williams, J., Lawrence, M. G., and Lelieveld, J.: Improved simulation of isoprene oxidation chemistry with the ECHAM5/MESSy chemistry-climate model: lessons from the GABRIEL airborne field campaign, Atmos. Chem. Phys., 8, 4529–4546, https://doi.org/10.5194/acp-8-4529-2008, 2008. Campuzano-Jost, P., Williams, M. B., D’Ottone, L., and Hynes,
A. J.: Kinetics and mechanism of the reaction of the hydroxyl radical with H(8)-isoprene and D(8)-isoprene: Isoprene absorp-tion cross secabsorp-tions, rate coefficients, and the mechanism of hy-droperoxyl radical production, J. Phys. Chem. A, 108, 1537– 1551, https://doi.org/10.1021/jp0363601, 2004.
Chuong, B. and Stevens, P. S.: Kinetic study of the OH plus isoprene and OH plus ethylene reactions between 2 and 6 torr and over the temperature range 300–423 K, J. Phys. Chem. A, 104, 5230– 5237, https://doi.org/10.1021/jp993613a, 2000.
Chuong, B., Davis, M., Edwards, M., and Stevens, P. S.: Measure-ments of the kinetics of the OH plus alpha-pinene and OH plus beta-pinene reactions at low pressure, Int. J. Chem. Kinet., 34, 300–308, https://doi.org/10.1002/kin.10058, 2002.
Dash, M. R., Balaganesh, M., and Rajakumar, B.: Rate coefficients for the gas-phase reaction of OH radical with alpha-pinene: an experimental and computational study, Mol. Phys., 112, 1495– 1511, https://doi.org/10.1080/00268976.2013.840395, 2014. Davis, M. E. and Stevens, P. S.: Measurements of the
kinet-ics of the OH-initiated oxidation of alpha-pinene:
Radi-cal propagation in the OH plus alpha-pinene+O2+NO
reaction system, Atmos. Environ., 39, 1765–1774,
https://doi.org/10.1016/j.atmosenv.2004.09.068, 2005.
Dillon, T. J., Tucceri, M. E., Dulitz, K., Horowitz, A., Vereecken, L., and Crowley, J. N.: Reaction of Hydroxyl Radicals
with C4H5N (Pyrrole): Temperature and Pressure
Depen-dent Rate Coefficients, J. Phys. Chem. A, 116, 6051–6058, https://doi.org/10.1021/jp211241x, 2012.
Fan, J. W., Zhao, J., and Zhang, R. Y.: Theoretical study of OH ad-dition to alpha-pinene and beta-pinene, Chem. Phys. Lett., 411, 1–7, https://doi.org/10.1016/j.cplett.2005.05.122, 2005. Gill, K. J. and Hites, R. A.: Rate constants for the gas-phase
re-actions of the hydroxyl radical with isoprene, alpha- and beta-pinene, and limonene as a function of temperature, J. Phys. Chem. A, 106, 2538–2544, https://doi.org/10.1021/jp013532q, 2002.
Goldstein, A. H. and Galbally, I. E.: Known and unexplored organic constituents in the earth’s atmosphere, Environ. Sci. Technol., 41, 1514–1521, https://doi.org/10.1021/es072476p, 2007.
Grosjean, D. and Williams, E. L.: Environmental persistence of organic-compounds estimated from structure reactivity and lin-ear free-energy relationships unsaturated aliphatics, Atmos. En-viron. A-Gen., 26, 1395–1405, https://doi.org/10.1016/0960-1686(92)90124-4, 1992.
Guenther, A., Hewitt, C. N., Erickson, D., Fall, R., Geron, C., Graedel, T., Harley, P., Klinger, L., Lerdau, M., McKay, W. A., Pierce, T., Scholes, B., Steinbrecher, R., Tallamraju, R., Tay-lor, J., and Zimmerman, P.: A Global-Model of Natural Volatile Organic-Compound Emissions, J. Geophys. Res.-Atmos., 100, 8873–8892, 1995.
Haase, K. B., Jordan, C., Mentis, E., Cottrell, L., Mayne, H. R., Tal-bot, R., and Sive, B. C.: Changes in monoterpene mixing ratios during summer storms in rural New Hampshire (USA), Atmos. Chem. Phys., 11, 11465–11476, https://doi.org/10.5194/acp-11-11465-2011, 2011.
Hakola, H., Tarvainen, V., Laurila, T., Hiltunen, V., Hellen, H., and Keronen, P.: Seasonal variation of VOC concentrations above a boreal coniferous forest, Atmos. Environ., 37, 1623–1634, https://doi.org/10.1016/s1352-2310(03)00014-1, 2003.
Hakola, H., Hellén, H., Hemmilä, M., Rinne, J., and Kul-mala, M.: In situ measurements of volatile organic compounds in a boreal forest, Atmos. Chem. Phys., 12, 11665–11678, https://doi.org/10.5194/acp-12-11665-2012, 2012.
Heijari, J., Blande, J. D., and Holopainen, J. K.: Feeding of large pine weevil on Scots pine stem triggers
lo-calised bark and systemic shoot emission of volatile
organic compounds, Environ. Exp. Bot., 71, 390–398,
https://doi.org/10.1016/j.envexpbot.2011.02.008, 2011. Hellén, H., Hakola, H., Pystynen, K.-H., Rinne, J., and
Haa-panala, S.: C2-C10 hydrocarbon emissions from a
IUPAC: Task Group on Atmospheric Chemical Kinetic Data Evaluation: http://iupac.pole-ether.fr/index.html, last access: 14 June 2017, 2016.
Karunanandan, R., Holscher, D., Dillon, T., Horowitz, A., Crow-ley, J., Vereecken, L., and Peeters, J.: Reaction of HO
with glycolaldehyde, HOCH2CHO: Rate coefficients (240–
362 K) and mechanism, J. Phys. Chem. A, 111, 897–908, https://doi.org/10.1021/jp0649504, 2007.
Kleindienst, T. E., Harris, G. W., and Pitts, J. N.: Rates and tem-perature dependences of the reaction of OH with isoprene, its oxidation-products, and selected terpenes Environ. Sci. Technol., 16, 844–846, https://doi.org/10.1021/es00106a004, 1982. Kubala, D., Drage, E. A., Al-Faydhi, A. M. E., Kocisek, J.,
Papp, P., Matejcik, V., Mach, P., Urban, J., Limao-Vieira, P., Hoffmann, S. V., Matejcik, S., and Mason, N. J.: Elec-tron impact ionisation and UV absorption study of alpha-and beta-pinene, Int. J. Mass Spectrom., 280, 169–173, https://doi.org/10.1016/j.ijms.2008.07.035, 2009.
Kubistin, D., Harder, H., Martinez, M., Rudolf, M., Sander, R., Bozem, H., Eerdekens, G., Fischer, H., Gurk, C., Klüpfel, T., Königstedt, R., Parchatka, U., Schiller, C. L., Stickler, A., Taraborrelli, D., Williams, J., and Lelieveld, J.: Hydroxyl rad-icals in the tropical troposphere over the Suriname rainforest: comparison of measurements with the box model MECCA, At-mos. Chem. Phys., 10, 9705–9728, https://doi.org/10.5194/acp-10-9705-2010, 2010.
Lelieveld, J., Butler, T., Crowley, J., Dillon, T., Fischer, H., Ganzeveld, L., Harder, H., Lawrence, M., Martinez, M., Taraborrelli, D., and Williams, J.: Atmospheric oxidation ca-pacity sustained by a tropical forest, Nature, 452, 737–740, https://doi.org/10.1038/nature06870, 2008.
Martinez, M., Harder, H., Kubistin, D., Rudolf, M., Bozem, H., Eerdekens, G., Fischer, H., Klüpfel, T., Gurk, C., Königst-edt, R., Parchatka, U., Schiller, C. L., Stickler, A., Williams, J., and Lelieveld, J.: Hydroxyl radicals in the tropical tropo-sphere over the Suriname rainforest: airborne measurements, At-mos. Chem. Phys., 10, 3759–3773, https://doi.org/10.5194/acp-10-3759-2010, 2010.
Martins, G., Ferreira-Rodrigues, A. M., Rodrigues, F. N., de Souza, G. G. B., Mason, N. J., Eden, S., Duflot, D., Fla-ment, J. P., Hoffmann, S. V., Delwiche, J., Hubin-Franskin, M. J., and Limao-Vieira, P.: Valence shell electronic spec-troscopy of isoprene studied by theoretical calculations and by electron scattering, photoelectron, and absolute photoabsorption measurements, Phys. Chem. Chem. Phys., 11, 11219–11231, https://doi.org/10.1039/b916620c, 2009.
McGivern, W. S., Suh, I., Clinkenbeard, A. D., Zhang, R. Y., and North, S. W.: Experimental and computational study of the OH-isoprene reaction: Isomeric branching and low-pressure behavior, J. Phys. Chem. A, 104, 6609–6616, https://doi.org/10.1021/jp001163c, 2000.
Montenegro, A., Ishibashi, J. S. A., Lam, P., and Li, Z. J.: Kinetics Study of Reactions of alpha-Pinene and beta-Pinene with Hydroxyl Radical at 1–8 Torr and 240– 340 K Using the Relative Rate/Discharge Flow/Mass Spec-trometry Method, J. Phys. Chem. A, 116, 12096–12103, https://doi.org/10.1021/jp307718m, 2012.
Ng, N. L., Brown, S. S., Archibald, A. T., Atlas, E., Cohen, R. C., Crowley, J. N., Day, D. A., Donahue, N. M., Fry, J. L.,
Fuchs, H., Griffin, R. J., Guzman, M. I., Herrmann, H., Hodzic, A., Iinuma, Y., Jimenez, J. L., Kiendler-Scharr, A., Lee, B. H., Luecken, D. J., Mao, J., McLaren, R., Mutzel, A., Osthoff, H. D., Ouyang, B., Picquet-Varrault, B., Platt, U., Pye, H. O. T., Rudich, Y., Schwantes, R. H., Shiraiwa, M., Stutz, J., Thornton, J. A., Tilgner, A., Williams, B. J., and Zaveri, R. A.: Nitrate radi-cals and biogenic volatile organic compounds: oxidation, mecha-nisms, and organic aerosol, Atmos. Chem. Phys., 17, 2103–2162, https://doi.org/10.5194/acp-17-2103-2017, 2017.
Nölscher, A. C., Williams, J., Sinha, V., Custer, T., Song, W., John-son, A. M., Axinte, R., Bozem, H., Fischer, H., Pouvesle, N., Phillips, G., Crowley, J. N., Rantala, P., Rinne, J., Kulmala, M., Gonzales, D., Valverde-Canossa, J., Vogel, A., Hoffmann, T., Ouwersloot, H. G., Vilà-Guerau de Arellano, J., and Lelieveld, J.: Summertime total OH reactivity measurements from boreal forest during HUMPPA-COPEC 2010, Atmos. Chem. Phys., 12, 8257–8270, https://doi.org/10.5194/acp-12-8257-2012, 2012. Park, J., Jongsma, C. G., Zhang, R. Y., and North, S.
W.: OH/OD initiated oxidation of isoprene in the presence
of O2 and NO, J. Phys. Chem. A., 108, 10688–10697,
https://doi.org/10.1021/jp040421t, 2004.
Peeters, J., Vereecken, L., and Fantechi, G.: The detailed mecha-nism of the OH-initiated atmospheric oxidation of alpha-pinene: a theoretical study, Phys. Chem. Chem. Phys., 3, 5489–5504, https://doi.org/10.1039/b106555f, 2001.
Peeters, J., Boullart, W., Pultau, V., Vandenberk, S., and Vereecken, L.: Structure-activity relationship for the addition of OH to (poly)alkenes: Site-specific and total rate constants, J. Phys. Chem. A, 111, 1618–1631, https://doi.org/10.1021/jp066973o, 2007.
Renbaurn-Wolff, L. and Smith, G. D.: “Virtual Injector” Flow Tube Method for Measuring Relative Rates Kinetics of Gas-Phase and Aerosol Species, J. Phys. Chem. A, 116, 6664–6674, https://doi.org/10.1021/jp303221w, 2012.
Siese, M., Koch, R., Fittschen, C., and Zetzsch, C.: Cycling of OH in the Reaction Systems Toluene/O2/NO and Acetylene/O2and the Addition of OH to Isoprene, in: Proceedings of the EURO-TRAC Symposium ’94, edited by: Borrell, P. M., Borrell, P., Cvi-taš, T., and Seiler, W., SPB Aacademic Publishing, Den Haag, The Netherlands, 115–119, 1994.
Singh, S. and Li, Z. J.: Kinetics investigation of OH reaction with isoprene at 240−340 K and 1−3 Torr using the relative rate/discharge flow/mass spectrometry technique, J. Phys. Chem. A, 111, 11843–11851, https://doi.org/10.1021/jp074148h, 2007. Smialek, M. A., Hubin-Franskin, M. J., Delwiche, J., Du-flot, D., Mason, N. J., Vronning-Hoffmann, S., de Souza, G. G. B., Rodrigues, A. M. F., Rodrigues, F. N., and Limao-Vieira, P.: Limonene: electronic state spectroscopy by high-resolution vacuum ultraviolet photoabsorption, elec-tron scattering, He(I) photoelecelec-tron spectroscopy and ab ini-tio calculaini-tions, Phys. Chem. Chem. Phys., 14, 2056–2064, https://doi.org/10.1039/c2cp22847e, 2012.
Spangenberg, T., Kohler, S., Hansmann, B., Wachsmuth, U., Abel, B., and Smith, M. A.: Low-temperature reactions of OH radicals with propene and isoprene in pulsed laval nozzle expansions, J. Phys. Chem. A, 108, 7527–7534, https://doi.org/10.1021/jp031228m, 2004.
A. C., Monks, P. S., Oram, D., Reeves, C. E., Stewart, D., and Heard, D. E.: Isoprene oxidation mechanisms: measurements and modelling of OH and HO2over a South-East Asian tropical rain-forest during the OP3 field campaign, Atmos. Chem. Phys., 11, 6749–6771, https://doi.org/10.5194/acp-11-6749-2011, 2011. Vereecken, L., Muller, J. F., and Peeters, J.: Low-volatility
poly-oxygenates in the OH-initiated atmospheric oxidation of alpha-pinene: impact of non-traditional peroxyl radi-cal chemistry, Phys. Chem. Chem. Phys., 9, 5241–5248, https://doi.org/10.1039/b708023a, 2007.
Williams, J., Crowley, J., Fischer, H., Harder, H., Martinez, M., Petäjä, T., Rinne, J., Bäck, J., Boy, M., Dal Maso, M., Hakala, J., Kajos, M., Keronen, P., Rantala, P., Aalto, J., Aaltonen, H., Paatero, J., Vesala, T., Hakola, H., Levula, J., Pohja, T., Herrmann, F., Auld, J., Mesarchaki, E., Song, W., Yassaa, N., Nölscher, A., Johnson, A. M., Custer, T., Sinha, V., Thieser, J., Pouvesle, N., Taraborrelli, D., Tang, M. J., Bozem, H., Hosaynali-Beygi, Z., Axinte, R., Oswald, R., Novelli, A., Ku-bistin, D., Hens, K., Javed, U., Trawny, K., Breitenberger, C., Hidalgo, P. J., Ebben, C. J., Geiger, F. M., Corrigan, A. L., Russell, L. M., Ouwersloot, H. G., Vilà-Guerau de Arellano, J., Ganzeveld, L., Vogel, A., Beck, M., Bayerle, A., Kampf, C. J., Bertelmann, M., Köllner, F., Hoffmann, T., Valverde, J., González, D., Riekkola, M.-L., Kulmala, M., and Lelieveld, J.: The summertime Boreal forest field measurement intensive (HUMPPA-COPEC-2010): an overview of meteorological and chemical influences, Atmos. Chem. Phys., 11, 10599–10618, https://doi.org/10.5194/acp-11-10599-2011, 2011.
Winer, A. M., Lloyd, A. C., Darnall, K. R., and Pitts, J. N.: Rela-tive rate constants for reaction of hydroxyl radical with selected ketones, chloroethenes, and monoterpene hydrocarbons, J. Phys. Chem., 80, 1635–1639, https://doi.org/10.1021/j100555a024, 1976.


![Figure 4. Time-resolved OH LIF signals,tolysis Reaction (R5) of [H S, recorded in the pres-ence of different [isoprene] used to determine k1 (298 K)](https://thumb-us.123doks.com/thumbv2/123dok_us/7744284.165777/6.612.310.546.62.276/figure-resolved-signals-reaction-recorded-different-isoprene-determine.webp)

![Figure 8. Plots ofated [ B parameters derived from Eq. (2) vs. associ-α-pinene] used to determine k2 (OH +α-pinene) and k3 (OH+�-3-carene) in conditions of T = 296 K and P = 97 Torr (air).Weighted linear fits yield (in units of 10−11 cm3 molecule−1 s−1):k2](https://thumb-us.123doks.com/thumbv2/123dok_us/7744284.165777/9.612.310.546.65.276/figure-plots-parameters-derived-determine-conditions-weighted-molecule.webp)


