eurosta
eurostat
OFICINA ESTADÍSTICA DE LAS COMUNIDADES EUROPEAS DE EUROPÆISKE FÆLLESSKABERS STATISTISKE KONTOR STATISTISCHES AMT DER EUROPÄISCHEN GEMEINSCHAFTEN
ΣΤΑΤΙΣΤΙΚΗ ΥΠΗΡΕΣΙΑ ΤΩΝ ΕΥΡΩΠΑΪΚΩΝ ΚΟΙΝΟΤΗΤΩΝ
STATISTICAL OFFICE OF THE 'EUROPEAN COMMUNITIES
OFFICE STATISTIQUE DES COMMUNAUTÉS EUROPÉENNES
ISTITUTO STATISTICO DELLE COMUNITÀ EUROPEE
BUREAU VOOR DE STATISTIEK DER EUROPESE GEMEENSCHAPPEN SERVIÇO DE ESTATÍSTICA DAS COMUNIDADES EUROPEIAS
EUROOPAN YHTEISÖJEN TILASTOTOIMISTO
EUROPEISKA GEMENSKAPERNAS STATISTIKKONTOR
L-2920 Luxembourg — Tél. (352) 43 01-1 — Télex COMEUR LU 3423 B-1049 Bruxelles, rue de la Loi 200 — Tél. (32-2) 299 11 11
Las publicaciones de Eurostat están clasificadas por temas y por series. La clasificación se encuentra al final de la obra. Para mayor información sobre las publicaciones, rogamos se pongan en contacto con Eurostat.
Para los pedidos, diríjanse a las oficinas de venta cuyas direcciones figuran en la página interior de la contracubierta.
Eurostats publikationer er klassificeret efter emne og serie. En oversigt herover findes bag i hæftet. Yderligere oplysninger om publikationerne kan fås ved henvendelse til Eurostat.
Bestilling kan afgives til de salgssteder, der er anført på omslagets side 3.
Die Veröffentlichungen von Eurostat sind nach Themenkreisen und Reihen gegliedert. Die Gliederung ist hinten in jedem Band aufgeführt. Genauere Auskünfte über die Veröffentlichungen erteilt Eurostat.
Ihre Bestellungen richten Sie bitte an die Verkaufsbüros, deren Anschriften jeweils auf der dritten Umschlagseite der Veröffentlichungen zu finden sind.
Οι εκδόσεις της Eurostat ταξινομούνται κατά θέμα και κατά σειρά. Η ακριβής ταξινόμηση αναφέρεται στο
τέλος κάθε έκδοσης. Για λεπτομερέστερες πληροφορίες σχετικά με τις εκδόσεις, μπορείτε να απευθύ-νεσθε στην Eurostat.
Για τις παραγγελίες μπορείτε να απευθύνεσθε στα γραφεία πώλησης, των οποίων οι διευθύνσεις αναγράφονται στη σελίδα 3 του εξωφύλλου.
Eurostat's publications are classified according to themes and series. This classification is indicated at the end of the publication. For more detailed information on publications, contact Eurostat.
Orders are obtainable from the sales offices mentioned on the inside back cover.
Les publications d'Eurostat sont classées par thème et par série. Cette classification est précisée à la fin de l'ouvrage. Pour des informations plus détaillées sur les publications, contactez Eurostat.
Pour les commandes, adressez-vous aux bureaux de vente dont les adresses sont indiquées à la page 3 de la couverture.
Le pubblicazioni dell'Eurostat sono classificate per tema e per serie. Tale classificazione e precisata alla fine dell'opera. Per informazioni più dettagliate sulle pubblicazioni rivolgersi all'Eurostat.
Per eventuali ordinazioni rivolgersi a uno degli uffici di vendita i cui indirizzi figurano nella 3a pagina della copertina.
De publicaties van Eurostat zijn ingedeeld naar onderwerp en serie. Deze indeling Is achter in het boek opgenomen. Voor nadere informatie over de publicaties kunt u zich wenden tot Eurostat.
Gelieve bestellingen op te geven bij de verkoopbureaus, waarvan de adressen op bladzijde 3 van de omslag zijn vermeld.
As publicações do Eurostat estão classificadas por tema e por série. Esta classificação está indicada no firn da obra. Para mais informações sobre as publicações é favor contactar Eurostat.
Encomendas: serviços de venda cujos endereços estão indicados na contracapa.
Eurostatin julkaisut on luokiteltu aiheen ja sarjan mukaisesti. Luokittelu ilmoitetaan kunkin julkaisun lopussa. Lisätietoja julkaisuista saa Eurostatista.
Tilauksia voi tehdä myyntitoimistoista, jotka on lueteltu takakannen sisäpuolella.
Publikationer från Eurostat klassificeras efter ämnesområde och serie. Denna klassificering står angiven i slutet av publikationen. För ytterligare information om publikationer - kontakta Eurostat.
AGRICULTURAL INCOME
1996
A great deal of additional information on the European Union is available on the Internet. It can be accessed through the Europa server (http://europa.eu.int).
Cataloguing data can be found at the end of this publication
Luxembourg: Office for Official Publications of the European Communities, 1997
ISBN 92-827-9590-X
© European Communities, 1997
eurostat Table of contents
Table of contents
List of tables ¡¡
List of graphs ¡¡¡
List of abbreviations ¡v
1 Introduction 1
2 Changes in agricultural income in the European Union in 1996 over 1995 3
2.1 Main results: an overview 3 2.2 Final agricultural output 5
2.2.1 Crop output 6 2.2.2 Animal output 10 2.3 Intermediate consumption and gross value added at market prices 12
2.4 Distributive transactions 14
3 Changes in agricultural income in the Member States in 1996 over 1995 19
3.1 Belgium 19
3.2 Denmark 20
3.3 Germany 21
3.4 Greece 22
3.5 Spain 23
3.6 France 24
3.7 Ireland 25
3.8 Italy 26
3.9 Luxembourg 27
3.10 The Netherlands 28
3.11 Austria 29
' · 3.12 Portugal 30
3.13 Finland · 31
3.14 Sweden 32
3.15 United Kingdom 33
4 Long-term trends in agricultural income in the European Union from 1980 to 1996 35
4.1 Presentation of trends in agricultural income in the European Union 35
4.2 Main factors determining changes in income 37
5 Comparison of agricultural income levels in the Member States of the European
Union 39
6 Total Income of Agricultural Households 43
ANNEXES 45
Notes on methodology 46
List of tables and graphs
List of tables
eurostat
Table 2.1 Changes in the three agricultural income indicators for the European Union as a whole and Member States, 1994/93, 1995/94 and 1996/95 (in %)
Table 2.2 Changes in the volumes, prices and values of final agricultural output for the European Union as a whole and Member States, in 1996 as compared to 1995 (in %)
Table 2.3 Changes in the volumes, prices and values of final crop output for the European Union as a whole and Member States, in 1996 as compared to 1995 (in %)
Table 2.4 Changes ¡n the volumes, prices and values of the main crop products for the European Union as a whole, in 1996 as compared to 1995 (in %)
Table 2.5 Changes in the volumes, prices and values of final animal output for the
European Union as a whole and Member States, in 1996 as compared to 1995
(in %)
Table 2.6 Changes in the volumes, prices and values of the main items of animal output for the European Union as a whole, in 1996 as compared to 1995 (in %)
Table 2.7 Changes in the volumes, prices and values of intermediate consumption, as well as changes in the productivity of intermediate consumption and "terms of trade" for the European Union as a whole and Member States, in 1996 as compared to 1995 (in %)
Table 2.8 Changes in the volumes, prices and values of the main components of intermediate consumption for the European Union as a whole, in 1996 as compared to 1995 (in %)
Table 2.9 Changes in gross value added at market prices and its volume and price indices for the European Union as a whole and Member States, in 1996 as compared to 1995 (¡n%)
Table 2.10 Nominal and real changes in subsidies, taxes linked to production and depreciation in the European Union as a whole and Member States, in 1996 as compared to 1995 (in %)
Table 2.11 Nominal and real changes in rents, interest and compensation of employees for the European Union as a whole and Member States, in 1996 as compared to
1995 (in %)
Table 3.1 Changes in the main components of the income calculation for agriculture in Belgium, % change in 1996 over 1995
Table 3.2 Changes in the main components of the income calculation for agriculture in Denmark, % change in 1996 over 1995
Table 3.3 Changes in the main components of the income calculation for agriculture in Germany, % change in 1996 over 1995
Table 3.4 Changes in the main components of the income calculation for agriculture in Greece, % change in 1996 over 1995
Table 3.5 Changes in main components of the income calculation for agriculture in Spain, % change in 1996 over 1995
Table 3.6 Changes in the main components of the income calculation for agriculture in France, % change in 1996 over 1995
6
7
10
11
12
13
14
15
16
19
20
21
22
23
eurostat List of tables and graphs
Table 3.7 Changes in the main components of the income calculation for agriculture in Ireland, % change in 1996 over 1995
Table 3.8 Changes in the main components of the income calculation for agriculture in Italy, % change in 1996 over 1995
Table 3.9 Changes in the main components of the income calculation for agriculture in Luxembourg, % change in 1996 over 1995
Table 3.10 Changes in the main components of the income calculation for agriculture in the Netherlands, % change in 1996 over 1995
Table 3.11 Changes in the main components of the income calculation for agriculture in Austria, % change in 1996 over 1995
Table 3.12 Changes in the main components of the income calculation for agriculture in Portugal, % change in 1996 over 1995
Table 3.13 Changes in the main components of the income calculation for agriculture in Finland, % change in 1996 over 1995
Table 3.14 Changes in the main components of the income calculation for agriculture in Sweden, % change in 1996 over 1995
Table 3.15 Changes in the main components of the income calculation for agriculture in the United Kingdom, % change in 1996 over 1995
Table 4.1 Development of Indicators 1, 2 and 3 of agricultural income for the European Union between 1980 and 1996 ("1990" = 100)
Table 5.1 Indices of net value added at factor cost per annual work unit in "1981", "1985" and "1995", in ECU and PPS (EUR 15 = 100)
25
26
27
28
29
30
31
32
33
35
41
List of graphs
Graph 2.1 Changes in agricultural income Indicator 1 for the European Union as a whole and Member States, in 1996 (in %)
Graph 2.2 Indicator 1 in the Member States, indices for 1995 (base: 1989-1991 = 100, with the exception of Germany and EUR 15, 1990-1991 = 100) and changes in 1996
Graph 4.1 Development of Net Value Added at factor cost, in nominal and real terms, of total labour input and of Indicator 1 for the European Union as a whole between
1980 and 1996 ("1990"= 100)
Graph 5.1 Indices of net value added at factor cost per annual work unit in "1995", in ECU and PPS (EUR 15 = 100)
3
5
36
Signs and abbreviation employed
F37Ä
eurostat
Signs and abbreviations employed
EU European Union
EUR 12 The twelve Member States of the European Union excluding Austria, Finland and Sweden
EUR 15 The fifteen Member States of the European Union
Eurostat Statistical Office of the European Communities
Β DK D D11 D16 EL E F IRL I L NL A
Ρ FIN S UK
DE EN FR
Belgium Denmark Germany
Germany as before 03.10.1990 Germany as after 03.10.1990 Greece
Spain France Ireland Italy
Luxembourg Netherlands Austria
Portugal Finland Sweden
United Kingdom
German English French
AWU BSE CAP EAA ECU EMS ESA
GDPmp
GVAfc GVAmp mio NVAfc PPS TIAH
VAT
"1990"
Annual Work Unit
Bovine Spongiform Encephalopathy Common Agricultural Policy
Economic Accounts for Agriculture European Currency Unit
European Monetary System European System of integrated economic Accounts
Gross Domestic Product at market prices
Gross Value Added at factor cost ' . Gross Value Added at market prices million
Net Value Added at factor cost Purchasing Power Standard Total Income of Agricultural Households
Value-Added Tax
[1989+1990+1991]/3 not available
ΉΔ
eurostat Introduction - Chapter 1
1 Introduction
The report Agricultural Income 1996 is the latest in the Eurostat series giving estimates of recent changes in agricultural income in the Member States and in the European Union as a whole. The calculations are based on data provided by the appropriate national authorities. Users of this publication will find information on, and analyses of, the income situation in agriculture and how this has changed over time. Eurostat endeavours to improve publications each year and 1996 sees a more concise publication than previously. There has been a conscious effort to remove the duplication of information between text, tables and charts. A high level of analysis has been maintained.
This publication focuses on the changes in agricultural income in the Member States and in the European Union as a whole for 1996 compared to 1995 with analyses and comments on these changes. These analyses chart the effect of the different factors on changes in incomes in 1996 (Chapters 2 and 3), place recent results in the context of changes in agriculture within the European Union since 1980 (Chapter 4), and allow comparisons of absolute levels of agricultural income between Member States (Chapter 5).
The figures are based on the last available estimates (January 1997) from the appropriate national authorities regarding the probable changes in prices, quantities and values for the products and the charges that determine income in the agricultural sector. The methodology applied is that of the Economic Accounts for Agriculture (EAA)1.
Three Indicators are derived from the EAA to show unit income trends in agriculture. These are currently, net value added at factor cost in agriculture, which is calculated by taking the value of final agricultural output and deducting intermediate consumption, depreciation and taxes linked to production, and then adding subsidies2. By deflating this figure with the implicit price index of gross domestic product at market prices3 and dividing by the volume of total labour in agriculture4, Indicator 1 is obtained;
Net income from the agricultural activity of total labour input, which is calculated by subtracting rents and interest payments from net value added at factor cost. This figure, when deflated with the same price index referred to above and divided by the volume of total labour input in agriculture, gives Indicator 2; Net income from the agricultural activity of family labour input, which is calculated by deducting the compensation of employees from the net income from the agricultural activity of total labour input. This figure is then deflated like the two previous ones and divided by the volume of family labour only (the holder and members of his family working on the holding) to give Indicator 3.
To calculate Indicators 2 and 3, more information is needed than for calculating Indicator 1: data on rents and interest for Indicator 2, and on the compensation of employees and the breakdown into family and non-family (salaried) labour input for Indicator 3. Full harmonisation of these variables has yet to be achieved totally in the Member States. For this reason, the analysis centres on Indicator 1, which is more reliable and more easily comparable than the other two.
The development of agricultural income in 1996 for the European Union as a whole is presented and analysed in Chapter 2 of this report. It is then examined concisely for each Member State in Chapter 3. As in previous years, there is some analysis of the development of agricultural income over the longer-term for the European Union as a whole in Chapter 4. However the reader is referred to last year's publication5 for the analysis of long-term trends for each Member State. The analysis of the long-term trends in agricultural income for the European Union as a whole and the factors determining these developments refer to rates of change that are calculated on the basis of "years". These "years" correspond to the averages of three years, in order to reduce the impact of strong short-term fluctuations. With the Economic Accounts for Agriculture only being available since 1990 for Germany in its territorial situation after the 03.10.1990, the analysis of the
1 cf. Eurostat Manual on Economic Accounts for Agriculture and Forestry, Theme 5, Series E, Luxembourg 1989 (and Addendum, 1992).
2 cf. Methodological Note A.1 on the calculation of agricultural aggregates.
3 cf. Methodological Note A.4 on the calculation of the deflated series, especially for the European Union as a whole. 4 cf. Methodological Note A.2 on the definition and measurement of the agricultural labour input.
w&
Introduction - Chapter 1 eurostat
long-term development of agricultural incomes for the European Union is presented firstly according to the territorial situation before the 03.10.1990 for the period "1981"/"1991" and then immediately according to the territorial situation after the 03.10.1990 for the period "1991 "/"1995". For the first time this year, Portugal has extended its Economic Accounts for Agriculture to include the islands of Madeira and the Azores. New data sources have also been used to established a new series of accounts than run from 1986 to 1996. The Annex tables at the back of this publication mark a break in the long-term series for Portugal and the European Union as a whole. However, the impact of this break for EUR 15 is very limited and therefore the analysis of EUR 15 trends in Chapter 4 does not draw attention to it.
The analyses and comments on the development of agricultural income presented in Chapters 2 and 3 (short-term changes) and 4 (long-term changes) of this report are mainly related to changes in real terms (deflated). In effect, while studying nominal changes can be of some interest in a national context, it is much less relevant when calculating European Union aggregates or when establishing comparisons between countries with very different inflation rates.
Although annual changes in income remain the central element for analysis, absolute agricultural income
levels per annual work unit in each Member State are compared in Chapter 5, in spite of considerable methodological and statistical reservations. With a view to improving the comparability of incomes, figures are
converted on the basis of both the ECU and purchasing power standards (PPS)6. A comparison is also made
of the development in the absolute levels of agricultural incomes per annual work unit between the Member States.
It should be noted that the agricultural income concerned in the Chapters mentioned so far is based on
macro-economic and national data. The figures therefore reflect the average development of agricultural incomes, without any possibility of differentiation according to regions or types of holdings. Actual levels of income may, in some cases, deviate substantially from the averages given in this report.
Furthermore, the Indicators relate only to the agricultural branch. When interpreting results, it should be
eurostat Agricultural income in the European Union in 1996 - Chapter 2
2 Changes in agricultural income in the European Union in 1996 over 1995
2.1 Main results: an overview
Clear rise in income for third year in succession
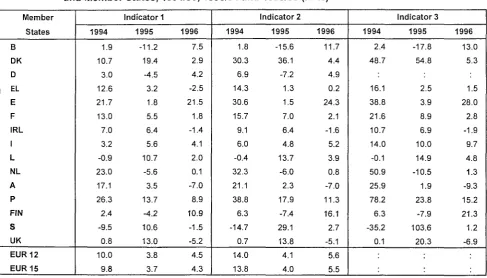
On the basis of the estimates that were made available in January-February of 1997 by the Member States for the year 1996, agricultural income as measured by real net value added at factor cost per annual work unit (Indicator 1) will once again have risen markedly (+4.3%)7 for the European Union as a whole. After the
considerable increase in 1989, the average agricultural income for the European Union as a whole expressed in these unit terms was more or less unchanged between 1990 and 1993. However, strong annual rises have been recorded since 1994, and the level of Indictor 1 in 1996 is estimated to be around 18% higher than that of the reference base year ("1990"). All the same, this average increase in 1996 masks some widely differing developments in individual Member States (see Graph 2.1) and in sectors of production.
Graph 2.1 Changes in agricultural income Indicator 1 for the European Union as a whole and Member States, in 1996 (in %)
20
10
-10
-20
-30
21.5
10.9
"775"
2.9
4.2 4.1
"*—^—'—limili '
'
m'
τ^-"
-2.5
2.0 0.1
4.5 4.3
\Mm¡
-5.2 -7.0
DK EL IRL NL FIN UK EUR
12
EUR
15
Real net income from the agricultural activity of total labour input per AWU of total labour input (Indicator 2) is also estimated to have risen sharply (+5.5%) in 1996. It was not possible to calculate real net agricultural income per AWU of family labour input (Indicator 3) for EUR 15, because the item "compensation of employees" could not be estimated for Germany on a basis comparable with that in the other Member States, due to the particular structure of agricultural holdings in the five new German Länder.
Real net value added at factor cost up only slightly, labour input down
The clear increase in Indicator 1 for 1996 can essentially be attributed to the continued decline in total agricultural labour input, since real net value added at factor cost was only slightly up on 1995 (+1.0%). For the European Union as a whole, the decline in total labour input was measured at -3.2% in 1996, a rate of decrease slightly less than the long-term average.
Agricultural income in the European Union in 1996 - Chapter 2 eurostat
The main factors influencing the change in real net value added at factor cost for the European Union as a whole were as follows:
■ a notable rise in the volume of final agricultural output, stemming entirely from the higher output volume of crop products;
■ a decline in the average price of final agricultural output in real terms, underlying which were highly contrasting trends in the individual crop and animal products;
■ a moderate increase in the real value of total intermediate consumption, resulting from slightly higher volumes and real prices on average (particularly the price rises for feedingstuffs, energy and fertilizers); ■ a moderate rise in subsidies, contributory factors being the support measures for the beef market and
compensatory payments for cattle producers; ■ virtually unchanged depreciation in real terms.
[image:12.595.61.549.357.635.2]The level of real gross value added at market prices remained almost unchanged, despite the small increase in the real value of final output. This was because of the higher real value of total intermediate consumption. A greater level of subsidies together with stable depreciation costs in real terms allowed real net value added at factor cost to rise a little. A steep fall in interest payments meant that the rise in agricultural branch income measured by the net income of total labour was more pronounced (+2.2%).
Table 2.1 Changes in the three agricultural income indicators for the European Union as a whole and Member States, 1994/93,1995/94 and 1996/95 (in %)
Member States Β DK D EL E F IRL I L NL A Ρ FIN S UK EUR 12 EUR 15
Indicator 1 1994
1.9 10.7 3.0 12.6 21.7 13.0 7.0 3.2 0.9 23.0 17.1 26.3 2.4 9.5 0.8 10.0 9.8
1995 -11.2
19.4 4.5 3.2 1.8 5.5 6.4 5.6 10.7 5.6 3.5 13.7 4.2 10.6 13.0 3.8 3.7
1996 7.5 2.9 4.2 2.5 21.5 1.8 1.4 4.1 2.0 0.1 7.0 8.9 10.9 1.5 5.2 4.5 4.3
Indicator 2 1994
1.8 30.3 6.9 14.3 30.6 15.7 9.1 6.0 0.4 32.3 21.1 38.8 6.3 14.7 0.7 14.0 13.8
1995 -15.6
36.1 7.2 1.3 1.5 7.0 6.4 4.8 13.7 6.0 2.3 17.9 7.4 29.1 13.8 4.1 4.0
1996 11.7
4.4 4.9 0.2 24.3 2.1 1.6 5.2 3.9 0.8 7.0 11.3 16.1 2.7 5.1 5.6 5.5
lnd¡cator3 1994
2.4 48.7
16.1 38.8 21.6 10.7 14.0 -0.1 50.9 25.9 78.2 6.3 -35.2 0.1
1995 -17.8
54.8
2.5 3.9 8.9 6.9 10.0 14.9 -10.5 1.9 23.8 -7.9 103.6 20.3
1996 13.0
5.3
1.5 28.0 2.8 -1.9 9.7 4.8 1.3 -9.3 15.2 21.3 1.2 -6.9
eurostat Agricultural income in the European Union in 1996 - Chapter 2
Graph 2.2 puts the changes in agricultural income in 1996 for the various Member States in a medium-term perspective. The index of real net value added at factor cost per annual work unit (Indicator 1) is calculated using a base equal to 100 for the average of the three years from 1989 to 19918 ("1990"). The graph takes the value of the index in 1995 as the starting point, and shows the change in 1996 as well as the new level of the index for 1996 in each of the Member States.
When interpreting the values of the index shown in Graph 2.2, it should be remembered that they do not allow a comparison of the income levels between Member States, but only a comparison of their trends since the start of the 1990s.
In 1996, the highest indices (compared with "1990"), at levels more than +10% above the "1990" reference year, were those for Spain, Portugal, the United Kingdom, Ireland, France, Denmark, Italy and Germany. In contrast, the indices for Sweden, the Netherlands and Belgium were more than -10% below their levels in "1990", with those for Greece, Luxembourg, Austria and Finland remaining nearer to their "1990" levels. Graph 2.2 Indicator 1 in the Member States, indices for 1995 (base: 1989-1991 = 100, with the
exception of Germany and EUR 15, 1990-1991 = 100) and changes in 1996
150
140
130
120
110
100
90
80
70
— 1995
M 1996
Β DK D EL E F IRL L NL Α Ρ S FIN UK EUR15
2.2 Final agricultural output
Output value up slightly
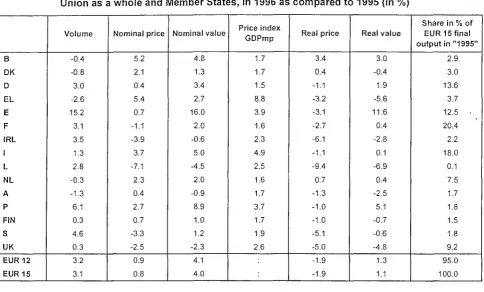
The real value of final agricultural output in the European Union is estimated to have risen slightly in 1996 (+1.1%) as a result of a higher volume of output (+3.1%) and falling prices in real terms (-1.9%). The price and volume developments for final output were mainly determined by the trends in crop products, the reason being that, on the animal output side, the highly contrasting trends in the real prices of individual products virtually cancelled each other out, while the total volume remained stable. The share of final crop output in final agricultural output amounted to 48.1% in "1995", while that of animal output stood at 51.6%9 (in real ECU at a constant 1990 rate of exchange).
Except for Germany (1990+1991 )/2) = 100.
Agricultural income in the European Union in 1996 - Chapter 2 eurostat
[image:14.595.64.549.203.495.2]Trends in the individual Member States were highly varied. Only in four Member States did the real value of final output rise clearly (Spain, Portugal, Belgium and Germany). By contrast, there were marked decreases in five others, as can be seen in Table 2.2 (Luxembourg, Greece, the United Kingdom, Ireland and Austria). In terms of the average price of final output in real terms, the only Member State where it was notably higher was Belgium. There were marked decreases for Luxembourg, Ireland, Sweden, the United Kingdom, Greece, Spain and France, most of others experiencing only a slightly lower price. Final output volumes, on the other hand, were well above the levels of the previous year in several Member States (particularly in Spain, but also in Portugal, Sweden, Ireland, France, Germany and Luxembourg).
Table 2.2 Changes in the volumes, prices and values of final agricultural output for the European Union as a whole and Member States, in 1996 as compared to 1995 (in %)
Β DK D EL E F IRL I L NL A Ρ FIN S UK EUR 12 EUR 15
Volume
-0.4 -0.8 3.0 -2.6 15.2 3.1 3.5 1.3 2.8 -0.3 -1.3 6.1 0.3 4.6 0.3 3.2 3.1
Nominal price
5.2 2.1 0.4 5.4 0.7 -1.1 -3.9 3.7 -7.1 2.3 0.4 2.7 0.7 -3.3 -2.5 0.9 0.8
Nominal value
4.8 1.3 3.4 2.7 16.0 2.0 -0.6 5.0 -4.5 2.0 -0.9 8.9 1.0 1.2 -2.3 4.1 4.0
Price index GDPmp
1.7 1.7 1.5 8.8 3.9 1.6 2.3 4.9 2.5 1.6 1.7 3.7 1.7 1.9 2.6
Real price
3.4 0.4 -1.1 -3.2 -3.1 -2.7 -6.1 -1.1 -9.4 0.7 -1.3 -1.0 -1.0 -5.1 -5.0 -1.9 -1.9
Real value
3.0 -0.4 1.9 -5.6 11.6 0.4 -2.8 0.1 -6.9 0.4 -2.5 5.1 -0.7 -0.6 -4.8 1.3 1.1
Share in % of EUR 15 final output in "1995"
2.9 3.0 13.6 3.7 12.5 . 20.4
2.2 18.0 0.1 7.5 1.7 1.8
1.5
1.8 9.2 95.0 100.0 2.2.1 Crop output
Bumper harvest and lower real prices, but widely contrasting developments in the Member States The real value of final crop output in the European Union as a whole rose by +2.7% in 1996 compared with
1995, reflecting an appreciable increase in output volume (+6.4%) and a fall in real prices (-3.4%).
The trends in prices, volumes and hence values within the crop sector were very different from one product to another and between the individual Member States, particularly on account of the varying sensitivity of crops to climatic conditions, but also because of the various market situations. In addition, the changes in 1996 are measured against the volumes and price levels attained in 1995 and therefore have to be assessed in the light of the previous year's results.
[m
[image:15.595.52.542.493.752.2]eurostat Agricultural income in the European Union in 1996 - Chapter 2
Table 2.3 Changes in the volumes, prices and values of final crop output for the European Union as a whole and Member States, in 1996 as compared to 1995 (in %)
Β DK D EL E F IRL I L NL A Ρ FIN S UK EUR 12 EUR 15
Volume -3.7 -1.9 7.7 -3.8 26.0 5.5 10.1 0.6 1.3 -0.2 -9.4 10.3 0.8 14.5 9.1 6.5 6.4
Nominal price 4.4 -0.6 -1.8 7.6 -2.2 -1.6 -12.0 4.3 -2.9 2.1 1.5 0.2 0.7 -6.8 -10.8 -0.4 -0.4
Nominal value 0.6 -2.4 5.7 3.5 23.3 3.8 -3.1 4.9 -1.6 »
1.9 -8.0 10.5 1.5 6.7 -2.7 6.1 5.9
Real price 2.7 -2.3 -3.3 -1.1 -5.9 -3.1 -14.0 -0.6 -5.3 0.5 -0.2 -3.4 -1.0 -8.5 -13.1 -3.4 -3.4
Real value -1.1 -4.0 4.1 -4.9 18.6 2.1 -5.3 0.0 -4.0 0.3 -9.5 6.6 -0.2 4.7 -5.2 2.9 2.7
Share in % of EUR 15 final output in "1995"
1.1 0.9 5.3 2.6 7.2 10.4 0.3 10.9 0.0 3.5 0.6 0.8 0.4 0.6 3.5 46.5 48.1
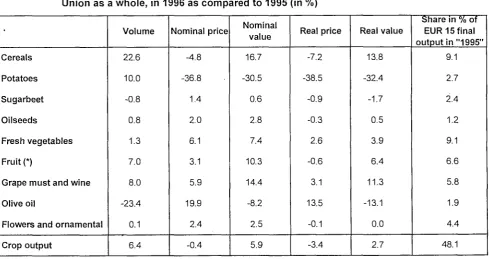
The fall in the real price of final crop output in large measure reflected the corresponding slump in potato prices and the lower price for cereals in the European Union. This aggregate price decline was however cushioned by higher prices for fresh vegetables and wine, which together accounted for around 30% of crop output value in "1995".
There now follow short commentaries on the individual trends for the nine crop output items that each account for more than one percent of the value of final output (see Table 2.4.).
Table 2.4 Changes in the volumes, prices and values of the main crop products for the European Union as a whole, in 1996 as compared to 1995 (in %)
Cereals Potatoes Sugarbeet Oilseeds
Fresh vegetables Fruit (*)
Grape m u s t and wine Olive oil
Flowers and ornamental Crop output
Volume 22.6 10.0 -0.8 0.8 1.3 7.0 8.0 -23.4 0.1 6.4
Nominal price -4.8 -36.8 1.4 2.0 6.1 3.1 5.9 19.9 2.4 -0.4
Nominal value 16.7 -30.5 0.6 2.8 7.4 10.3 14.4 -8.2 2.5 5.9
Real price -7.2 -38.5 -0.9 -0.3 2.6 -0.6 3.1 13.5 -0.1 -3.4
Real value 13.8 -32.4 -1.7 0.5 3.9 6.4 11.3 -13.1 0.0 2.7
Share in % of EUR 15 final o u t p u t i n "1995"
~m
Agricultural income in the European Union in 1996 - Chapter 2 eurostat
Cereals: volumes soar, prices down
Virtually every Member State recorded a clear rise in the volume of cereals harvested in 1996. The changes in output volume were generally even more pronounced. For the European Union as a whole the rise in cereals output volume was +22.6% on 1995 and some +10% up on the level reached in the reference year "1990". In many Member States, the higher output volumes were the result not only of favourable weather conditions and the associated higher yields but also of a greater area sown to cereals following the reduction in the rate of land set-aside from 12% (1995 harvest) to 10% (1996 harvest). It should be recalled that this change in set-aside rates relates to areas sown not only to cereals but also oilseeds and protein crops, and is - except in the case of small producers - the prerequisite for claiming direct compensatory payments for the lowering of institutional prices under the 1992 CAP reform.
The biggest contribution to the soaring volume of cereals output in the European Union came from the harvest yields on the Iberian Peninsula, which rose again steeply after the frost- and drought-stricken year of 1995 (the volume of output in Spain rose by more than 200%). There were also considerable increases in the volume of cereals output in the other main producer countries, France, the United Kingdom and Germany (cf. Annex Table A.4), where there were also both greater areas sown to cereals and higher yields in 1996.
Real cereals prices weakened appreciably in almost all Member States in 1996, falling in the European Union as a whole by -7.2% in real terms. Support prices were not lowered for 1996/97 (1996 harvest). In the previous year, however, despite the support price having been decreased by almost 7% under the CAP reform, a slight increase in cereals prices was recorded owing to a palpable recovery on the markets (lower output and stocks in the European Union and world-wide). In 1996, prices fell sharply both in countries like France, which is by far the biggest cereals exporter of the European Union (including ¡ntra-Community trade), and those that are less than fully self-sufficient in total cereals (like Ireland, Portugal, Belgium and Italy). Price rises in real terms were recorded in Austria, Germany and (only very slightly) in Finland.
Potatoes: slump in prices in the wake of bumper potato harvest
The volume of potatoes output (a product that accounted for 2.7% of the real value of final agricultural output in EUR 15 in "1995") was notably higher in 1996 (+10.0%). This was due primarily to higher yields but also to the larger areas planted to this crop in response to the relatively high price level in the previous year. The output volume was also high (+10%) in terms of a medium-term comparison with the base year "1990". Of most note were the largely yield-related increases in volume for Germany (+33.4%) and Belgium (+20.9%), but there were also greater volumes of output in main producer countries, France, the Netherlands and the United Kingdom. Prices slumped in the wake of greater harvests almost throughout the European Union, leading to a tumble in real output value (-32.4%).
Sugarbeet: slight fall in real output value
The output volume of sugarbeet is estimated to have decreased slightly in 1996 for EUR 15. In France, which alongside Germany is the largest sugarbeet producer in the European Union, output volumes decreased considerably according to available estimates (see Annex Table A.4). Italy, Finland and Greece likewise recorded marked falls in output volumes. In contrast, output volumes in the United Kingdom and Denmark rose sharply, particularly due to favourable weather conditions providing for a better harvest.
In almost all Member States, the real price of sugarbeet declined to some extent. Only in Germany, Belgium and Greece was an increase in real prices recorded. For EUR 15 on average, there was a slight fall the in real price, which together with the change in output volume led to a -1.7% decrease in the real value of output.
Oilseeds: widely contrasting developments in the Member States
m
eurostat Agricultural income in the European Union in 1996 - Chapter 2
output volumes were much lower. The average price for oilseeds in real terms for the European Union as a whole was barely changed (-0.3%) in 1996 from that in 1995, although again there were quite different developments in the Member States. Similarly, the output value of oilseeds for EUR 15 is estimated to have remained almost unchanged (+0.5%) in 1996.
Fresh vegetables: price-related increase in real output value
The value of fresh vegetables accounted for about 9% of the real value of final agricultural output in "1995", a proportion the same as that of cereals (see Table 2.4). In 1996, clear increases in the volume of fresh vegetables output were reported from five Member States, including Spain, the United Kingdom and Germany, which are the main producer countries. The output volumes in France, Italy, the Netherlands and Belgium, by contrast, were slightly to well down on the previous year. For the European Union as a whole, the net result of these contrasting trends was a slight rise in the volume of output (+1.3%).
Likewise, there were mixed developments in prices among the Member States, reflecting the breakdown of output into a wide range of vegetables. On aggregate, real price increases predominated, so that for EUR 15 a moderate price rise (+2.6%) was recorded. Together with the slightly higher output volume, therefore, this resulted in a clear increase in the real value of fresh vegetables output (+3.9%).
Fruit10: real output value well up on previous year
The volume of fruit output in the European Union is estimated to have risen again markedly (+7.0% as a whole in 1996). Almost all the main producer countries recorded an appreciable increase, stemming mainly from more favourable weather conditions compared with the previous year. Only in France, the third largest producer country, was the volume increase merely moderate (+2.3%). However, this must be seen against the background of the good harvest in 1995. In contrast to these Member States, output volumes in Belgium, the Netherlands, Austria and Denmark were well down on 1995.
The average price for fruit as a whole in real terms just about matched that of the previous year (-0.6%), despite declines in Spain and France as well as some other Member States. This stabilisation of the real price was due to the higher level in Germany, only slightly lower real prices in Greece and Italy, and although being only relatively small producers, the substantial price rises in Belgium and the Netherlands. As a result of these changes in prices and volumes, the real value of fruit in the EU was much higher than in 1995 (+6.4%).
Wine: much higher volumes and slightly higher real price as a whole
The considerable increase (+8.0%) in the volume of grape must and wine output in the European Union in 1996 was mainly attributable to a recovery in harvests in Spain and Portugal following the prolonged drought and the rise in Italy (see Annex Table A.4.). In France, where the value of grape must and wine contributed to half of the value of output for the EU as a whole in 1995, the volume of output was estimated to have risen only slightly in 1996. After three years of low volumes, the grape must and wine output of EUR 15 rose in 1996 to once again slightly exceed the level of the reference year "1990".
Despite this higher output volume, the average price for the European Union as a whole nevertheless rose in real terms (+3.1%), the key influencing factors being buoyant prices in Italy and in Germany. The real value of grape must and wine output for the European Union as a whole therefore rose considerably (+11.3%), mainly as a result of the change in output volume.
Olive oil: steep fall in output volume
The volume of olive oil output in the European Union fell substantially (-23.4%) in 1996. In more detail, output volumes in Spain and Italy were particularly down on 1995, with that in Portugal rising sharply and that in Greece remained nearly unchanged. With the fluctuating nature of consecutive harvests, the output volume changes in 1995 should be recalled; for example, the higher volume in Italy and lower volume in Portugal. With the much lower volume of output in 1996 for the European Union, prices rose sharply (an average +13.5% in real terms). This was the third consecutive real price increase and was recorded in all the producer
Agricultural income in the European Union in 1996 - Chapter 2 eurostat
countries, being particularly up in Spain (see Annex Table A.6). Higher prices in 1996 only partially offset the substantially lower EU output volume, so that there was still a large'decrease in real value (-13.1 %).
Flowers and ornamental plants: unchanged real price on average, output volume and thus value For the European Union as a whole, the real output value of flowers and ornamental plants remained unchanged, as did volumes and real prices. In the Netherlands, the most important producer country, the value of output increased, mainly as a result of higher real prices, whereas the increase in France was chiefly volume-related. In Germany, Denmark and the United Kingdom, the value of output remained virtually unchanged in real terms. Some of the other Member States recorded pronounced declines in real value. 2.2.2 Animal output
Real output value unchanged as products show highly contrasting price trends
The volume of animal output in the European Union in 1996 matched the level of the previous year. Highly contrasting price trends for individual products cancelled each other out in the aggregate, so that the real value of final animal output in 1996 remained unchanged. Markets for animal products were severely affected in 1996 by shifts in demand away from beef as a result of the BSE11 crisis. For physical reasons, it was not possible to adjust the volumes of most animal products in line with the changed demand conditions, which led to a drastic slump in beef prices and a simultaneous sharp rise in prices for other types of meat.
Depending on the weight carried by the individual products in Member States, the real value of animal output changed in widely contrasting ways. In Portugal, Belgium, Spain, Denmark and Austria, for example, the real value of final animal output showed slight to pronounced increases, whereas in Greece, Luxembourg, the United Kingdom, Sweden, Ireland and France, output value declined, in some cases markedly so. In the other Member States, the value remained virtually unchanged (see Table 2.5).
Table 2.5 Changes in the volumes, prices and values of final animal output for the European Union as a whole and Member States, in 1996 as compared to 1995 (in %)
Β DK D EL E F IRL I L NL A Ρ FIN S UK EUR 12 EUR 15
Volume 2.1 -0.4 0.2 0.3 1.4 0.8 2.6 2.4 3.2 -0.4 2.3 2.6 0.1 0.3 -5.5 0.2 0.3
Nominal price 5.3 3.3 1.7 0.6 5.4 -0.5 -2.7 2.6 -8.0 2.6 0.5 5.2 0.7 -1.6 3.7 2.1 2.0
Nominal value 7.5 2.9 2.0 0.8 6.9 0.3 -0.2 5.1 -5.1 2.2 2.8 7.9 0.8 -1.3 -2.0 2.3 2.2
Real price 3.5 1.6 0.2 -7.6 1.4 -2.1 -4.9 -2.2 -10.2 1.0 -1.2 1.4 -1.0 -3.4 1.1 -0.5 -0.6
Real value 5.7 1.2 0.5 -7.3 2.9 -1.3 -2.5 0.2 -7.4 0.6 1.1 4.0 -0.9 -3.2 -4.5 -0.3 -0.3
Share in % of EUR 15 final output in "1995"
\m
eurostat Agricultural income in the European Union in 1996 - Chapter 2
the common market organisation for the main product (milk) are relatively stringent, and the production structures are quite similar from one country to the next.
There follow short commentaries on the individual developments for the six items of final animal output which each account for more than one percent of final output (see Table 2.6).
Table 2.6 Changes in the volumes, prices and values of the main items of animal output for the European Union as a whole, in 1996 as compared to 1995 (in %)
Cattle (including calves) Pigs
Sheep and goats Poultry
Milk Eggs
Animal output
Volume
-1.4 1.4 0.0 3.2 0.3 -2.0 0.3
Nominal price
-12.0 12.2 13.5 6.4 -0.3 19.1 2.0
Nominal value
-13.2
13.7
13.6
9.7 0.0 16.7 2.2
Real price
-14.1
9.6 9.4 3.5 -2.6
15.9
-0.6
Real value
-15.3
11.1
9.4 6.8 -2.3
13.6
-0.3
Share in % of EUR 15 final outputin "1995"
11.4 11.2 1.9 5.1 17.8 2.4 51.6
Sharp fall in real value of cattle output owing to slump in price of cattle for slaughter
As a result of the debate surrounding the possible transmission of BSE from cattle to humans, demand for beef in the European Union fell sharply in 1996. Despite various support measures, this led to a slump in the price of cattle for slaughter (-14.1% in real terms). The market supplies of cattle were inelastic to such a drastic and immediate loss of demand and output volumes in most Member States rose slightly. For the European Union as a whole, however, the volume of output was slightly down (-1.4%), reflecting the special situation regarding the United Kingdom, where there was a very pronounced decrease (-28.7%). This was because, under the measures to combat BSE, a large proportion of the cattle intended for slaughter was not brought onto the market but rather culled (the Over Thirty Months Slaughter Scheme) and thus not taken into account in the output volume. The real value of cattle output fell markedly in all Member States, resulting in an appreciable average decrease (-15.3%) for the European Union as a whole.
Pig prices benefit from beef crisis: real output value considerably higher
In contrast to the cattle situation, the value of pig output rose steeply (+ 11.1% in real terms for EUR 15). Given the nature of animal production, output volumes of pigs could not be readily adjusted in the immediate short term to meet greater demand, following the shift away from beef to pigmeat in the European Union, with the result that pig prices rose sharply (+9.6% in real terms). This rise in prices was to be observed in all Member States with the exception of Sweden, Finland and Italy (see Annex Table A.6).
Poultry output: volume and real prices rise in equal measure
The volume of poultry output in the European Union increased again in 1996 (+3.2%). Against the trend of recent years, poultry prices also rose in most Member States - in some cases markedly - in the wake of the beef crisis. As an average for the European Union, the rise in real prices (+3.5%) contributed as much as the greater volume to the higher real value of poultry output (+6.8%).
Price-related increase in real value of sheep and goats output
Agricultural income in the European Union in 1996 - Chapter 2 eurostat
Wh
Milk volume stable, real value of output slightly down
The volume of milk output for the European Union as a whole remained virtually unchanged in 1996 compared with 1995. Milk quotas in 1996 were at the same level as in 1995. Higher output volumes were recorded by Spain, Portugal, Italy and Austria. Real prices, on the other hand, decreased markedly in many Member States. Only in Italy, Austria and Sweden were they unchanged. As an average for the European Union, real prices declined, so that - with volume stable - the real value of output fell moderately (-2.3%). Sharp rise in egg prices make for sharp increase in real output value
The volume of egg output in the European Union as a whole decreased slightly (-2.0%) in 1996. This may be attributable to the arrangements made by producers in response to the supply overhang in the previous year. Only in the Benelux countries did output volume increase clearly. Egg prices rose appreciably in real terms in all Member States with the exception of Luxembourg and Sweden. This upswing in prices should be seen in the context of the low prices in the previous year and buoyant demand in 1996. For the European Union as a whole, an average real price increase of+15.9% was recorded, which despite a slight decrease in volume led to a substantial rise in the real value of output (+13.6%).
2.3 Intermediate consumption and gross value added at market prices
Rare increase in the value of intermediate consumption for EUR 15
The real value of intermediate consumption in agriculture for the European Union as a whole is estimated to have increased in 1996 (+2.3%), with volume growing by +0.9% and real prices on average by +1.4%. This rise in the average price of total intermediate consumption in real terms was the first since the early 1980s. It helps explain why the trend of progressively lower real values for total intermediate consumption appears to have been bucked.
Real prices and values of total intermediate consumption increased in the clear majority of Member States. In the case of four Member States (United Kingdom, Belgium, the Netherlands and France), where real prices rose faster than the EU average, volumes of total intermediate consumption were also higher in 1996 than in 1995. Reflecting the average EU change, volumes varied by less than one percent in eight of the Member States.
Table 2.7 Changes in the volumes, prices and values of intermediate consumption, as well as changes in the productivity of intermediate consumption and "terms of trade" for the European Union as a whole and Member States, in 1996 as compared to 1995 (in %)
Β DK D EL E F IRL I L NL A Ρ FIN S UK EUR 12 EUR 15
Volume 0.7 -0.5 0.1 -0.7 2.7 2.1 1.9 -0.7 2.3 0.7 -1.7 3.3 -2.7 -1.0 0.9 1.0 0.9
Nominal price 5.0 1.1 3.5 8.9 3.5 2.9 2.8 4.9 0.3 3.8 2.9 1.4 2.6 6.5 6.1 3.8 3.8
Nominal value
5.7 0.6 3.5 8.1 6.4 5.1 4.8 4.2 2.5 4.5 1.2 4.8 -0.2 5.5 7.0 4.9 4.8
Real price 3.2 -0.6 2.0 0.1 -0.4 1.3 0.5 0.0 -2.1 2.1 1.2 -2.2 0.9 4.5 3.4 1.3 1.4
Real value 4.0 -1.1 2.0 -0.6 2.4 3.4 2.4 -0.6 0.0 2.9 -0.5 1.0 -1.8 3.6 4.3 2.4 2.3
"Productivity" -1.1 -0.3 2.9 -1.9 12.2 1.0 1.6 2.0 0.5 -1.0 0.4 2.7 3.1 5.7 -0.6 2.2 2.2
"Terms of trade"
0.2 1.0 -3.0 -3.2 -2.7 -3.9 -6.6 -1.1 -7.4 -1.4 -2.4 1.3 -1.9 -9.2 -8.1 -2.8 -2.9
Share in % of EUR 15 Total I.C. in "1995"
\m
eurostat Agricultural income in the European Union in 1996 - Chapter 2 By comparing the annual development of intermediate consumption with that of final output, measures of the change in the productivity of intermediate consumption (volume ratio) and the "terms of trade" for agriculture (the nominal price ratio) can be obtained.The productivity of intermediate consumption increased by +2.2% for the European Union as a whole, although this figure conceals variations between Member States. Any single year's figure on its own should, however, be treated with caution, since climatic conditions can greatly affect output volumes (for long-term changes see Table A.39 in the statistical annex). This was certainly the case in 1996. At one extreme was Spain, where the sharp rise in this measure of productivity was principally the result of crop output volumes rebounding from their drought affected levels in the previous four years. At the other extreme was Greece, where productivity for the year decreased, mainly because volumes of cotton output were steeply lower due to hail and heavy rainfall. In all, there were ten Member States (including Germany, France and Italy) where there were improvements in the productivity of intermediate consumption. The changes for 1996 are illustrated clearly in Table 2.7.
The "terms of trade" deteriorated in 1996 (-2.9%) for the European Union as a whole and in twelve of the Member States. The only rises were for Belgium, Denmark and Portugal.
Total intermediate consumption is made up of various inputs. The relative weights of four of the most important are shown in Table 2.8, together with changes in their volume, price and value. Analysis concentrates on these four.
Table 2.8 Changes in the volumes, prices and values of the main components of intermediate consumption for the European Union as a whole, in 1996 as compared to 1995 (in %)
Energy and lubricants
Fertilizers and soil improvers
Feedingstuffs
Material, tools and repairs
Intermediate consumption
Volume
1.3
1.3
0.0
0.1
0.9
Nominal price
7.5
4.6
4.6
3.9
3.8
Nominal value
8.9
5.9
4.7
4.0
4.8
Real price
4.6
2.1
2.0
1.6
1.4
Real value
6.0
3.4
2.1
1.7
2.3
Share in % of EUR 15 final output in "1995"
5.1
4.2
17.0
5.6
46.0
Animal feedingstuffs: higher price and unchanged volume
Animal feedingstuffs are the main component of intermediate consumption in most of the Member States. For the majority of them, prices increased in real terms. Among the various factors affecting feedingstuffs prices were the high cereal prices on the world market at the start of the year and higher soya bean prices. The consumption of feedingstuffs for the European Union as a whole remained at 1995 levels.
Fertilisers and soil improvers: higher price and volume
The use of fertilizers and soil improvers was slightly higher in volume terms in 1996 than in 1995. The greater use of fertilizers in 1996 is further evidence of the turn-about noted in 1994 from the downward trend observed in the previous six years. In part, this reflects the reduction in set-aside rates. The real prices of fertilizers rose in 1996 on average in the European Union although there were lower prices in some Member States.
Energy and lubricants: sharp price rise and greater volume
Agricultural income in the European Union in 1996 - Chapter 2
\m
eurostatMaterials and small tools, maintenance and repairs: higher price and unchanged volume
Purchases of materials and small tools, maintenance and repairs in 1996 remained unchanged in volume terms from levels in 1995. Most of the Member States showed little change. Real prices were higher or unchanged for most of the Member States, the exceptions being Luxembourg, Portugal and Finland.
Gross value added at market prices virtually unchanged
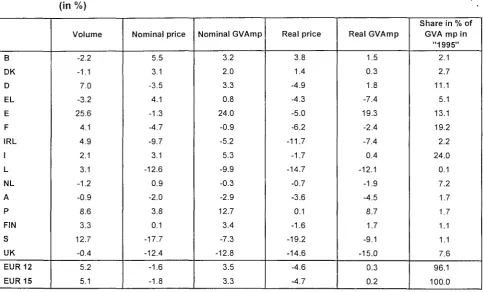
Although the value of intermediate consumption showed a percentage growth in real terms twice that of the real value of final output (+1.1%), the absolute changes in monetary terms were almost equal. This left gross value added at market prices (GVAmp) for 1996 virtually unchanged in real terms for the European Union as a whole compared to 1995.
The development of gross value added at market prices varied considerably between Member States (see Table 2.9). These changes essentially depended on the changes in final output and intermediate consumption, but also on the relative size of the two positions. The importance of intermediate consumption varies considerably from one country to another, depending on the main types of output and the degree of
[image:22.595.72.556.320.612.2]intensive production. Further details are given in Chapter 3 and in the annex tables.
Table 2.9 Changes in gross value added at market prices and its volume and price indices for the European Union as a whole and Member States, in 1996 as compared to 1995 (in %)
Β DK D EL E F IRL I L NL A Ρ FIN S UK EUR 12 EUR 15
Volume -2.2 -1.1 7.0 -3.2 25.6 4.1 4.9 2.1 3.1 -1.2 -0.9 8.6 3.3 12.7 -0.4 5.2 5.1
Nominal price 5.5 3.1 -3.5 4.1 -1.3 -4.7 -9.7 3.1 -12.6 0.9 -2.0 3.8 0.1 -17.7 -12.4 -1.6 -1.8
Nominal GVAmp 3.2 2.0 3.3 0.8 24.0 -0.9 -5.2 5.3 -9.9 -0.3 -2.9 12.7 3.4 -7.3 -12.8 3.5 3.3
Real price 3.8 1.4 -4.9 -4.3 -5.0 -6.2 -11.7 -1.7 -14.7 -0.7 -3.6 0.1 -1.6 -19.2 -14.6 -4.6 -4.7
Real GVAmp 1.5 0.3 1.8 -7.4 19.3 -2.4 -7.4 0.4 -12.1 -1.9 -4.5 8.7 1.7 -9.1 -15.0 0.3 0.2
Share in % of GVA mp in
"1995" 2.1 2.7 11.1 5.1 13.1 19.2 2.2 24.0 0.1 7.2 1.7 1.7 1.1 1.1 7.6 96.1 100.0
2.4 Distributive transactions
Operating subsidies: increase in real terms
The real terms value of operating subsidies received by the agricultural branch of the European Union12 increased by +2.8% in 1996. The level of subsidies in 1996 was noticeably higher than in 1995 for the Benelux countries, the UK and Ireland. The changes in the Benelux countries were partly due to effects related to currency exchange levels (agro-monetary compensation) and partly, as is the case for the UK and
[m
eurostat Agricultural income in the European Union in 1996 - Chapter 2
Ireland, related to compensation payments associated with BSE. The compensation payments and support measures related to the crisis in the cattle markets because of the BSE scare existed throughout the EU and had some effect in all Member States with significant cattle sectors, even if this was to reduce the fall in subsidy levels. Subsidies, due to their relative value as a part of income, had a considerable effect on the agricultural income indicators in many of the Member States (see Chapter 3).
Recording subsidies and measuring agricultural income
In any analysis of the trend in agricultural incomes, the procedure used for recording subsidies needs to be defined because of their increasing importance in the composition of agricultural income (some 25% of gross value added at market prices) and the need to ensure comparability with the agricultural income statistics of previous years.
The recording of subsidies in the Economic Accounts for Agriculture published by Eurostat is based on a payment criterion. Aid is included in the estimate of agricultural income for the calendar year in which it is actually paid, which does not necessarily correspond to the period in which the obligation was incurred. In practical terms this means that the value of subsidies that appears for a given calendar year will tend to consist of payments relating to two different marketing years. On average, it is expected that about 90% of aid (whether new or upgraded) in the European Union linked to the CAP reform and due for the 1996/97 marketing year will have been paid out in 1996. This proportion does though vary between the Member States. A small proportion of subsidies paid in 1996 came from the amounts due for the 1995/96 marketing year.
It should equally be underlined that the amount of subsidies recorded for 1996 is not readily comparable with that in the years prior to 1993, when the CAP reform came into effect. The big increase in the amount of subsidies recorded in the last four years mainly reflects the replacement of one part of price and market support by direct aid. The implementation of the CAP reform has entailed the payment of direct aid to compensate for the reduction in support prices and measures designed to control output, and the upgrading of existing aid.
Table 2.10 Nominal and real changes in subsidies, taxes linked to production and depreciation in the European Union as a whole and Member States, in 1996 as compared to 1995 (in %)
Β DK D EL E F IRL I L NL A Ρ FIN s UK EUR 12 EUR15
Subsidies Nominal
23.0 3.6 -2.8 12.2 -0.1 5.2 16.8 3.6 38.5 42.2 -7.2 -2.2 3.3 12.0 30.6 6.5 5.7
Real 20.9
1.8 -4.2 3.1 -3.8 3.5 14.2 -1.3 35.1 39.9 -8.8 -5.7 1.6 9.9 27.3 3.5 2.8
Taxes Nominal
7.2 1.0 4.9 1.4 117.6 -1.1 -15.3 5.0 63.8 3.8 7.1 8.9 -24.2 4.1 5.0 3.8 3.9
Real 5.4 -0.7 3.4 -6.8 109.5 -2.6 -17.2 0.1 59.8 2.2 5.3 5.0 -25.5 2.2 2.4 1.2 1.3
Depreciation Nominal
2.7 0.6 1.0 8.9 9.2 1.0 6.0 3.8 1.2 1.0 1.3 -1.1 -7.6 1.3 5.7 2.9 2.5
Agricultural income in the European Union in 1996 - Chapter 2 eurostat
m
Taxes linked to production: increase in real terms
For the first time since 1990, there was a recorded rise in taxes linked to production. Over the course of recent years, this item has been greatly affected by the dismantling of the co-responsibility levies on milk and cereals. The increase in 1996 had little effect on agricultural income, since taxes linked to production represented only 3.2% of gross value added at market prices in the European Union in "1995".
The balance of "net subsidies" (subsidies less taxes linked to production) for the European Union as a whole and all Member States bar the Netherlands is positive. The size of this positive balance widened in all but five of the Member States and in the Netherlands the negative balance was reduced still further. The inclusion of the changes for subsidies and taxes linked to production in the account led to a rise in gross value added at factor cost (GVAfc) of +0.8% in real terms (which compares to a +0.2% rise in GVAmp). Depreciation: barely a change in real value
The level of depreciation for the European Union in 1996 was almost unchanged from the previous year. This change, which was much weaker than the trend observed in other recent years (around -2% per year), can be explained by the rises in Spain and the United Kingdom and by only slight falls in Germany, France, Italy and the Netherlands.
Although depreciation accounted for 28.4% of gross value added at market prices in "1995", the minor change in this item for once barely affected the change in agricultural income for the European Union as .a whole; real net value added at factor cost (NVAfc) rose by +1.0% (compared to +0.8% for gross value added at factor cost). At Member State level, however, where the share of depreciation varies from about 7% of GVAmp in Greece to over 70% in the three new Member States, changes in depreciation in 1996 were often a very significant factor behind the change in income.
Rental payments: down slightly
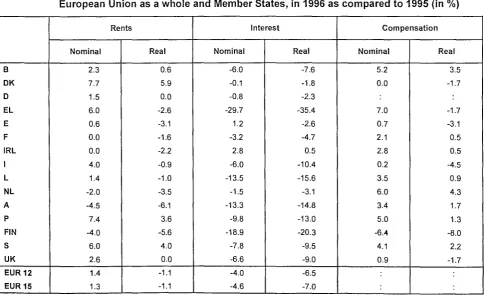
With about 45% of the value of rental payments in the European Union as a whole stemming from France and Spain, the falls in these two countries greatly influenced the slight decrease in real terms at the EUR 15 level. However, rents are of relatively minor importance in the European Union as a whole (accounting for 3.0%ofGVAmpin"1995").
Table 2.11 Nominal and real changes in rents, interest and compensation of employees for the European Union as a whole and Member States, in 1996 as compared to 1995 (in %)
Β DK D EL E F
IRL
I L NL A Ρ
FIN
S UK EUR 12 EUR 15
Rents Nominal
2.3 7.7 1.5 6.0 0.6 0.0 0.0 4.0 1.4 -2.0 -4.5 7.4 -4.0 6.0 2.6 1.4 1.3
Real 0.6 5.9 0.0 -2.6 -3.1 -1.6 -2.2 -0.9 -1.0 -3.5 -6.1 3.6 -5.6 4.0 0.0 -1.1 -1.1
Interest Nominal
-6.0 -0.1 -0.8 -29.7 1.2 -3.2 2.8 -6.0 -13.5 -1.5 -13.3 -9.8 -18.9 -7.8 -6.6 -4.0 -4.6
Real -7.6 -1.8 -2.3 -35.4 -2.6 -4.7 0.5 -10.4 -15.6 -3.1 -14.8 -13.0 -20.3 -9.5 -9.0 -6.5 -7.0
Compensation Nominal
5.2 0.0 7.0 0.7 2.1 2.8 0.2 3.5 6.0 3.4 5.0 -6.4 4.1 0.9
[image:24.595.75.560.488.783.2]Wh
eurostat Agricultural income in the European Union in 1996 - Chapter 2
Interest payments: down sharply
The sharp decline in interest payments for the European Union as whole mainly reflected lower interest rates. There were double digit rates of decline in real terms for six Member States, with falls in every country except Ireland where there was a small rise. With interest payments for EUR 15 accounting for 7.0% of GVAmp, the
sharp decline in 1996 further bolstered the increase in agricultural income; the measure of real net income
of total labour rose by +2.2% (compared to +1.0% for NVAfc).
Compensation of employees: slight reduction in real terms
Data on the compensation of employees have been unavailable for Germany on a comparable basis to those of other Member States since reunification. This means that Eurostat has been unable to derive an average change in this item or indeed the ensuing net income from family labour for EUR 15. However, for fourteen Member States of the European Union (EUR 15 without Germany), the costs of the compensation of employees fell in real terms by -1.5%. With the compensation of employees accounting for 11.6% of GVAmp for the European Union excluding Germany in "1995", this change further magnified the increase in
Wh
eurostat Agricultural income in the Member States in 1996 - Chapter 3
3 Changes in agricultural income in the Member States in 1996 over 1995
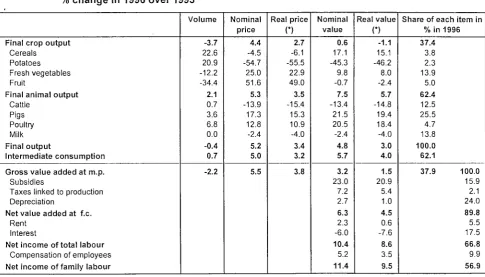
3.1 BelgiumAccording to current estimates, agricultural income in Belgium as measured by Indicator 1 rose strongly in 1996 (+7.5%), but remained well below the level seen in the reference year "1990". The main reasons for the increase in 1996 were greater subsidies and a sharp increase in the real value of final animal output resulting from both higher prices and volumes, although this was to some extent offset by an increase in the real value of intermediate consumption.
The real value of final crop output declined, the net result of a number of disparate developments for individual crops. There were substantial increases in the volumes of potato and cereal output, although as far as final crop output is concerned, these were insufficient to compensate for big declines in the volume of fruit and fresh vegetables. The prices of potatoes, cereals and fresh flowers (-4.1% in real terms) fell, while those of vegetables and fruit increased.
The real value of final animal output rose markedly compared with the previous year. The driving forces behind this rise were the much higher prices for pigs, poultry and eggs (+34.5% in real terms), during a period when their output volumes also increased. In terms of final animal output, these changes more than compensated for the fall in cattle and milk prices.
Price rises for energy, fertilizers and feedingstuffs (all about +4% to +5% in real terms), together with a slightly greater consumption of feedingstuffs, led to a notable increase in the real value of intermediate consumption.
Combining the changes in final output and total intermediate consumption resulted in real gross value added at market prices rising slightly. A considerable increase in subsidies compared with the year before, mainly as a result of payments related to the beef crisis and agri-monetary compensation, was the thrust behind the clear rise in real net value added at factor cost.
[image:27.595.51.537.514.791.2]Another reduction in the volume of total agricultural labour input (-2.8%) further bolstered the rise in the level of Indicator 1. Lower interest payments boosted the increase in the level of Indicator 2 still more (+11.7%). With the volume of family labour input declining (-3.1%) at a faster rate than for total labour, and despite a higher compensation of employees, the rise in the level of Indicator 3 (+13.0%) was greater than the other two Indicators.
Table 3.1 Changes in the main components of the income calculation for agriculture in Belgium, % change in 1996 over 1995
Final crop output
Cereals Potatoes Fresh vegetables Fruit
Final animal output
Cattle Pigs Poultry Milk
Final output
Intermediate consumption
Gross value added at m.p.
Subsidies
Taxes linked to production Depreciation
Net value added at f.c. Rent
Interest
Net income of total labour
Compensation of employees
Net income of family labour
Volume
-3.7 22.6 20.9 -12.2
-34.4
2.1 0.7 3.6 6.8 0.0 -0.4 0.7
-2.2
Nominal price
4.4 -4.5 -54.7 25.0
51.6
5.3 -13.9
17.3
12.8 -2.4 5.2 5.0
5.5
Real price
(*)
2.7 -6.1 -55.5 22.9 49.0 3.5 -15.4
15.3 10.9
-4.0 3.4 3.2
3.8
Nominal value
0.6
17.1
-45.3 9.8 -0.7 7.5 -13.4
21.5
20.5 -2.4 4.8 5.7
3.2 23.0 7.2 2.7 6.3
2.3
-6.0 10.4
5.2
11.4
Real value
(*)
-1.1
15.1
-46.2 8.0 -2.4 5.7 -14.8
19.4
18.4 -4.0 3.0 4.0
1.5 20.9
5.4
1.0 4.5 0.6 -7.6 8.6
3.5
9.5
Share of each item in %in
37.4 3.8
2.3 13.9
5.0 62.4
12.5 25.5
4.7 13.8 100.0 62.1
37.9 1996
100.0
15.9 2.1 24.0
89.8
5.5
17.5 66.8
9.9
56.9