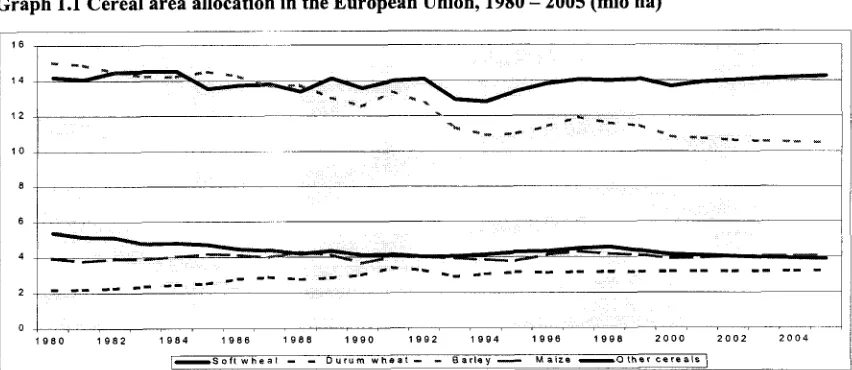
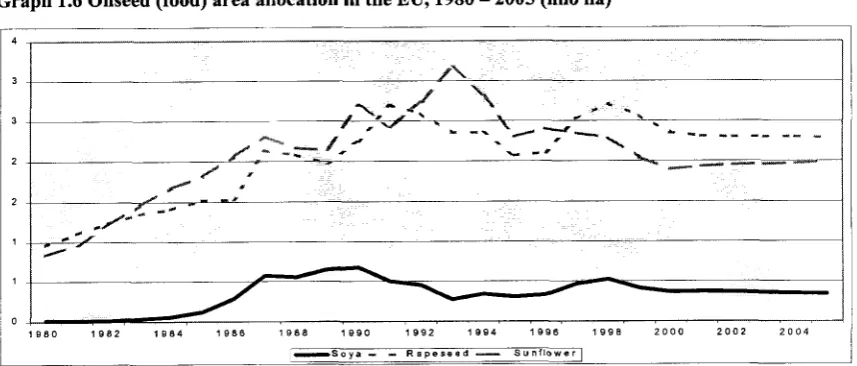
Prospects for agricultural markets 1998-2005. October 1998
Full text
Figure


Related documents
Having this understanding of what formerly incarcerated students need in terms of services, what obstacles they face, what services they are getting on other campuses, and how
We therefore use a questionnaire in which we ask the firms to indicate on a yearly basis what percentage of their exchange-rate exposure they hedged using derivatives
Going forward, electric power industry stakeholders who are interested in providing time- based rate program offerings to customers (e.g., utilities, regulators, vendors, and third
Serum concentrations of polychlorinated biphenyls (PCBs) and 1,1-bis-(4-chlorophenyl)-2,2- dichloroethene (DDE) in Michigan female anglers were serially measured between 1973 and
So, to analyze production efficiency across firms and over time, stochastic frontier production function model (with translog production function) is adopted in which non-negative
Eastern Maine Medical Center Registered Nurse Bangor ME. Eastern Maine Medical Center Registered Nurse Bangor
This paper explores some of the factors lying behind the rise in transport intensity, how it relates to trade and to changing activity patterns and the endogeneity of trans- port
Place a snail and 1/4-inch hex head nut in test tube F and securely plug the opening with a rubber stopper.. Wrap both test tubes with aluminum foil so they are not exposed
