nanostructures
.
White Rose Research Online URL for this paper:
http://eprints.whiterose.ac.uk/100455/
Version: Accepted Version
Article:
Beg, M, Albert, M, Bisotti, M-A et al. (9 more authors) (2017) Dynamics of skyrmionic
states in confined helimagnetic nanostructures. Physical Review B, 95 (1). 014433. ISSN
2469-9950
https://doi.org/10.1103/PhysRevB.95.014433
eprints@whiterose.ac.uk https://eprints.whiterose.ac.uk/ Reuse
Items deposited in White Rose Research Online are protected by copyright, with all rights reserved unless indicated otherwise. They may be downloaded and/or printed for private study, or other acts as permitted by national copyright laws. The publisher or other rights holders may allow further reproduction and re-use of the full text version. This is indicated by the licence information on the White Rose Research Online record for the item.
Takedown
If you consider content in White Rose Research Online to be in breach of UK law, please notify us by
Dynamics of skyrmionic states in confined helimagnetic nanostructures
Marijan Beg,1,∗ Maximilian Albert,1 Marc-Antonio Bisotti,1 David Cort´es-Ortu˜no,1 Weiwei Wang,1, 2 Rebecca Carey,1 Mark Vousden,1 Ondrej Hovorka,1 Chiara Ciccarelli,3 Charles S. Spencer,4 Christopher H. Marrows,4 and Hans Fangohr1,†
1
Faculty of Engineering and the Environment, University of Southampton, Southampton SO17 1BJ, United Kingdom 2
Department of Physics, Ningbo University, Ningbo, 315211, China 3
Cavendish Laboratory, University of Cambridge, Cambridge CB3 0HE, United Kingdom 4
School of Physics and Astronomy, University of Leeds, Leeds LS2 9JT, United Kingdom
In confined helimagnetic nanostructures, skyrmionic states in the form of incomplete and isolated skyrmion states can emerge as the ground state in absence of both external magnetic field and mag-netocrystalline anisotropy. In this work, we study the dynamic properties (resonance frequencies and corresponding eigenmodes) of skyrmionic states in thin film FeGe disk samples. We employ two different methods in finite-element based micromagnetic simulation: eigenvalue and ringdown method. The eigenvalue method allows us to identify all resonance frequencies and corresponding eigenmodes that can exist in the simulated system. However, using a particular experimentally fea-sible excitation can excite only a limited set of eigenmodes. Because of that, we perform ringdown simulations that resemble the experimental setup using both in-plane and out-of-plane excitations. In addition, we report the nonlinear dependence of resonance frequencies on the external magnetic bias field and disk sample diameter and discuss the possible reversal mode of skyrmionic states. We compare the power spectral densities of incomplete skyrmion and isolated skyrmion states and observe several key differences that can contribute to the experimental identification of the state present in the sample. We measure the FeGe Gilbert damping, and using its value we determine what eigenmodes can be expected to be observed in experiments. Finally, we show that neglecting the demagnetisation energy contribution or ignoring the magnetisation variation in the out-of-film direc-tion – although not changing the eigenmode’s magnetisadirec-tion dynamics significantly – changes their resonance frequencies substantially. Apart from contributing to the understanding of skyrmionic states physics, this systematic work can be used as a guide for the experimental identification of skyrmionic states in confined helimagnetic nanostructures.
I. INTRODUCTION
Dzyaloshinskii-Moriya interactions1,2 (DMI) may oc-cur in magnetic systems that lack some type of in-version symmetry. The inversion asymmetry can be present in the magnetic system either because of a non-centrosymmetric crystal lattice2 (helimagnetic material) or due to the interfaces between different materials which inherently lack inversion symmetry.3,4 Consequently, the DMI can be classified either as bulk or interfacial. The DMI favours magnetic moments at neighbouring lattice sites to be perpendicular to each other (in plane that is perpendicular to the Dzyaloshinskii vector), which is in contrast to the symmetric ferromagnetic exchange inter-action which tends to align them parallel. When acting together, these two interactions mutually compete and find a compromise in the twist between two neighbouring magnetic moments, which allows a rich variety of differ-ent magnetisation textures. One of them is a skyrmion configuration with very promising properties5–9 for the development of future high-density, power-efficient stor-age10,11 and logic12 devices.
After it was predicted13–15 that magnetic skyrmions can emerge in the presence of DMI, skyrmions were ob-served in magnetic systems with both bulk6,16–19 and in-terfacial5,7,20types of DMI. However, all studies of heli-magnetic (bulk DMI) materials required an external mag-netic field to be applied in order to stabilise skyrmions.
Recently, a systematic micromagnetic study21 reported all equilibrium states that can emerge in confined he-limagnetic nanostructures and identified the lowest en-ergy (ground) states. In particular, this study reported that in confined helimagnetic nanostructures two differ-ent skyrmionic states can emerge as the ground state in absence of both external magnetic field and magne-tocrystalline anisotropy. One state does not contain a complete spin rotation, whereas the other state contains one full spin rotation along the disk sample diameter, plus an additional magnetisation tilting at the bound-ary due to the specific boundbound-ary conditions.22 We refer to these configurations as incomplete skyrmion (iSk) and isolated skyrmion (Sk) states, respectively.21In addition, the same study showed that the higher-order target (T) state with two complete spin rotations along the disk sample diameter can emerge as a metastable state at zero external magnetic field.
Understanding the dynamic response of skyrmionic states in confined helimagnetic nanostructures is of im-portance both from the aspect of fundamental physics as well as for their manipulation. In this work, we explore the dynamics of all three equilibrium skyrmionic states using a full three-dimensional model which includes the demagnetisation energy contribution and does not as-sume the translational invariance of magnetisation in the out-of-film direction. A similar dynamics simulation study was performed for the isolated skyrmion
ing eigenmodes23 in confined two-dimensional samples with interfacial DMI; and high-frequency skyrmion spin excitations were analytically studied in thin cylindri-cal dots.24 The low-frequency (two lateral and one breathing) eigenmodes were reported in two-dimensional simulations of a hexagonal skyrmion lattice,25 where the demagnetisation energy was neglected. Later, mi-crowave absorption measurements explored the low fre-quency eigenmodes in Cu2OSeO3,26–28 Fe1−xCoxSi,28
and MnSi28 helimagnetic bulk samples. In the case of a magnetic bubble29–32 (magnetisation state stabilised due to the strong uniaxial anisotropy in the absence of DMI) analytic,33 simulation,34 and experimental35 studies reported the existence of two low frequency gy-rotropic eigenmodes, suggesting that the skyrmion pos-sesses mass. In contrast, a recent analytic work36 sug-gests that only one gyrotropic eigenmode exists in the confined DMI-induced skyrmion state, whereas another low-frequency lateral eigenmode is interpreted as an az-imuthal spin-wave mode36.
Using our full three-dimensional model, employing the eigenvalue37 method, we compute all existing (both lat-eral and breathing) eigenmodes below 50 GHz in three different skyrmionic states. In addition, using the ring-down38 method, we determine which eigenmodes can be excited using two different experimentally feasible excita-tions (in-plane and out-of-plane). In contrast to the mag-netic bubble, in the confined DMI stabilised skyrmionic states we find the existence of only one low frequency gyrotropic eigenmode. We also demonstrate the nonlin-ear dependence of eigenmode frequencies on the external magnetic bias field and the disk sample diameter, and show that the gyrotropic eigenmode might be the re-versal mode of skyrmionic states. After we identify all eigenmodes of incomplete skyrmion (iSk) and isolated skyrmion (Sk) ground states, we compare their power spectral densities (PSDs) in the same sample at different external magnetic field values. We discuss the compar-isons and observe several key differences that can con-tribute to the experimental identification of the state present in the studied sample. Although we base this study on the specific helimagnetic material FeGe, in order to make this study relevant to any helimagnetic material, we need to determine as many resonant frequencies as possible that can be detected using a specific excitation. Because of that, we need to reduce the linewidth and allow sufficient separation between peaks in the power spectral density (computed using the ringdown method). Consequently, in the first part of this work, we use the Gilbert damping23 α′ = 0.002. After we identify all
res-onance frequencies and corresponding eigenmodes using
α′, we experimentally measure the real value of FeGe
Gilbert damping and use it to determine which (out of all previously identified eigenmodes) can be experimen-tally detected in the FeGe sample. Finally, we investi-gate how the demagnetisation energy contribution and magnetisation variation in the out-of-film direction af-fect the dynamics of skyrmionic states. We report that
FIG. 1. (a) A thin film FeGe disk sample with 10 nm thick-ness and diameterd. An external magnetic bias fieldHis ap-plied uniformly and perpendicular to the sample (in the posi-tivezdirection). (b) A cardinal sine wave excitation magnetic fieldh(t), used in the ringdown method, is applied for 0.5 ns in either in-plane (ˆx) or out-of-plane (ˆz) direction. (c) The Fourier transform of excitation fieldh(t) shows that all eigen-modes (allowed by the used excitation direction) with fre-quencies lower thanfc= 100 GHz are excited approximately
equally.
although the eigenmode magnetisation dynamics is not significantly affected, the resonance frequencies change substantially, which indicates that ignoring the demag-netisation energy or modelling the thin film helimagnetic samples using two-dimensional meshes is not always jus-tified.
II. METHODS
We simulate a thin film helimagnetic cubic B20 FeGe disk with 10 nm thickness and diameterd, as shown in Fig. 1(a). The thin film sample is in the xy plane and perpendicular to the z axis. An external magnetic bias field H is applied uniformly and perpendicular to the
sample (in the positivezdirection).
The total energy of the system we simulate contains several energy contributions and can be written as
E=
Z
[wex+wdmi+wz+wd+wa] d3r. (1) The first term wex = A
(∇mx)2+ (∇my)2+ (∇mz)2
[image:3.612.318.560.50.323.2]
3 parameter A. The unit vector field m = m(r, t), with
Cartesian components mx, my, and mz, represents the
magnetisation field M(r, t) = Msm(r, t), where Ms is
the saturation magnetisation. The second termwdmi =
Dm·(∇ ×m) is the Dzyaloshinskii-Moriya energy
den-sity with material parameterD, which is obtained by in-cluding Lifshitz invariants suitable for materials of the crystallographic class T, such as the cubic B20 FeGe (P213 space group) used in this study. The coupling of magnetisation to an external magnetic fieldHis defined
by the Zeeman energy density termwz =−µ0MsH·m, with µ0 being the magnetic constant. The wd term is the demagnetisation (magnetostatic) energy density. Be-causewd is crucial for the stability of skyrmionic states in confined helimagnetic nanostructures,21we include its contribution in all subsequent simulations. The last term is the magnetocrystalline anisotropy energy density wa, and because it does not play an important role in the stability of skyrmionic states in the studied system,21we assume the simulated material is isotropic and neglect the magnetocrystalline anisotropy energy contribution. The FeGe material parameters we use are the following:21 saturation magnetisation Ms = 384 kA m−1, exchange energy constant A = 8.78 pJ m−1, and Dzyaloshinskii-Moriya energy constantD= 1.58 mJ m−2. In our model, we do not assume any translational invariance of mag-netisation in the out-of-film direction, which significantly changes the energy landscape both in infinitely large thin films39 and in confined thin film nanostructures.21 The relevant length scales in the simulated system are the exchange length lex =
p
2A/µ0Ms2 = 9.73 nm and he-lical length LD = 4πA/D = 70 nm. We choose the fi-nite element mesh discretisation so that the maximum spacing between two neighbouring mesh nodes is below
lmax = 3 nm, which is significantly smaller than the ex-change lengthlex.
The magnetisation dynamics is governed by the Landau-Lifshitz-Gilbert (LLG) equation40,41
∂m
∂t =−γ ∗
0m×Heff+αm×∂
m
∂t , (2)
where γ∗
0 =γ0(1 +α2), withγ0 = 2.21×10⁵m A−1s−1 and α ≥ 0 is the Gilbert damping. We compute the effective magnetic fieldHeff using
Heff=− 1
µ0Ms
δE[m]
δm , (3)
whereE[m] is the total magnetic energy functional, given
by Eq. (1). We validated the boundary conditions by run-ning a series of simulations and reproducing the results reported by Rohart and Thiaville22.
We implemented the presented model in the finite el-ement method framework and developed a micromag-netic simulation tool Finmag (successor of Nmag42). For the low-level finite element operations, we use FEniCS project43 and for the adaptive step time integration we use Sundials/CVODE solver.44,45 For visualisation, we use Matplotlib46 and ParaView.47
We study the dynamic properties of skyrmionic states using two different methods: eigenvalue method37 and ringdown method.38 In both eigenvalue and ringdown methods, we firstly compute an equilibrium magnetisa-tion configuramagnetisa-tionm0 by integrating a set of dissipative
time-dependent equations, starting from a specific ini-tial magnetisation configuration, until the condition of vanishing torque (m×Heff) is satisfied. The details on
selecting the initial magnetisation configurations can be found in Ref. 21. We perform all relaxations in this work down to the maximum precision limited by the unavoid-able numerical noise. Because the magnetisation dynam-ics is not of interest in the relaxation process, we set the Gilbert damping in this stage toα= 1.
We perform the eigenvalue method computations in a finite element framework, motivated by the analytic pro-cedure by d’Aquinoet al.37The perturbation of the sys-tem’s magnetisation from its equilibrium state m0 can
be written as m(t) = m0 +εv(t), where ε ∈ R+ and v(t)⊥m0 because of the imposed micromagnetic
condi-tion|m|= 1. If this perturbation expression is inserted
into the undamped LLG equation, we obtain
∂
∂t(m0+εv(t)) =−γ ∗
0(m0+εv(t))×Heff(m0+εv(t)). (4) By using a Taylor expansion Heff(m0+εv(t)) = H0+
εH′
eff(m0)·v(t) + O(ε2), where H0 = Heff(m0), and knowing that∂m0/∂t= 0 and m0×H0= 0, we get
∂
∂tv(t) =−γ ∗
0[v(t)×H0+m0×(H′eff(m0)·v(t))], (5) where allO(ε2) terms and higher are neglected. When the system is in its equilibrium, becauseHeff(m0)km0
and|m0|= 1, the equilibrium effective field can be
writ-ten asH0 =h0m0, where h0 =|H0|. Now, if all vector
fields are discretised on the finite elements mesh, Eq. (5) becomes
∂
∂tv(t) =γ ∗
0m0×[(h01−Heff′ (m0))·v(t)]. (6) Using the matrix Λ(m0) with propertym0×x= Λ(m0)· x, Eq. (6) can be written as
∂
∂tv(t) =A·v(t), (7)
where A =γ∗
0Λ(m0) [h01−H′eff(m0)]. This linear dif-ferential equation has a full set of solutions that can be expressed asv(t) = ˜vei2πf t, where ˜vis a constant vector
field. Using this ansatz, Eq. (7) becomes the eigenvalue problem
i2πfv˜=Av˜. (8)
We solve this eigenvalue problem using Python wrappers for the ARPACK48solvers which are implemented in the SciPy49,50package, which results in a set of resonant fre-quenciesf and eigenvectors ˜vfrom which we express the
In the ringdown method, similar to the eigenvalue method, we firstly relax the system to its equilibrium magnetisation statem0. After that, we perturb the
sys-tem from its equilibrium by applying a time-dependent
h(t) =hmaxsinc(2πfct)ˆe external magnetic field
excita-tion23,51 overt
exc= 0.5 ns, where hmax is the maximum excitation field value, fc = 100 GHz is the cut-off fre-quency, ˆe is the direction in which the excitation is
ap-plied, and sinc(2πfct) is the unnormalised cardinal sine function
sinc(2πfct) =
(sin(2πf
ct)
2πfct , fort6= 0
1, fort= 0. (9)
The time-dependence of the used excitationh(t) is shown in Fig. 1(b). Computing the Fourier transform of h(t) shows that using this excitation enables us to excite all eigenmodes (which are allowed by the direction of ex-citation ˆe) in the [0, fc] range approximately equally, as
demonstrated in Fig. 1(c). We compute thehmaxvalue so thatHf = 0.5 mT is the excitation amplitude at any
fre-quency.23More precisely, the maximum value of the car-dinal sine wave excitation ishmax= 2fctexcHf = 50 mT. We apply the excitation in two experimentally feasible directions: (i) in-plane ˆe= ˆxand (ii) out-of-plane ˆe= ˆz.
After the system is perturbed from its equilibrium state, we simulate the magnetisation dynamics fortsim= 20 ns and sample the magnetisation fieldm(ri, tj) at all mesh
nodes ri at uniform time steps tj = j∆t (∆t = 5 ps).
Although the excitation is sufficiently small so that the perturbation from the equilibrium state can be approxi-mated linearly, in order to make sure we do not introduce any nonlinearities to the system’s dynamics with the ex-citation, we delay sampling by 2 ns after the excitation field is removed.
Finally, we analyse the recorded magnetisation dy-namics m(ri, tj) using: (i) spatially averaged and (ii)
spatially resolved methods.52 We subtract the time-independent equilibrium magnetisation configuration
m0(ri) from the recorded magnetisation dynamics and
perform the Fourier analysis only on the time-dependent part ∆m(ri, tj) =m(ri, tj)−m0(ri). In the spatially
av-eraged analysis, we compute all three spatially avav-eraged magnetisation componentsh∆mk(tj)i, k=x, y, z, at all
time steps tj. After that, we apply a discrete Fourier
transform and sum the squared Fourier coefficient mod-uli (which are proportional to the power) to obtain the power spectral density (PSD):
Psa(f) = X
k=x,y,z
n X j=1
h∆mk(tj)ie−i2πf tj
2 , (10)
where n is the number of time steps at which the mag-netisation dynamics was sampled. On the other hand, in the spatially resolved analysis, we firstly compute the dis-crete Fourier transform at all mesh nodes (separately for all three magnetisation components) and then compute the PSD as the spatial average of the squared Fourier
coefficient moduli:38
Psr(f) = X
k=x,y,z
1 N N X i=1 n X j=1
mk(ri, tj)e−i2πf tj
2 , (11)
where N is the number of finite element mesh nodes. Because the power values in PSD are in arbitrary units (a.u.), we normalise all PSDs in this work so that
Rfmax
0 P(f) df = 1, where fmax = 50 GHz, and show them in the logarithmic scale. We choose to analyse dy-namics of skyrmionic states in the [0,50 GHz] range in or-der to avoid the presence of artefact peaks in PSDs due to aliasing53as a consequence of discrete time sampling lim-itations. Although, the frequency resolution in the eigen-value method is determined by the machine precision, the frequency resolution for the ringdown method is ∆f = (n∆t)−1 ≈ t
sim−1 = 0.05 GHz, where n = tsim/∆t+ 1 is the number of sampling points during the sampling simulation stage.
III. RESULTS
We study the dynamics of all three equilibrium skyrmionic states that can be observed at zero exter-nal magnetic field in confined thin film helimagnetic disk samples with diameters d ≤ 180 nm. More precisely, we explore the resonance frequencies and corresponding eigenmode magnetisation dynamics of the ground state incomplete skyrmion (iSk) and isolated skyrmion (Sk) states, as well as the metastable target (T) configura-tion. The difference between these states is in how many times the magnetisation configuration covers the sphere. A quantity that is usually used to determine whether a magnetisation configuration covers the sphere is the skyrmion number5 S. However, in confined helimag-netic nanostructures, an additional tilting of magnetisa-tion at the sample edges22in the winding direction oppo-site to the skyrmion configuration reduces the absolute skyrmion number value21,54. This does not allow us to determine what skyrmionic state is present is the sample because|S|<1 for all of them. To address this, a scalar value21 S
a in a three-dimensional sample is defined as
Sa= 1 8π Z m· ∂m ∂x × ∂m ∂y
d3r. (12) This scalar value has no mathematical or physical inter-pretation, and is defined merely to support the classifi-cation of skyrmionic states in confined nanostructures.
5 the resonance frequencies obtained from the eigenvalue
method. If the eigenvalue method resonance frequency coincides with a PSD peak, this implies that the corre-sponding eigenmode can be “activated” using a specific excitation and we mark it using a triangle (△) symbol. All other eigenmodes, that cannot be activated using a particular excitation, we mark with a circle (◦) symbol. Throughout this work, we study the magnetisation namics below 50 GHz. We analyse the target state dy-namics in Supplementary Section S1.
A. Incomplete skyrmion (iSk) state
The first magnetisation configuration that we study is the incomplete skyrmion (iSk) state. The magnetisation component mz of the iSk state, along the sample
diam-eter, does not cover the whole [−1,1] range, which is required for the skyrmion configuration to be present in the sample, and because of that, the scalar valueSa is in
the [0,1] range.21 In other works, this state is called ei-ther the quasi-ferromagnetic22,54or the edged vortex55,56 state. The incomplete skyrmion state is in an equilibrium for all studied disk sample diameters 40 nm≤d≤180 nm and at all external magnetic bias field values.21 We ex-plore the resonance frequencies and corresponding eigen-mode magnetisation dynamics in a 80 nm diameter disk sample at zero external magnetic field, where the iSk state is not only in an equilibrium, but is also the ground state21(global energy minimum).
Firstly, we compute all existing eigenmodes using the eigenvalue method and show the magnetisation dynamics of all identified eigenmodes in Supplementary Video 1, and their schematic representations in Supplementary Section S3. Then, we excite the system using an in-plane excitation and show the spatially averaged (SA) and spa-tially resolved (SR) power spectral densities (PSDs) over-laid with the eigenvalue method resonant frequencies in Figs. 2(a) and 2(b), respectively. In these two PSDs, we identify five peaks (A, D, E, F, and H) and schemati-cally represent their corresponding eigenmode magneti-sation dynamics in Fig. 2(e). The lowest frequency and the most dominant eigenmode A at 2.35 GHz consists of a dislocated incomplete skyrmion state core (where
mz = 1) revolving (gyrating) around its equilibrium
po-sition in the clockwise (CW) direction. Schematically, we represent the skyrmionic state core with a circle sym-bol, together with a directed loop if it gyrates around its equilibrium position. Consequently, we classify the eigenmode A as the gyrotropic (translational) mode. The eigenmode F at 23.04 GHz is the second most dominant eigenmode. Its magnetisation dynamics consists of a ring contour, defined by the constant magnetisationz compo-nent distribution, revolving around the sample centre in the counterclockwise (CCW) direction. This eigenmode is not gyrotropic because the iSk state core remains at its equilibrium position. The eigenmode H at 41.65 GHz, present in both SA and SR PSDs, is composed of the iSk
state core together with twomz contour rings revolving
in the CW direction. However, the inner contour revolves out-of-phase with respect to both the outer contour and the iSk state core. Because of that, we depict the inner contour ring using a dashed line and both the iSk state core loop and the outer contour ring using a solid line as a way of visualising the mutually out-of-phase dynam-ics. The eigenmode D is present only in the SR PSD at 13.83 GHz and consists of the iSk state core and a contour ring revolving in the CW direction, but mutually out-of-phase. So far, all identified eigenmodes are lateral, but in the SA PSD at 14.49 GHz, we also identify a very weak eigenmode E with radially symmetric magnetisation dy-namics. Although we expect that all eigenmodes present in the SA PSD are also present in the SR PSD, this is not the case for eigenmode E. We believe this is the case because this breathing eigenmode can be excited with an out-of-plane excitation, but emerges in simulations with an in-plane excitation due to the numerical noise, which is consistent with its small amplitude. This eigenmode, together with other breathing eigenmodes, will be dis-cussed subsequently when we excite the iSk state using an out-of-plane excitation.
Now, we perturb the incomplete skyrmion state from its equilibrium using an out-of-plane excitation and show the spatially averaged (SA) and spatially resolved (SR) power spectral densities (PSDs) in Figs. 2(c) and 2(d), respectively. Using this excitation, we identify five eigen-modes (A, B, C, E, and G) and schematically represent their magnetisation dynamics in Fig. 2(e). The most dominant eigenmode E is present in both SA and SR PSDs at 13.83 GHz. Its magnetisation dynamics consists of amz contour ring that shrinks and expands
period-ically, while the overall magnetisation configuration re-mains radially symmetric. Because of that, we classify this eigenmode as a breathing mode. The second most dominant eigenmode is the gyrotropic mode A, which was also observed when the system was excited using an in-plane excitation, suggesting that it can be experimen-tally detected independent of the used excitation direc-tion. The last eigenmode G present in both SA and SR PSDs at 32.37 GHz consists of two contour rings breath-ing mutually out-of-phase. More precisely, when one con-tour shrinks, another one expands, and vice versa. We schematically illustrate this out-of-phase breathing using dashed and solid lines depicting the contours. Finally, the eigenmodes B and C, visible only in the SR PSD at 2.57 GHz and 3.76 GHz, respectively, can be understood as a particular magnetisation configuration rotating in the sample in the CW direction without dislocating their core, as shown in Fig. 2(e).
FIG. 2. The power spectral densities (PSDs) of an incomplete skyrmion (iSk) ground state at zero external magnetic field in a 80 nm diameter FeGe disk sample with 10 nm thickness. (a) Spatially averaged and (b) spatially resolved PSDs for an in-plane excitation, together with overlaid resonance frequencies computed using the eigenvalue method. The resonant frequencies obtained using the eigenvalue method are marked with a triangle symbol (△) if they can be activated using a particular excitation and with a circle symbol (◦) otherwise. (c) Spatially averaged and (d) spatially resolved PSDs for an out-of-plane excitation. (e) Schematic representations of magnetisation dynamics associated with the identified eigenmodes. Schematically, we represent the skyrmionic state core with a circle symbol, together with a directed loop if it gyrates around its equilibrium position. Contour rings represented using dashed lines revolve/breathe out-of-phase with respect to the those marked with solid lines. The magnetisation dynamics animations of all identified eigenmodes are provided in Supplementary Video 1.
10 mT. More precisely, we start atµ0H = 1.2 T initialis-ing the system usinitialis-ing incomplete skyrmion configuration with positive core orientation iSk↑, relax the system to its equilibrium, and then run both eigenvalue and ring-down simulations. After that, we reduce the external magnetic field by 10 mT, relax the system to its equi-librium using the relaxed (equiequi-librium) state from the previous simulation as initial configuration, and run dy-namics simulations. We iterate until we reach −0.5 T. We show the resultingH-dependent power spectral den-sity (PSD) maps for an in-plane and an out-of-plane ex-citation in Figs. 3(a) and 3(b), respectively. In theseH -dependent PSD maps, a discontinuity in resonance fre-quencies at−0.26 T is evident. This is the case because ford= 80 nm and−0.26 T≤µ0H ≤1.2 T, the iSk state
with positive (mz = 1) core orientation (iSk↑) is in an
equilibrium. However, for µ0H < −0.26 T, the iSk↑ is not in an equilibrium anymore and the iSk state reverses its orientation to the negative (mz=−1) direction (iSk↓)
[image:7.612.68.546.47.420.2]fre-7
FIG. 3. Power spectral density (PSD) maps showing the dependence of incomplete skyrmion (iSk) state resonant frequencies on the external magnetic bias field changed between−0.5 T and 1.2 T in steps of 10 mT ford= 80 nm when the system is excited using (a) in-plane and (b) out-of-plane excitation. The dependence of resonance frequencies on the disk sample diameter varied between 40 nm and 180 nm in steps of 2 nm at zero external magnetic field for (c) in-plane and (d) out-of-plane excitation. We show two plots for every PSD map: one for the complete studied frequency range (0−50 GHz) and another plot in order to better resolve the low-frequency (0−10 GHz) part of the PSD map.
quency range (0−50 GHz) and another plot in order to better resolve the low-frequency (0−10 GHz) part of the PSD map.
In the case of an in-plane excitation, three lateral eigenmodes (A, D, and F) are visible in theH-dependent PSD map, shown in Fig. 3(a), and in the iSk↑ range their frequencies nonlinearly and monotonically increase with H. Eigenmodes D and F are not as dominant as
[image:8.612.69.548.48.531.2]C have very similar frequencies which makes it difficult for experimentalists to determine which eigenmode the resonance frequency they measure belongs to. From the out-of-planeH-dependent PSD map in Fig. 3(b), we ob-serve that this difficulty can be resolved by reducing the external magnetic field towards the switching field. More precisely, the frequencies of eigenmodes A and B both de-crease, but only the frequency of eigenmode A approaches zero. On the contrary, the frequency of eigenmode C increases by reducing H. Also, the separation between A, B, and C peaks in the PSD increases, by either in-creasing or dein-creasing external magnetic field value. We show the dependence of their frequencies at high exter-nal magnetic fields in Supplementary Section S2 using the eigenvalue method and demonstrate that no eigenmode crossing occurs. In addition, as we previously discussed, by changing the excitation to an in-plane direction, only eigenmode A would be present. The eigenmodes E and G are visible in the whole examined range ofH, and their frequencies increase nonlinearly and monotonically with external magnetic bias field. Interestingly, the frequency of eigenmode A approaches zero near the switching field
µ0Hs =−0.26 T, suggesting that this gyrotropic eigen-mode might be the reversal (zero) eigen-mode of the incomplete skyrmion state in the studied sample.
By varying the disk sample diameterd, for an in-plane excitation, we observe the gyrotropic eigenmode A fre-quency increasing between 40 nm and 64 nm (where it reaches its maximum), and then decreasing with d, as shown in Fig. 3(c). Another visible eigenmode in the PSD map above approximately 74 nm, for an in-plane excitation, is the eigenmode F whose frequency mono-tonically decreases withd. In the case of an out-of-plane excitation, we identify seven (A, B, C, E, G, X1, and X2) eigenmodes in the PSD map shown in Fig. 3(d). The magnetisation dynamics of all these eigenmodes was dis-cussed before, except X1 and X2, because they were not present in the PSDs below the maximum studied fre-quency 50 GHz for d = 80 nm. The eigenmode A fre-quency dependence is the same as for an in-plane excita-tion and another six eigenmodes (B, C, E, G, X1, and X2) frequencies monotonically decrease with the disk sample diameter.
B. Isolated skyrmion (Sk) state
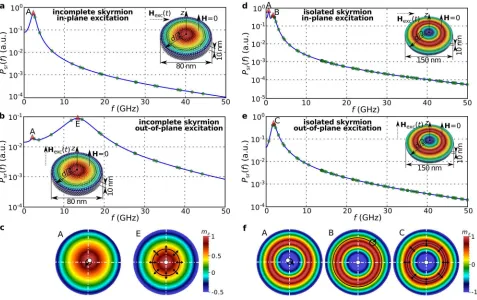
In this section, we explore the dynamics of an isolated skyrmion (Sk) state, for which the magnetisationz com-ponent covers the [−1,1] range once (plus the additional magnetisation tilting at the boundaries due to the spe-cific boundary conditions22) along the disk sample diam-eter, and consequently, the scalar valueSais in the [1,2] range.21The Sk state is in an equilibrium21ford≥70 nm andµ0H≤1.1 T. We study the Sk state dynamics for a 150 nm diameter disk sample at zero external magnetic bias field, where the Sk state is not only in an equilib-rium, but is also the ground state.21
After we perform the eigenvalue method computations, we excite the system using an in-plane excitation and show the spatially averaged (SA) and spatially resolved (SR) power spectral densities (PSDs) in Figs. 4(a) and 4(b), respectively. The magnetisation dynamics of all ex-isting eigenmodes computed using the eigenvalue method are shown in Supplementary Videos 2 and 3, and their schematic representations in Supplementary Section S3. In both SA and SR PSDs, we identify nine peaks (eigen-modes A, B, D, E, G, I, J, L, and M), and show their schematic representations in Fig. 4(e). The lowest fre-quency eigenmode at 0.67 GHz is the gyrotropic eigen-mode A. Its magnetisation dynamics consists of a dislo-cated Sk state core (where mz = −1) gyrating around
its equilibrium position in the CCW direction. In both PSDs, the eigenmode B at 1.91 GHz is the most dominant one, and consists of a contour ring (defined as a constant magnetisationzcomponent distribution) revolving in the CW direction. The eigenmode D at 7.61 GHz is com-posed of both the Sk state core and a magnetisation con-tour ring revolving in the CCW direction, but mutually out-of-phase. At 14.54 GHz, we identify an eigenmode E with two magnetisation contour rings revolving mutually out-of-phase in the CW direction. Similarly, the eigen-mode G at 18.89 GHz also consists of two contour rings revolving mutually out-of-phase, but now in the CCW direction. The four remaining eigenmodes (I, J, L, and M) are significantly weaker in both PSDs when compared to the power of previously discussed eigenmodes. Their magnetisation dynamics, shown in Fig. 4(e), are all lat-eral and contain different combinations of revolving con-tour rings and revolving Sk state core.
Now, we change the excitation to be in the out-of-plane direction. The computed spatially averaged and spatially resolved power spectral densities, overlaid with the resonance frequencies obtained from the eigenvalue method, are shown in Figs. 4(c) and 4(d), respectively. In this case, we observe five peaks (eigenmodes A, C, F, H, and K) in both PSDs, and a significantly weaker lateral eigenmode G (previously discussed) in SA PSD. We show the schematic representation of their magneti-sation dynamics in Fig. 4(e). Similar to the incomplete skyrmion state, the gyrotropic eigenmode A can also be activated with an out-of-plane excitation. The lowest fre-quency breathing eigenmode C at 2.00 GHz consists of a single contour ring that shrinks and expands periodically. An eigenmode F at 16.12 GHz is composed of two con-tour rings breathing mutually out-of-phase. Similar to the eigenmode C, the eigenmode H at 25.22 GHz consists of a single breathing contour, but now with a smaller contour diameter (smallermz). At 39.25 GHz, we
iden-tify the highest frequency breathing eigenmode K in the studied frequency range, which contains three breathing contours, where the inner and the outer contours breathe out-of-phase with respect to the middle one.
9
FIG. 4. The power spectral densities (PSDs) of an isolated skyrmion (Sk) ground state in a 150 nm diameter FeGe disk sample with 10 nm thickness at zero external magnetic bias field. (a) Spatially averaged and (b) spatially resolved PSDs for an in-plane excitation, together with overlaid resonance frequencies computed using the eigenvalue method. The resonant frequencies obtained using the eigenvalue method are marked with a triangle symbol (△) if they can be activated using a particular excitation and with a circle symbol (◦) otherwise. (c) Spatially averaged and (d) spatially resolved PSDs computed when the Sk state is perturbed from its equilibrium with an out-of-plane excitation. (e) Schematic representations of magnetisation dynamics associated with the identified eigenmodes. Schematically, we represent the skyrmionic state core with a circle symbol, together with a directed loop if it gyrates around its equilibrium position. Contour rings represented using dashed lines revolve/breathe out-of-phase with respect to the those marked with solid lines. The magnetisation dynamics animations of all identified eigenmodes are provided in Supplementary Videos 2 and 3.
sample diameter and external magnetic field. We com-pute theH-dependent PSD map in two parts in order to obtain how the resonance frequencies change in the entire range of external magnetic field values where the isolated skyrmion state with negative core orientation (Sk↓) is in equilibrium. More precisely, the system initialised with Sk↓ at high external magnetic fields relaxes to the in-complete skyrmion state with positive core orientation21 iSk↑. Consequently, if we keep reducing H and use the equilibrium state from previous simulation iteration as initial state, we could not reach the Sk↓ state. There-fore, we firstly fix the disk sample diameter to 150 nm, setH = 0, initialise the system using Sk↓ configuration, relax the system, and run dynamics simulations. Then
we increase the external magnetic field by 10 mT using the equilibrium state from previous simulation as the ini-tial state at new value of external magnetic field. We iterate this until we reach 1.2 T. Similarly, starting from zero external magnetic field, we reduceµ0H in steps of 10 mT, untilµ0H =−0.5 T is reached. We show the H -dependent PSD maps for an in-plane and an out-of-plane excitation in Fig. 5(a) and 5(b), respectively. In these PSD maps, two discontinuities in resonant frequencies at−0.24 T and 1.12 T are present. The first discontinu-ity occurs because decreasingH causes the Sk state core with negative (mz =−1) orientation (Sk↓) to switch to
the positive (mz = 1) direction (Sk↑) at the switching
[image:10.612.67.547.46.421.2]discon-FIG. 5. Power spectral density (PSD) maps showing the dependence of isolated skyrmion (Sk) state resonant frequencies on the external magnetic bias field changed between−0.5 T and 1.2 T in steps of 10 mT ford= 150 nm when the system is excited using (a) in-plane and (b) out-of-plane excitation. The dependence of resonance frequencies on the disk sample diameter varied between 40 nm and 180 nm in steps of 2 nm at zero external magnetic field for (c) in-plane and (d) out-of-plane excitation. We show two plots for every PSD map: one for the complete studied frequency range (0−50 GHz) and another plot in order to better resolve the low-frequency (0−10 GHz) part of the PSD map.
tinuity at 1.12 T occurs because, above this value, the Sk↓is not in an equilibrium anymore and the system re-laxes to the incomplete skyrmion state with positive core orientation (iSk↑). Secondly, at H = 0, we vary d be-tween 40 nm and 180 nm in steps of 2 nm and show the
d-dependent PSD maps in Figs. 5(c) and 5(d) for an in-plane and an out-of-in-plane excitation, respectively. Now,
[image:11.612.67.553.45.542.2]11
FIG. 6. Comparisons of power spectral densities (PSDs) of ground incomplete skyrmion (iSk) state (solid red line) and metastable isolated skyrmion (Sk) state (dashed blue line) in a 100 nm disk sample with 10 nm thickness at different values of external magnetic fieldH, computed for an in-plane (left column) and an out-of-plane (right column) excitation.
For an in-plane excitation, in the H-dependent PSD map, shown in Fig. 5(a), five previously discussed eigen-modes (A, B, D, E, and G) are visible in the H range where the Sk↓ state is in an equilibrium. The frequency of gyrotropic eigenmode A firstly increases, reaches its maximum at approximately 0.15 T, and then decreases down to its minimum at approximately 0.9 T, after which it keeps increasing with H. In comparison to the other eigenmodes, its frequency varies over a much smaller range (less than 1 GHz) over the entireHrange where the Sk↓state is in an equilibrium. Similar to the incomplete skyrmion state, the frequency of gyrotropic eigenmode A approaches zero near the switching fieldµ0Hs=−0.24 T, suggesting that this eigenmode might govern the iso-lated skyrmion reversal process. The eigenmode B
fre-quency increases approximately linearly up to 0.6 T, after which it continues increasing nonlinearly. The frequency of eigenmode D, firstly decreases, reaches its minimum at approximately 0.22 T, and then continues increasing nonlinearly with H. The frequencies of eigenmodes E and G exhibit more complicated behaviour where two extremes (maximum and minimum) are present in their
local maximum and minimum in theirH-dependences. In thed-dependent PSD map, shown in Fig. 5(c), ob-tained when an in-plane excitation is used, five previously discussed eigenmodes (A, B, D, E, and G) are present. In contrast to the frequencies of eigenmodes D, E, and G that monotonically decrease withdover a wide range of frequencies, the eigenmodes A and B frequencies vary in a much smaller (less than 1 GHz) range over entire stud-ieddrange. Eigenmodes D, E, and G become invisible in the PSD map below approximately 120 nm. In Fig. 5(d), we show the d-dependent PSD map for an out-of-plane excitation, where five eigenmodes (A, C, F, H, and J) are visible. Similar to the eigenmodes A and B, the lowest frequency breathing eigenmode frequency changes over a much smaller range than the frequencies of eigenmodes F, H, and J, when the disk sample diameter is changed.
C. Comparison of incomplete skyrmion and isolated skyrmion power spectral densities
One of the challenges in the study of skyrmionic states in confined helimagnetic nanostructures is the detection of what state emerged in the studied sample. In this subsection we discuss how measuring resonance frequen-cies can contribute to the identification of the emerged state. Previously, in Sections III A and III B, we studied the dynamics of both incomplete skyrmion (iSk) and iso-lated skyrmion (Sk) states in disk samples with diameters for which these states were the ground states. Now, we compare the power spectral densities (PSDs) of iSk and Sk states in a 100 nm diameter disk sample with 10 nm thickness at different external magnetic field valuesµ0H (between 0 T and 1 T in steps of 0.25 T). In this sample size and at all simulated external magnetic field values, both iSk and Sk states are in equilibrium. More specifi-cally, the Sk state is metastable and the iSk state is the ground state.21We show the comparison of spatially re-solved iSk and Sk PSDs at different external magnetic field values for an in-plane and an out-of-plane excita-tion in Fig. 6. Because in a 100 nm diameter disk sample there are no dominant iSk and Sk eigenmodes that can be easily detected in experiments above 30 GHz, we now limit our discussion of PSDs below 30 GHz in order to better resolve the key differences, that can contribute to the identification of the present state.
Firstly, in the case of an in-plane excitation (left col-umn in Fig. 6), the frequency of iSk gyrotropic eigen-mode A (the lowest frequency iSk eigeneigen-mode), increases with H. On the contrary, the Sk gyrotropic eigenmode A (again the lowest frequency Sk eigenmode) frequency remains approximately the same. Furthermore, by in-creasing the external magnetic field the Sk eigenmode B frequency increases, and consequently, the frequency difference between two lowest frequency Sk eigenmodes ∆ABincreases in a wide range of frequencies. In contrast, the frequencies of two lowest frequency iSk eigenmodes A and D both increase with H, so that the frequency
difference ∆ADbetween them changes over a small range of frequencies (remains approximately the same). How-ever, at low values of external magnetic field, it could be difficult to measure the iSk eigenmode D due to its rela-tively small amplitude. In that case, between 0.25 T and 0.75 T, the frequency of dominant iSk eigenmode F does not change, so the ∆AF= ∆AD+ ∆DFdifference reduces withH for about 5 GHz.
When we excite the system using an out-of-plane ex-citation (right column in Fig. 6), atH = 0, several res-onance frequencies below 5 GHz are present, which does not allow a clear identification of the emerged state by measuring resonance frequencies in that region. How-ever, by increasing the external magnetic field, the low frequency part of PSDs simplifies. More specifically, the Sk eigenmode A frequency again does not change, while the Sk breathing eigenmode C, and therefore the dif-ference ∆AC, increase with H. In addition, for a Sk state above 0.25 T, the frequency of eigenmode F re-mains approximately the same, and therefore, the dif-ference ∆CF decreases with H. On the contrary, iSk
eigenmodes A, B, and C disappear from the PSD after
µ0H = 0.5 T, whereas the frequency difference ∆EG be-tween two most dominant iSk eigenmodes E and G re-mains approximately the same, since their frequencies both increase.
The dependences of resonant frequencies in this sample withd= 100 nm are in a good agreement with the PSD maps shown in Fig. 3(a) and Fig. 5(a) and eigenvalue computed results in Supplementary Section S2. This sug-gests that these identification differences can probably be applied to different sample sizes. Atµ0H = 1 T, we ap-proach the transition from Sk to iSk state and additional peaks in Sk state PSDs, shown in Fig. 6, occur.
D. Simulations with real FeGe damping
In the previous analysis of skyrmionic states dynamics, we intentionally used the small Gilbert damping value
α′= 0.002 as used in other eigenmode studies,23in order to allow enough separation between peaks in the power spectral densities (enabled by the reduced linewidth) and identify all eigenmodes that can be excited using a par-ticular experimentally feasible excitation. However, in experiments, which eigenmodes can be observed strongly depends on the real value of Gilbert damping. Therefore, in this section, we measure the FeGe Gilbert damping valueαand repeat our simulations in order to determine what eigenmodes are expected to be experimentally ob-served in helimagnetic FeGe confined nanostructures.
polyno-13
FIG. 7. The linewidth ∆H (half width at half maximum) measurement points at different resonance frequenciesf for a FeGe thin film, together with a first degree polynomial fit from which the Gilbert damping was extracted.
mial fit allows us to decompose the ∆Hdependence into a frequency independent inhomogeneously-broadened com-ponent ∆H0and an intrinsic damping-related part:59–61
∆H = ∆H0+
αf
γ , (13)
whereαis the Gilbert damping andγis the gyromagnetic ratio. From the slope of the polynomial fit and using the frequency-dependent term that reflects the “viscous” damping of the precessive magnetisation motion associ-ated with the FMR, we findα= 0.28±0.02.
Now, we use the measured α = 0.28 and repeat the ringdown simulations for the two skyrmionic ground states that can exist in the studied system. We show the spatially resolved power spectral density of an incomplete skyrmion state in a 80 nm diameter disk sample at zero external magnetic bias field for an in-plane and an out-of-plane excitation in Figs. 8(a) and 8(b), respectively. We observe that, when the system is excited using an in-plane excitation, only the gyrotropic eigenmode A is present in the PSD. On the other hand, for an out-of-plane excitation, we identify two eigenmodes in the PSD shown in Fig. 8(b). The first one is the gyrotropic eigen-mode A, which is also present in the in-plane PSD, and another one is the lowest frequency breathing eigenmode E. The PSDs of the isolated skyrmion state in a 150 nm diameter disk sample at zero external magnetic bias field are shown in Figs. 8(c) and 8(d) for an in-plane and an out-of-plane excitation, respectively. Now, only the three lowest frequency isolated skyrmion eigenmodes are present. The gyrotropic eigenmode A and eigenmode B can be identified when the system is excited using an in-plane excitation. On the other hand, for the out-of-in-plane excitation, only the breathing eigenmode C is present.
E. Demagnetisation energy and out-of-plane magnetisation variation effects
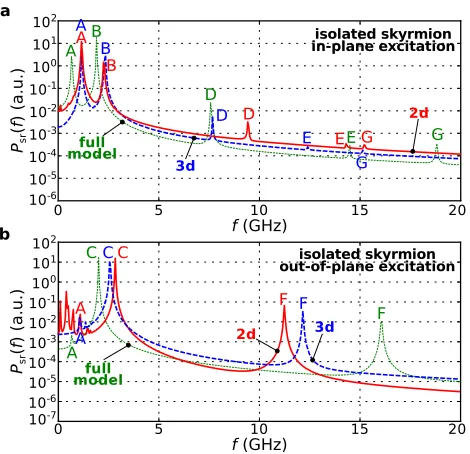
Usually, in the simulations of skyrmionic states dy-namics in helimagnetic samples, for simplicity, the de-magnetisation energy contribution is neglected and/or a helimagnetic thin film sample is modelled using a two-dimensional mesh. It has been shown that the demag-netisation energy contribution21 and the magnetisation variation in the out-of-film direction21,39radically change the energy landscape. Consequently, using these assump-tions when the static properties of skyrmionic states are explored is not justified. Because of that, in this sec-tion, we investigate how these two assumptions affect the dynamics of the isolated skyrmion (Sk) state in studied helimagnetic nanostructure. Firstly, we repeat the iso-lated skyrmion state simulations in a 150 nm diameter disk sample at zero external magnetic bias field, but this time we set the demagnetisation energy contributionwd in Eq. (1) artificially to zero. Secondly, again in the ab-sence of demagnetisation energy contribution, we simu-late the Sk state dynamics under the same conditions, but this time using a two-dimensional mesh to model a thin film sample (i.e. not allowing the magnetisation variation in the out-of-film direction). We show the com-parison of power spectral densities computed using three-dimensional and two-three-dimensional models in absence of demagnetisation energy contribution with the one com-puted using a full model in Figs. 9(a) and 9(b), for an in-plane and an out-of-plane excitations, respectively.
We observe that although the magnetisation dynam-ics of identified eigenmodes do not change significantly, the resonance frequencies of some eigenmodes change substantially. In the 3D simulations in absence of de-magnetisation energy, while the frequency of eigenmode D remains approximately the same, the frequencies of eigenmodes A and B increase by 71% and 18%, respec-tively. On the other hand, the frequencies of eigenmodes E and G decrease by 14% and 21%, respectively. Further-more, power spectral densities in Fig. 9(b), computed for the out-of-plane excitation, show that the frequency of breathing eigenmode C increases by 17%, whereas the frequency of eigenmode F decreases by 34%.
If the thin film sample is modelled using a 2D mesh, which does not allow the magnetisation to vary in the
theo-FIG. 8. The spatially resolved power spectral densities (PSDs) of an incomplete skyrmion state in a 80 nm diameter FeGe disk sample with 10 nm thickness at zero external magnetic bias field for (a) in-plane and (b) out-of-plane excitation direction. The isolated skyrmion state in a 150 nm diameter thin film disk with 10 nm thickness at H = 0 when the system is excited with (c) in-plane and (d) out-of-plane excitation. The PSDs are computed using the experimentally measured value of FeGe Gilbert dampingα= 0.28.
retically less eigenmodes in a two-dimesional sample (the number of existing eigenmodes equals to the number of degrees of freedom in the system), we do not know at what frequencies they will occur. We believe the rea-son for this is that although the state is the same, its dynamics quilitatively changes at low frequencies due to the missing thickness dimension. We also observe eigen-modes computed using the eigenvalue method that agree with the peaks in PSD shown in Fig. 9(b).
IV. DISCUSSION AND CONCLUSION
Using the eigenvalue method, we computed all eigen-modes with frequencies below 50 GHz for the incomplete skyrmion, isolated skyrmion, and target states in heli-magnetic thin film disk samples at zero external mag-netic field. Because which eigenmodes are present in the power spectral density strongly depends on the ex-citation used to perturb the system from its equilib-rium state, we performed the ringdown simulations us-ing two different experimentally feasible excitations (in-plane and out-of-(in-plane). We demonstrated that in all three simulated states, two lateral and one breathing
low-frequency eigenmodes exist, as previously demonstrated in two-dimensional skyrmion lattice simulations25 and microwave absorption measurements in bulk helimag-netic materials26–28. However, only one lateral eigen-mode is gyrotropic, with the skyrmionic state core gy-rating around its equilibrium position. The other lateral eigenmode we observed is not gyrotropic because it con-sists of a single contour ring (defined by the magneti-sation z component distribution) revolving around the static skyrmionic state core. The existence of only one gyrotropic eigenmode is in accordance with the recent analytic (rigid skyrmion two-dimensional model) find-ings by Guslienko and Gareeva,36 but in contrast to magnetic bubbles where two gyrotropic eigenmodes were found.33–35Because the two gyrotropic eigenmodes with opposite gyration direction in a magnetic bubble imply it possesses mass, our findings suggest that the confined DMI-induced skyrmionic states in the studied system are massless. The low-frequency breathing eigenmode we ob-serve, where a single magnetisationzcomponent contour ring shrinks and expands periodically, is in accordance with findings in Ref. 23, 25–28, 62, and 63.
[image:15.612.72.549.52.352.2]15
FIG. 9. The comparison of power spectral densities com-puted using three-dimensional and two-dimensional models in absence of demagnetisation energy contribution with the PSD obtained using a full simulation model for an isolated skyrmion state in the case of (a) in-plane and (b) out-of-plane excitation. Simulated sample is a 150 nm diameter disk with 10 nm thickness at zero external magnetic field.
nonlinearly on both the disk sample diameter and the external magnetic bias field. We observed that the fre-quency of the gyrotropic eigenmode approaches zero near the switching fieldHs (where the reversal of skyrmionic state core occurs) for both incomplete skyrmion and iso-lated skyrmion states, suggesting that this eigenmode might be the reversal mode of studied skyrmionic states. We find that when the skyrmionic state core orientation reverses, the revolving direction of all lateral eigenmodes changes, which confirms that the revolving direction de-pends on the direction of the gyrovector as shown in Ref. 25 and 36.
After we identified all existing eigenmodes of iSk and Sk ground states, we compared their PSDs in the same sample at different external magnetic field values. We identified several characteristics that can contribute to the experimental identification of the state that emerged in the sample by measuring the resonance frequencies.
In the identification and analysis of eigenmodes, we used a small Gilbert damping value in order to provide enough separation between peaks in the PSD. However, which eigenmodes are expected to be observed in ex-periments strongly depends on the real Gilbert damp-ing valueα. Therefore we measuredαin the FeGe thin film, and carried out ringdown simulations with this α. We showed that for the incomplete skyrmion, two
eigen-modes (gyrotropic and breathing) are present in the PSD computed using an out-of-plane excitation, whereas only the gyrotropic eigenmode is present in the PSD computed using an in-plane excitation. In the isolated skyrmion case, two lateral eigenmodes are present in the PSD obtained using an in-plane excitation, whereas a single breathing eigenmode is present in the PSD computed af-ter using the out-of-plane excitation.
Our simulations took into account the demagnetisation energy contribution, which is usually neglected for sim-plicity in both analytic and simulation works. To explore the importance of model assumptions, we carried out fur-ther systematic simulation studies in which we set the demagnetisation energy contribution artificially to zero. We also repeated the simulations under the same condi-tions on 3D and 2D meshes (with and without permissi-ble magnetisation variation in the out-of-film direction, respectively). We found that although the magnetisation dynamics of eigenmodes does not change significantly, their frequencies change substantially. This suggests that ignoring the demagnetisation energy contribution or ap-proximating a thin film helimagnetic sample using a two-dimensional mesh is not always justified.
This work provides a systematic dynamics study of skyrmionic states in confined helimagnetic nanostruc-tures. We report all eigenmodes present in the sample as well as which eigenmodes can be observed using par-ticular experimentally feasible excitations. Apart from contributing to fundamental physics, this work could sup-port experimentalists to determine what magnetisation configuration is present in the confined helimagnetic sam-ple by measuring ferromagnetic resonance spectra.
All data supporting this study are openly avail-able from the University of Southampton repository at http://doi.org/10.5258/SOTON/403976.
ACKNOWLEDGMENTS
∗ m.beg@soton.ac.uk
† h.fangohr@soton.ac.uk
1
I. Dzyaloshinsky, J. Phys. Chem. Solids4, 241 (1958).
2
T. Moriya, Phys. Rev.120, 91 (1960).
3
A. Fert and P. M. Levy, Phys. Rev. Lett.44, 1538 (1980).
4
A. Cr´epieux and C. Lacroix, J. Magn. Magn. Mater.182, 341 (1998).
5
S. Heinze, K. von Bergmann, M. Menzel, J. Brede, A. Ku-betzka, R. Wiesendanger, G. Bihlmayer, and S. Bl¨ugel, Nat. Phys.7, 713 (2011).
6
N. Kanazawa, J. H. Kim, D. S. Inosov, J. S. White, N. Egetenmeyer, J. L. Gavilano, S. Ishiwata, Y. Onose, T. Arima, B. Keimer, and Y. Tokura, Phys. Rev. B86, 134425 (2012).
7
N. Romming, C. Hanneken, M. Menzel, J. E. Bickel, B. Wolter, K. von Bergmann, A. Kubetzka, and R. Wiesendanger, Science341, 636 (2013).
8
F. Jonietz, S. M¨uhlbauer, C. Pfleiderer, A. Neubauer, W. M¨unzer, A. Bauer, T. Adams, R. Georgii, P. B¨oni, R. A. Duine, K. Everschor, M. Garst, and A. Rosch, Sci-ence330, 1648 (2010).
9
X. Z. Yu, N. Kanazawa, W. Z. Zhang, T. Nagai, T. Hara, K. Kimoto, Y. Matsui, Y. Onose, and Y. Tokura, Nat. Commun.3, 988 (2012).
10
N. S. Kiselev, A. N. Bogdanov, R. Sch¨afer, and U. K. R¨oßler, J. Phys. D. Appl. Phys.44, 392001 (2011).
11
A. Fert, V. Cros, and J. Sampaio, Nat. Nanotechnol.8, 152 (2013).
12
X. Zhang, M. Ezawa, and Y. Zhou, Sci. Rep. 5, 9400 (2015).
13
A. N. Bogdanov and D. A. Yablonskii, Sov. Phys. JETP
68, 101 (1989).
14
A. Bogdanov and A. Hubert, J. Magn. Magn. Mater.195, 182 (1999).
15
U. K. R¨oßler, A. N. Bogdanov, and C. Pfleiderer, Nature
442, 797 (2006).
16
S. M¨uhlbauer, B. Binz, F. Jonietz, C. Pfleiderer, A. Rosch, A. Neubauer, R. Georgii, and P. B¨oni, Science 323, 915 (2009).
17
X. Z. Yu, N. Kanazawa, Y. Onose, K. Kimoto, W. Z. Zhang, S. Ishiwata, Y. Matsui, and Y. Tokura, Nat. Mater.
10, 106 (2011).
18
X. Z. Yu, Y. Onose, N. Kanazawa, J. H. Park, J. H. Han, Y. Matsui, N. Nagaosa, and Y. Tokura, Nature465, 901 (2010).
19
S. Seki, X. Z. Yu, S. Ishiwata, and Y. Tokura, Science
336, 198 (2012).
20
A. Sonntag, J. Hermenau, S. Krause, and R. Wiesendan-ger, Phys. Rev. Lett.113, 077202 (2014).
21
M. Beg, R. Carey, W. Wang, D. Cort´es-Ortu˜no, M. Vous-den, M.-A. Bisotti, M. Albert, D. Chernyshenko, O. Hov-orka, R. L. Stamps, and H. Fangohr, Sci. Rep.5, 17137 (2015).
22
S. Rohart and A. Thiaville, Phys. Rev. B 88, 184422 (2013).
23
J. V. Kim, F. Garcia-Sanchez, J. Sampaio, C. Moreau-Luchaire, V. Cros, and A. Fert, Phys. Rev. B90, 064410 (2014).
24
Z. V. Gareeva and K. Y. Guslienko, Phys. status solidi -Rapid Res. Lett.10, 227 (2016).
25
M. Mochizuki, Phys. Rev. Lett.108, 017601 (2012).
26
Y. Onose, Y. Okamura, S. Seki, S. Ishiwata, and Y. Tokura, Phys. Rev. Lett.109, 037603 (2012).
27
Y. Okamura, F. Kagawa, M. Mochizuki, M. Kubota, S. Seki, S. Ishiwata, M. Kawasaki, Y. Onose, and Y. Tokura, Nat. Commun.4, 2391 (2013).
28
T. Schwarze, J. Waizner, M. Garst, A. Bauer, I. Stasinopoulos, H. Berger, C. Pfleiderer, and D. Grundler, Nat. Mater.14, 478 (2015).
29
L. D. Buda, I. L. Prejbeanu, M. Demand, U. Ebels, and K. Punadjela, IEEE Trans. Magn.37, 2061 (2001).
30
C. Moutafis, S. Komineas, C. A. F. Vaz, J. A. C. Bland, and P. Eames, Phys. Rev. B74, 214406 (2006).
31
C. Moutafis, S. Komineas, C. A. F. Vaz, J. A. C. Bland, T. Shima, T. Seki, and K. Takanashi, Phys. Rev. B76, 104426 (2007).
32
K. Y. Guslienko, IEEE Magn. Lett.6, 1 (2015).
33
I. Makhfudz, B. Kr¨uger, and O. Tchernyshyov, Phys. Rev. Lett.109, 217201 (2012).
34
C. Moutafis, S. Komineas, and J. A. C. Bland, Phys. Rev. B79, 224429 (2009).
35
F. B¨uttner, C. Moutafis, M. Schneider, B. Kr¨uger, C. M. G¨unther, J. Geilhufe, C. v. K. Schmising, J. Mohanty, B. Pfau, S. Schaffert, A. Bisig, M. Foerster, T. Schulz, C. A. F. Vaz, J. H. Franken, H. J. M. Swagten, M. Kl¨aui, and S. Eisebitt, Nat. Phys.11, 225 (2015).
36
K. Y. Gusliyenko and Z. Gareeva, IEEE Magn. Lett.7, 1 (2016).
37
M. D’Aquino, C. Serpico, G. Miano, and C. Forestiere, J. Comput. Phys.228, 6130 (2009).
38
R. D. McMichael and M. D. Stiles, J. Appl. Phys. 97, 10J901 (2005).
39
F. N. Rybakov, A. B. Borisov, and A. N. Bogdanov, Phys. Rev. B87, 094424 (2013).
40
L. Landau and E. Lifshits, Phys. Zeitsch. der Sow.8, 153 (1935).
41
T. L. Gilbert, IEEE Trans. Magn.40, 3443 (2004).
42
T. Fischbacher, M. Franchin, G. Bordignon, and H. Fan-gohr, IEEE Trans. Magn.43, 2896 (2007).
43
A. Logg, K. A. Mardal, and G. N. Wells,Automated solu-tion of differential equasolu-tions by the finite element method, edited by A. Logg, K.-A. Mardal, and G. Wells, Lecture Notes in Computational Science and Engineering, Vol. 84 (Springer Berlin Heidelberg, Berlin, Heidelberg, 2012) p. 724.
44
A. C. Hindmarsh, P. N. Brown, K. E. Grant, S. L. Lee, R. Serban, D. E. Shumaker, and C. S. Woodward, ACM Trans. Math. Softw.31, 363 (2005).
45
S. D. Cohen, A. C. Hindmarsh, and P. F. Dubois, Comput. Phys.10, 138 (1996).
46
J. D. Hunter, Comput. Sci. Eng.9, 90-95 (2007).
47
J. Ahrens, B. Geveci, and C. Law,ParaView: An end-user tool for large data visualization (Elsevier, 2005).
48
K. J. Maschho and D. C. Sorensen,Lect. Notes Comput. Sci.(2005) pp. 478–486.
49
T. E. Oliphant, Comput. Sci. Eng.9, 10 (2007).
50
S. van der Walt, S. C. Colbert, and G. Varoquaux, Com-put. Sci. Eng.13, 22 (2011).
51
G. Venkat, D. Kumar, M. Franchin, O. Dmytriiev, M. Mruczkiewicz, H. Fangohr, A. Barman, M. Krawczyk, and A. Prabhakar, IEEE Trans. Magn.49, 524 (2013).
52
17
W. Wang, S. Zhang, M.-A. Bisotti, M. Franchin, C. L. Hu, R. Stamps, T. Hesjedal, and H. Fangohr, J. Magn. Magn. Mater.421, 428 (2017).
53
A. Antoniou,Digital Signal Processing: Signals, Systems, and Filters(McGraw-Hill Professional, 2005) p. 965.
54
J. Sampaio, V. Cros, S. Rohart, A. Thiaville, and A. Fert, Nat. Nanotechnol.8, 839 (2013).
55
H. Du, W. Ning, M. Tian, and Y. Zhang, Phys. Rev. B
87, 014401 (2013).
56
H. Du, W. Ning, M. Tian, and Y. Zhang, EPL101, 37001 (2013).
57
R. Carey, M. Beg, M. Albert, M.-A. Bisotti, D. Cort´es-Ortu˜no, M. Vousden, W. Wang, O. Hovorka, and H. Fan-gohr, Appl. Phys. Lett.109, 122401 (2016).
58
N. A. Porter, C. S. Spencer, R. C. Temple, C. J. Kinane, T. R. Charlton, S. Langridge, and C. H. Marrows, Phys. Rev. B92, 144402 (2015).
59
Xiaomin L., J. Rantschler, C. Alexander, and G. Zangari, IEEE Trans. Magn.39, 2362 (2003).
60
S. S. Kalarickal, P. Krivosik, M. Wu, C. E. Patton, M. L. Schneider, P. Kabos, T. J. Silva, and J. P. Nibarger, J. Appl. Phys.99, 093909 (2006).
61
T. Kawai, A. Itabashi, M. Ohtake, S. Takeda, and M. Fu-tamoto, EPJ Web Conf.75, 02002 (2014).
62
W. Wang, M. Beg, B. Zhang, W. Kuch, and H. Fangohr, Phys. Rev. B92, 020403 (2015).
63
nanostructures
Marijan Beg,1,∗ Maximilian Albert,1 Marc-Antonio Bisotti,1 David Cort´es-Ortu˜no,1 Weiwei Wang,1, 2 Rebecca Carey,1 Mark Vousden,1 Ondrej Hovorka,1 Chiara Ciccarelli,3 Charles S. Spencer,4 Christopher H. Marrows,4 and Hans Fangohr1,†
1
Faculty of Engineering and the Environment, University of Southampton, Southampton, SO17 1BJ, United Kingdom
2
Department of Physics, Ningbo University, Ningbo, 315211, China
3
Cavendish Laboratory, University of Cambridge, Cambridge, CB3 0HE, United Kingdom
4
School of Physics and Astronomy, University of Leeds, Leeds, LS2 9JT, United Kingdom
I. SUPPLEMENTARY SECTION S1: TARGET (T) STATE
In this Supplementary Section, we study the dynamics of the Target (T) state. This state is characterised by the scalar valueSabeing in the [1,2] range,1because the magnetisation componentmzcovers the [−1,1] range twice, plus
an additional magnetisation tilting at the boundary due to the specific boundary conditions.2 Although the T state is never the ground state (global energy minimum) in the studied system, it is in an equilibrium1for the disk sample diameters 144 nm≤d≤180 nm and the external magnetic bias fieldµ0H ≤0.24 T. More precisely, for these dand
H values, target state is in the local and not global energy minimum state. We explore the target state dynamics in a 160 nm diameter disk sample with 10 nm thickness at zero external magnetic bias field. In order to obtain the target state in the sample, the magnetisation is initialised with a state having similar configuration as explained in Ref. 1.
In the first step, we compute all existing eigenmodes below 50 GHz. Using the ringdown method, we compute the Spatially Averaged (SA) and Spatially Resolved (SR) Power Spectral Densities (PSDs) for an in-plane excitation, overlaid with the eigenvalue results, and show them in Supplementary Fig. 1 (a) and Supplementary Fig. 1 (b), respectively. In these power spectral densities, we observe eleven peaks (eigenmodes A, B, C, D, E, F, G, I, J, L, and M) and show their schematic representations in Supplementary Fig. 1 (e). We identify the two lowest frequency peaks at 0.72 GHz and 0.89 GHz, which correspond to the gyrotropic eigenmode A and lateral eigenmode B, respectively. Similar to the incomplete skyrmion and isolated skyrmion states, the gyrotropic eigenmode A magnetisation dynamics consists of a target state core (wheremz =−1) gyrating around its equilibrium position in the CounterClockWise
(CCW) direction. The magnetisation dynamics of eigenmode B is composed of a magnetisationzcomponent contour ring revolving in the ClockWise (CW) direction around the sample centre. At 2.86 GHz, we identify another dominant eigenmode D, which consists of a T state core and a contour ring rotating in the CCW direction, but mutually out-of-phase. In the case of the eigenmode F at 8.17 GHz, the T state core is static, but two magnetisation contour rings revolve mutually out-of-phase in the CW direction. The magnetisation dynamics of all other eigenmodes (G, I, J, L, and M) present in the in-plane power spectral densities have significantly lower power. They are all lateral and consist of different combinations of revolving contour rings and the T state core, and we show their schematic representations in Supplementary Fig. 1 (e). All discussed eigenmodes so far are lateral (in-plane), but in the discussed in-plane PSDs, two breathing eigenmodes C and E are also present with significantly lower power and we will discuss them subsequently when an out-of-plane excitation is used to perturb the system. We show the magnetisation dynamics of all eigenmodes computed using the eigenvalue method and in Supplementary Videos 4 and 5, and their schematic representations in Supplementary Section S3.
2
Supplementary Fig. 1. The Power Spectral Densities (PSDs) of a Target (T) equilibrium state in a 160 nm diameter FeGe disk sample with 10 nm thickness at zero external magnetic bias field. (a) Spatially averaged and (b) spatially resolved PSDs for an in-plane excitation, together with overlaid resonance frequencies computed using the eigenvalue method. The resonant frequencies obtained using the eigenvalue method are marked with a triangle symbol (△) if they can be activated using a particular excitation and with a circle symbol (◦) otherwise. (c) Spatially averaged and (d) spatially resolved PSDs computed when the target state is perturbed from its equilibrium with an out-of-plane excitation. (e) Schematic representations of magnetisation dynamics associated with the identified eigenmodes. Schematically, we represent the target state core with a circle symbol, together with a directed loop if it gyrates around its equilibrium position. Contour rings represented using dashed lines revolve/breathe out-of-phase with respect to the those marked with solid lines. The magnetisation dynamics animations of all identified eigenmodes are provided in Supplementary Videos 4 and 5.
II. SUPPLEMENTARY SECTION S2: EXTERNAL MAGNETIC FIELD AND DISK SAMPLE DIAMETER DEPENDENCE OF RESONANCE FREQUENCIES COMPUTED USING EIGENVALUE
METHOD