This is a repository copy of
Using thermoluminescence signals from feldspars for
low-temperature thermochronology
.
White Rose Research Online URL for this paper:
http://eprints.whiterose.ac.uk/120515/
Version: Accepted Version
Article:
Brown, N.D., Rhodes, E.J. orcid.org/0000-0002-0361-8637 and Harrison, T.M. (2017)
Using thermoluminescence signals from feldspars for low-temperature thermochronology.
Quaternarfy Geochronology, 42. pp. 31-41. ISSN 1871-1014
https://doi.org/10.1016/j.quageo.2017.07.006
Article available under the terms of the CC-BY-NC-ND licence
(https://creativecommons.org/licenses/by-nc-nd/4.0/).
eprints@whiterose.ac.uk https://eprints.whiterose.ac.uk/ Reuse
This article is distributed under the terms of the Creative Commons Attribution-NonCommercial-NoDerivs (CC BY-NC-ND) licence. This licence only allows you to download this work and share it with others as long as you credit the authors, but you can’t change the article in any way or use it commercially. More
information and the full terms of the licence here: https://creativecommons.org/licenses/
Takedown
If you consider content in White Rose Research Online to be in breach of UK law, please notify us by
Using thermoluminescence signals from feldspars for low-temperature
thermochronology
N.D. Browna,∗
, E.J. Rhodesa,b, T. Mark Harrisona
a
Department of Earth, Planetary, and Space Sciences, University of California, Los Angeles, 595 Charles Young Drive East, Box 951567, Los Angeles, CA 90095-1567, USA
b
Department of Geography, Winter Street, University of Sheffield, Sheffield, South Yorkshire S10 2TN, UK
Abstract
Natural thermoluminescence (TL) signals from feldspar crystals extracted from thermally stable
drill cores (T = −4.1−60.2 ◦
C) exhibit a strong dependence on geologic and laboratory thermal
conditions. As burial temperature increases, the position of the TL glow curve at half-maximum
intensity (i.e., the T1/2 parameter) shifts to higher measurement temperatures. This shift is also
observed following isothermal treatments in the laboratory. This relationship can be explained
using a kinetic model originally developed for optical luminescence dating of feldspar grains. The
thermal history of a sample is preserved in the degree of electron trap saturation as a function
of thermal detrapping probability, which varies with recombination distance. A natural feldspar
sample contains a range of thermal stabilities: the least stable traps will remain empty, the most
stable will be full, and those traps which are partially filled will, in the case of thermal equilibrium,
be diagnostic of the storage temperature. The T1/2 parameter of a TL glow curve reflects which
sites remain occupied. This interpretation is further borne out by additive dose measurements which
illustrate that samples buried at lower temperatures are fully saturated at lower TL measurement
temperatures (∼200−300◦
C) relative to warmer samples. This signal is estimated to be useful in
rapidly-cooling bedrock and should grow measurably for∼102−106 years.
Keywords: luminescence thermochronology, low-temperature thermochronology, feldspar
thermoluminescence
1. Introduction 1
Luminescence signals from quartz and feldspar crystals extracted from bedrock samples have
2
recently been shown to contain information useful for reconstructing geothermal histories (Herman
3
∗Corresponding author
Email addresses: nathan.david.brown@ucla.edu(N.D. Brown),ed.rhodes@sheffield.ac.uk(E.J. Rhodes),
tmark.harrison@gmail.com(T. Mark Harrison)
Authors' accepted version of a paper published as
Quaternary Geochronology 42 (2017) 31-41.
et al., 2010; Li and Li, 2012; Sarkar et al., 2013; Guralnik et al., 2013, 2015a,b; King et al., 2016b,c).
4
The proposed effective closure temperatures for these signals extend below 100 ◦
C, depending on
5
the cooling rate and ambient temperature. Both quartz and feldspar luminescence signals face
6
limitations, however, in their utility as thermochronometers. The fast component of optically
stim-7
ulated luminescence (OSL) from bedrock quartz is characteristically dim, typically experiences dose
8
saturation at lower doses than feldspar, and is commonly overprinted by brighter luminescence
9
responses from inclusions, such as feldspar or zircon (Guralnik et al., 2015a). Whereas feldspar
lu-10
minescence signals are brighter and saturate at higher doses than quartz, the non-first-order kinetics
11
of detrapping (e.g., band-tail transitions, athermal fading via quantum mechanical tunneling) pose
12
a significant challenge (Jain and Ankjaergaard, 2011; Jain et al., 2015). Luminescence signals of
13
feldspar crystals extracted from crushed bedrock are the focus of this study.
14
As of yet, the only feldspar luminescence signals interrogated for thermochronometry have been
15
the infrared stimulated luminescence (IRSL) signal from Na-feldspar, extracted from the
thermally-16
stable KTB borehole in Germany (Guralnik et al., 2015b); the IRSL signal from surficial bedrock
17
feldspars collected from a range of lithologies and exhumation rates (Valla et al., 2016); and IRSL
18
signals at multiple elevated temperatures (MET) from Na- and K-rich feldspars within the
rapidly-19
exhuming eastern Himalayan syntaxis (King et al., 2016b,c). Optically-stimulated luminescence
20
techniques (including IRSL) offer several advantages for the luminescence dating of sediments in
21
comparison to thermoluminescence (TL) signals: the measured signal bleaches more rapidly with
22
sunlight exposure, and single grains can be individually stimulated with focused laser beams.
How-23
ever, for monitoring the dose response in a lightless but thermally-varying system, the TL signal
24
may provide a distinct advantage. Specifically, the stimulating energy gradually increases during
25
the measurement procedure, which produces luminescence from a continuum of thermal stabilities
26
in a single glow curve (Strickertsson, 1985; Balescu et al., 1997). Unlike IRSL techniques, which
27
stimulate with a constant optical power, TL is measured by gradually heating a sample from room
28
temperature until the relevant traps are emptied (conventionally to a maximum of around 500◦
C),
29
and the luminescence emissions are monitored as a function of the temperature of the sample.
Ther-30
moluminescence emissions therefore reflect the range of occupied trap stabilities that have naturally
31
accumulated. This study aims to characterize feldspar TL as a record of geothermal history.
32
Thermoluminescence has long been used to discern features about a sample’s thermal history.
33
Most often, researchers are interested in the time since the thermal-resetting of archaeological
34
materials. Quartz is the more common target mineral in this context. Target materials include
fired ceramics (Aitken et al., 1964; Fleming et al., 1970), hearth stones (Plachy and Sutton, 1982),
36
and burnt flint (Valladas and Valladas, 1987). A notable exception is the use of feldspar TL for the
37
dating of burnt stones and ceramics (Mejdahl, 1983, 1985; Spencer and Sanderson, 1994, 2012).
38
When used for thermochronometry, thermoluminescence studies usually consider the decay of
39
peaks in quartz crystals (e.g., Tang and Li, 2015). Prokein and Wagner (1994) observed the
reduc-40
tion of the quartz 325◦
C TL peak over a wide range of steady-state temperatures (14 - 56◦
C), and
41
Nambu et al. (1996) made the more general observation of decreasing overall quartz TL intensity
42
with burial temperature, an observation that was given more robust theoretical treatment in later
43
work (Tsuchiya et al., 2000; Tsuchiya and Fujino, 2000; Schmidt et al., 2015). Gong et al. (2010)
44
extended the ESR framework of Gr¨un et al. (1999) to estimate apparent ages and paleotemperatures
45
for the 375 and 425 ◦
C TL peaks of quartz from sedimentary basins. Ypma and Hochman (1991)
46
monitored the temperature shift of the bulk TL glow curve in quartz from sedimentary basins and
47
noticed systematic shifts between basins with differential exhumation histories.
48
Thermoluminescence signals from lunar rocks and fines (e.g., plagioclase) have also been used
49
to estimate the balance between irradiation and thermal depletion of traps. These studies produced
50
quantitative estimates of sediment burial depth (Hoyt et al., 1970; Durrani et al., 1973), effective
51
storage temperature (Durrani et al., 1972, 1973), thermal gradient (Hoyt et al., 1971), and even
52
the duration of shadow cover for samples adjacent to boulders (Durrani et al., 1977). The present
53
study extends that body of work by incorporating recent advances in the understanding of feldspar
54
luminescence kinetics (e.g., detrapping by tunneling to nearby recombination centers; Jain et al.,
55
2015) and by considering long-term storage of feldspars at upper-crustal temperatures in terrestrial
56
drill cores.
57
This study examines both the natural and laboratory-induced TL signals from feldspar crystals
58
extracted from split drill cores originally collected from Alaska, Colorado, and Wyoming that
rep-59
resent steady-state heat flows of 54.4, 58.3, and 100.4 mW/m2, respectively. First, the TL signals
60
of feldspars taken from different depths are measured. The natural signals are presented along
61
with multiple-aliquot additive-dose (MAAD) and single-aliquot regenerative (SAR) dose responses,
62
as well as isothermal decay measurements. Next, these signals are compared with results from a
63
kinetic model similar to that of Jain et al. (2015) that assumes that: a) distance-dependent,
excited-64
state tunneling is the primary pathway for feldspar luminescence; and b) that sites at increasing
65
distances from centers will exhibit greater trapping stability. We simulate laboratory and natural
66
isothermal conditions and compare the simulated results to our measurements. Finally, we suggest
future research directions.
68
2. Materials and methods 69
2.1. Geologic context and sample collection
70
A total of 20 samples were collected from split drill cores kept at the United States Geologic
71
Survey Core Research Center (CRC), Lakewood, Colorado. The samples were chosen to
repre-72
sent a wide range of steady-state temperatures (−4.1−60.2 ◦
C), within relatively uniform
litholo-73
gies. The three cores sampled were from the North Slope of Alaska (CRC library code E802;
74
n = 5; 69◦
50’18”N, 155◦
59’24”W), the Piceance Basin of northwestern Colorado (W219; n = 8;
75
39◦
53’36”N, 108◦
32’37”W), and the Greater Green River Basin of south-central Wyoming (R716;
76
n = 7; 41◦
2’41”N, 108◦
6’39”W) (Fig. 1(a) and (b)).
77
Core E802 from the Colville Basin of North Slope Alaska is comprised of the Nanushuk Group:
78
Lower and Upper Cretaceous sandstone, shale, and minor conglomerate deltaic wedge, all shed from
79
the Brooks Range, a series of thrust sheets stacked during the Late Jurassic to Early Cretaceous
80
arc-continent collision (Mull et al., 1987). Core W219 is comprised of the Green River
Forma-81
tion: Eocene interbedded mudstone and sandstone, carbonaceous shale, lenticular sandstones and
82
thickly-bedded evaporites that were deposited in and around lacustrine basins formed during the
83
Laramide orogeny (Irwin, 1977; Smith et al., 2008). Core R716 contains Eocene basin-fill (Wasatch
84
Formation): floodplain deposits of lenticular of parallel-bedded sandstones, and mudstone (Roehler,
85
1992). Similar to W219, the R716 core was likely derived from Laramide basement (Fan et al., 2011).
86
To estimate the undisturbed modern subsurface temperatures for each core, the following steps
87
were taken. For E802, the geothermal gradients above and below the ice-bearing permafrost layer
88
were interpolated from nearby sites within the Colville Basin which were measured for a
high-89
resolution temperature survey of wells considered to be in thermal equilibrium (Collett et al., 1993).
90
For W219, a similar interpolation was performed using gradient-at-depth measurements from nearby
91
sites within the Piceance Basin (Blackwell et al., 2011). For R716, a geothermal gradient map was
92
used (Finn, 2005). From these geothermal gradient approximations, the modern temperature of
93
each core sample was estimated (Fig. 1(b)). Further details about these measurements can be
94
found in the Supplementary Materials.
95
Whether samples are in thermal equilibrium depends on the exhumation rate at each core site.
96
The most rapid exhumation is at site W219. Although no measurements have been made at the
97
core site itself, fluid inclusion microthermometry (Fall et al., 2012, 2015) and vitrine reflectance
data (Zhang et al., 2008) from the center of the Piceance Basin imply an exhumation rate of 0.16
99
- 0.24 km/Ma since 10 Ma, corresponding to a cooling rate of 3.8 ◦
C/Ma within the Mesaverde
100
Group (modern geothermal gradient of 53 ◦
C/km), immediately below the Wasatch Formation
101
(vitrine reflectance data suggest heat-flow values similar to modern since the Miocene). Moreover,
102
the exhumation at the northern basin edge is expected to be slower than in the center (Zhang
103
et al., 2008). Based on apatite fission track cooling ages, the exhumation rate for the Colville Basin
104
(core E802) since the Paleocene has been about 0.05 - 0.06 km/Ma (Cole et al., 1997) and vitrine
105
reflectance data suggest an exhumation rate of 0.01 - 0.02 km/Ma since the Eocene for the Green
106
River Basin (core R716) (Jagniecki et al., 2013), both of which are effectively static for the TL signal
107
considered here. The modern geothermal gradients at these sites are also much lower than at W219:
108
34 and 35 ◦
C/km compared with 53 ◦
C/km (see Supplementary Materials for more detail), which
109
would result in cooling rates of 1.9 and 0.5 ◦
C/Ma for E802 and R716, respectively. Because these
110
cooling rates are considerably lower than the reported detectable cooling rates for other
trapped-111
charge thermochronometric systems (e.g., >20 to 615 ◦
C/Ma; Table 2 of King et al., 2016a), the
112
modern undisturbed core temperature measurements are reported as ‘steady-state’ temperatures
113
(TSS) hereafter. 114
2.2. Sample preparation and instrumentation
115
To isolate the inner portion of the split drill cores, the samples were spray-painted and then the
116
outer surfaces were removed using a rotary tool fitted with a tile-cutting bit. The unexposed inner
117
portions from the drill core samples were then ground with a pestle and mortar and sieved to isolate
118
the 175 - 400 µm size fraction. These separates were then treated with 3% hydrochloric acid and
119
separated by density using lithium metatungstate heavy liquid (ρ <2.565 g/cm3; Rhodes 2015) in
120
order to isolate the most potassic feldspar crystals. Crystals were mounted on stainless steel discs
121
in a small-diameter (3 - 5 mm) monolayer using silicon oil.
122
The outer portions of each sample were analyzed with inductively-coupled plasma mass
spec-123
trometry (ICP-MS) to estimate the U and Th contents, and with inductively-coupled optical
emis-124
sion spectrometry (ICP-OES) to measure the K content. These values were converted into a geologic
125
dose-rate using the factors of Adamiec and Aiken (1998). We estimate an internal dose-rate
assum-126
ing a feldspar potassium content of 12.5 ± 0.5 wt% (Huntley and Baril, 1997). Beta attenuation
127
is calculated assuming a water content of 0.5 ± 0.5%. The resulting geologic dose-rate values are
128
listed in Table 1.
Table 1: Sample depths, steady-state temperatures, and dose-rate information.
Field code Lab code Depth (m) TSS (◦C) K (%) Th (ppm) U (ppm) Total dose-rate (Gy/ka)
E802-1 J1012 159 -4.1 1.1 5.2 2.04 2.85± 0.11
E802-2 J1013 303 0.8 0.9 3.5 1.39 2.39± 0.10
E802-3 J1014 367 3.0 1.1 4.9 1.77 2.76± 0.11
E802-4 J1015 496 7.4 1.3 5.5 1.96 3.04± 0.12
E802-5 J1016 656 12.8 0.9 6.1 2.09 2.73± 0.10
W219-1 J1017 7 6.4 3.6 9.7 2.39 5.72± 0.27
W219-2 J1018 72 9.8 2.4 10.0 1.87 4.36± 0.19
W219-3 J1019 150 14.0 6.1 7.2 2.13 7.71± 0.43
W219-4 J1020 240 18.7 1.3 4.6 4.21 3.49± 0.13
W219-5 J1021∗
321 23.0 1.6 3.5 2.34 3.27± 0.14
W219-6 J1022∗
418 28.2 1.3 4.8 2.47 3.11± 0.12
W219-7 J1023∗
509 33.0 2.2 12.1 3.55 4.70± 0.18
W219-8 J1024∗
575 36.5 0.4 1.9 0.98 1.72± 0.08
R716-1 J1025 307 15.1 2.1 7.1 1.57 3.81± 0.17
R716-2 J1026 445 19.8 2.5 17.1 4.81 5.61± 0.21
R716-3 J1027 606 25.4 2.4 16.4 3.59 5.19± 0.20
R716-4 J1028 881 35.0 2.1 23.8 5.43 5.83± 0.21
R716-5 J1029 1030 40.1 1.9 13.8 2.82 4.36± 0.17
R716-6 J1030 1462 55.1 1.9 16.9 3.68 4.77± 0.18
R716-7 J1031 1609 60.2 0.9 3.2 2.15 2.60± 0.10
∗
The natural signals from these samples were conflated with black-body radiation emissions
during measurement and are disregarded from further analysis.
Luminescence measurements were carried out at the UCLA luminescence laboratory using a
130
TL-DA-20 Risø automated reader equipped with a 90Sr/90Y beta source. Thermoluminescence
131
emissions were detected through a Schott BG3-BG39 filter combination (transmission window of
132
325 - 475 nm) in a nitrogen atmosphere.
3. Thermoluminescence signals from feldspars extracted from drill cores 134
3.1. Natural signals
135
Sixteen of the 20 measured samples produced natural TL signals suitable for analysis (Fig. 2).
136
The four rejected samples were from core W219, were buried at temperatures≥23◦
C, and yielded
137
natural signals dominated by black-body radiation (approximated by measuring TL from the same
138
aliquot after the natural signal has been removed). This lack of natural signal likely results from the
139
high burial temperatures experienced by these samples. In core R716, however, samples with higher
140
TSS values retained natural TL signals above black-body radiation levels. The natural variability 141
in the upper limit of resolvableTSS values deserves further exploration. 142
Because the low-temperature TL peak in feldspar is generally asymmetric with overlapping
143
peaks at higher temperatures, it is common practice to describe natural TL curves according to the
144
measurement temperature at half of the maximum TL intensity (i.e., the position of the ‘leading
145
edge’ of the main peak in a TL glow curve), orT1/2(e.g., Spencer and Sanderson, 2012). As
steady-146
state temperatures (TSS) increase, the natural T1/2 values shift to higher temperatures (Fig. 1c).
147
Additionally, within a given core (each of which has a fairly uniform lithology), TL brightness tends
148
to decrease at higher TSS values (Fig. 2). 149
3.2. Field saturation
150
A primary concern when considering the dose-response characteristics of luminescence signals is
151
a change in sensitivity during the course of a measurement sequence (Wintle and Huntley, 1982).
152
To avoid any such changes in the dose-response sensitivity induced by heating, we tested the level
153
of natural dose-saturation (i.e., ‘field saturation’; Kars et al., 2008) in samples J1012 and J1030 by
154
using a multiple-aliquot additive-dose (MAAD) approach. Separate aliquots were given beta doses
155
in addition to their natural doses. The subsequent TL curves (Fig. 3a - b) show which regions of
156
the glow curve are saturated (and do not, therefore, grow with dose) and which regions are not
157
saturated (and grow with dose).
158
Sample J1012 is almost fully saturated from about 270 to 370◦
C, with an average ratio of 0.95±
159
0.02. Sample J1030 shows a similar degree of saturation, 0.95 ±0.03, from 340 to 410◦
C (Fig. 3c).
160
The key observation from this experiment is that TSS relates to the TL measurement temperature 161
at which traps are fully saturated (i.e., in field saturation; TSS =−4.1◦C for J1012 and 55.1◦C for 162
J1030). This indicates that burial temperature controls which regions within a TL curve are stable
163
enough to accumulate charge over time. At higher measurement temperatures, both samples show
ratios greater than one, which may reflect the effect of dose-quenching (for a detailed description of
165
this phenomenon in quartz, see Bailey, 2001) on a high-temperature peak (e.g., 410 ◦
C TL peak;
166
Murray et al., 2009). Why the samples are > 1 at different temperatures is unclear, but likely
167
relates to the variability in the position of the high-temperature peak(s).
168
3.3. Signals following isothermal treatments
169
After the measurement of the natural signal, an aliquot of sample J1012 (core E802) was given
170
a beta dose of 24 Gy and then subjected to a series of isothermal treatments: 50, 100, 150, and
171
200◦
C for 10, 30, 100, 300, and 1000 s. Following these treatments, the TL signals were measured
172
(Fig. 4). A shift to higher temperatures for the T1/2 value and a reduction in TL intensity result
173
from longer heat treatments and greater hold temperatures, an observation made previously (e.g.,
174
Spencer and Sanderson, 1994). This resembles the effect of burial at higher natural TSS values 175
(Fig. 2). Both of these effects are simulated later in this work in sections 4.3 and 4.4.
176
A higher temperature peak is evident, centered around 390 ◦
C. High-temperature peaks
(cen-177
tered between ∼ 310 - 410 ◦
C) are well-documented for feldspar TL studies and exhibit different
178
luminescence properties than the lower-temperature peak and probably therefore involve a
differ-179
ent combination of traps and/or recombination centers (Balescu et al., 1991; Duller, 1994, 1997;
180
Murray et al., 2009). For that reason, our analysis is restricted to those regions unaffected by this
181
higher-temperature peak.
182
4. A kinematic model of feldspar TL 183
4.1. Model description
184
In this study, we estimate the net change in the concentration of trapped electrons with the
following expression
dn(r′
) dt = ˙ D D0
N(r′
)−n(r′
)
−n(r′
) exp
−∆E/kBT
P(r′
)s
P(r′) +s (1)
The accumulation term for every dimensionless recombination distance r′
depends on the
concen-tration of unoccupied traps (N(r′
)−n(r′
)), which will fill at a rate proportional to the dose-rate ˙D
(Gy/s), normalized by D0, the dose (Gy) at which (1−e−1) of the total traps are filled (i.e., the
characteristic dose) (Christodoulides et al., 1971). The total concentration of traps separated from
a recombination center by some distance between r′
andr′
+dr′
is given by Huntley (2006) as
N(r′
)dr′
=N ·3(r′
)2exp −(r′
)3
dr′
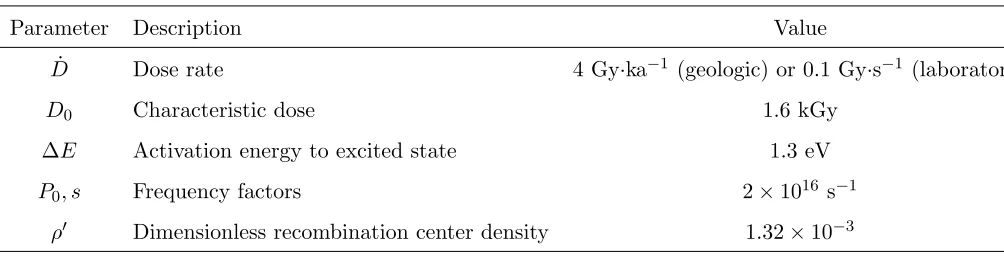
Table 2: Parameter values used in kinetic model.
Parameter Description Value
˙
D Dose rate 4 Gy·ka−1 (geologic) or 0.1 Gy·s−1 (laboratory)
D0 Characteristic dose 1.6 kGy
∆E Activation energy to excited state 1.3 eV
P0, s Frequency factors 2×10¹⁶ s−1
ρ′
Dimensionless recombination center density 1.32×10⁻³
The loss term multiplies the concentration of trapped electrons at some distancen(r′
) by their
recombination probability. Following recent work (Jain et al., 2015; Pagonis et al., 2016), we
approximate the detrapping probability in feldspar as localized transitions to randomly-distributed
luminescence centers. This probability is governed by the activation energy from the ground- to
the excited-state, ∆E (eV), the temperature of the lattice,T (K), the attempt-to-escape frequency
factor, s(s−1), and the excited-state tunneling probability, P(r′
) (s−1). The tunneling probability
decreases with r′
according to the relationship
P(r′
) =P0exp(−ρ
′−1/3 r′
) (3)
where P0 (s−1) is the attempt-to-tunnel probability and ρ′ the dimensionless concentration of
re-185
combination centers in the lattice (Huntley, 2006). A more complete model description is found in
186
the Supplementary Materials.
187
By numerically solving Equation 1 for geothermal or laboratory conditions, we can evaluate how
the trapped electron population, n(r′
), evolves through time (all simulations presented in this work
were evaluated with the ode23tb solver within MATLAB). The resulting n(r′
) array can then be
taken as the input for a simulated TL measurement. The expression for TL intensity as a function
of measurement time is given as
IT L(t)∝
Z tF
t=0
Z ∞
r′=0 n(r′
)dr′
dt (4)
when a sample is heated fromT = 0 toTF atdT /dt=β ◦C/s. The final measurement time,tF, is 188
the final temperature, TF, divided by the heating rate,β. 189
4.2. Model parameter values
190
The behavior of Eq. 1 is sensitive to the parameter values chosen. In this section, we describe
191
the values used in this study. While all of the values presented here are consistent with available
literature values and with experimental results, it should be stressed that many of these values will
193
vary between samples. The careful quantification of these parameters will be a prerequisite for the
194
quantification of thermal histories using feldspar TL signals.
195
4.2.1. Geologic (D˙G) and laboratory (D˙L) dose rates 196
The average environmental dose rate for all samples is 4.0 ± 1.5 Gy/ka, represented by our
197
chosen ˙DG value of 4 Gy/ka. The laboratory dose rate, ˙DL, administered by the 90Sr/90Y beta 198
source at UCLA has been measured to be 0.1 Gy/s at the sample location using the standard
199
calibration quartz sample supplied from Risø DTU National Laboratory. This value is used to
200
simulate laboratory irradiations.
201
4.2.2. Characteristic dose, D0
202
The TL dose response of sample J1012 is shown in Fig 5(a) following single-aliquot regenerative
doses ranging from 0 to 3.9 kGy. Because we are concerned with growth in the region of the TL
curve near the natural T1/2 values, we examine the saturation behavior around the 230
◦
C region
of the glow curves (T1/2 = 223, 223, 227, and 236
◦
C for J1012; purple TL curves in Fig. 2).
Specifically, we fit the TL values to a single saturating exponential function of the form
I =Imax(1−exp−D/D0) (5)
whereI is the TL intensity which increases with given doseDup to some maximum intensityImax 203
(Christodoulides et al., 1971). In this region, we see an average D0 value of 1.6 kGy. Such a value
204
is consistent with previous additive dose observations (e.g., Balescu and Lamothe, 1992; Balescu
205
et al., 1997).
206
Given the multiple-aliquot additive-dose (MAAD) results reported in the Section 3.2, it appears
207
as though the TL intensity at the naturalT1/2value derives from those traps which will remain only
208
partially filled (n/N < 0.86) at the relevant geologic dose-rate and temperature. In this view, a
209
conservative approach would be to examine the dose-responses at more stable portions of the curve
210
to avoid measuring traps that would fill at laboratory but not geologic dose-rates. We therefore
211
report a D0 value of 1.6 kGy, a value taken from the range 260< T (◦C)<270.
212
Ultimately, this parameter will control the time required for a sample to equilibrate to thermal
213
steady-state and should therefore be quantified thoroughly when addressing transient responses to
214
thermal perturbation. For our study, where sites have been cooling very slowly for at least 10
215
Ma (t >> 2D0/D˙), this parameter will not significantly affect our drill core fitting results. In
rapidly-cooling bedrock, however, this term will influence the length of time that traps will remain
217
in disequilibrium.
218
4.2.3. Frequency factors, P0 and s
219
For the attempt-to-tunnel and attempt-to-escape frequency factors (P0 and s, respectively) we
220
use a reasonable but arbitrary value of 2×10¹⁶ s−1. Post-isothermal TL analyses (Brown and
221
Rhodes, 2017) of J1012 suggest that the effective frequency factors involved in TL production, i.e.,
222
P(r′
)s
/ P(r′
)+s
term within Equation 1, range from 1014to 1018s−1, decreasing monotonically
223
as a function of isothermal holding temperature or duration.
224
Despite the fact that theP0 andsvalues have different physical meanings (pp. 48-49, McKeever,
225
1985; Tsuchiya et al., 1987) and may vary by orders of magnitude (Jain et al., 2015), we assign them
226
the same numerical value for goodness-of-fit and simplicity (we express both terms individually in
227
Equation 1).
228
4.2.4. Activation energy, ∆E, and recombination center density, ρ′ 229
Jain et al. (2015) introduced the following expression to describe isothermal TL from feldspars:
L∝ −dn
dt = 3n0ρ
′
z(t′
)−1
ln(t′
P0)−ξ
2
exp −ρ′
ln(t′
P0)−ξ
3!
(6)
wheret′
=τ0+ztandξ = ∆E/kBT, withn0 representing the concentration of trapped electrons at
230
the start of the measurement andzrepresenting the rate of change for the lifetime of trapped charge
231
(following Huntley (2006) and Jain et al. (2012), we set z = 1.8). The variable τ0 represents the
232
critical lifetime at the start of the measurement. Bothn0andτ0depend upon the radiation history of
233
a sample and are best-fit parameters. Assuming that recombination proceeds by tunneling from the
234
excited state to randomly-distributed luminescence centers, isothermal TL at any hold temperature
235
should approximately follow Eq. 6.
236
Fig. 5(b) shows the isothermal decay of an aliquot of J1012 held at 250, 300, and 350 ◦
C for
237
1000 s (400 s of which is shown). These data are fitted with Eq. 6 using the same parameters used
238
in the main text to fit theT1/2 values for all drill core samples at natural and laboratory conditions,
239
namely: ∆E = 1.3 eV,ρ′
= 1.32×10⁻³ and P
0 = 2×10¹⁶ s−1.
240
4.3. Simulated TL responses following isothermal geologic histories
241
Using Eq. 1 and the parameter values listed in Table 2 (with the average geologic dose rate
242
˙
10, and 20 ◦
C, and durations of 20 ka, 200 ka, and 2 Ma. After 800 ka (2D0/D˙G), assuming the 244
parameters listed in Table 2, the most stable traps (highest r′
values) will be effectively saturated,
245
i.e., n/N ∼0.86 (see also Fig. 7). After 2 Ma, these traps should be entirely full (n/N ∼1). The
246
final distribution ofn(r′
) after each treatment was then evaluated using Eq. 4 to produce a synthetic
247
TL curve; these are shown in Fig. 6a.
248
Two features are remarkable. First, and most relevant for this study, the TL peaks are emitted
249
at higher stimulation temperatures when trapping occurs at higher temperatures. This is because
250
those sites which are nearer to centers (i.e., have lower r′
values) are unstable at higher ambient
251
temperatures, and are therefore empty during the natural TL measurement. Second, the integrated
252
emissions are greater for those simulations at lower temperatures. The reason for this is that the
253
ratio of excited-to-ground-state electrons (ne/ng) depends exponentially on temperature (ne/ng = 254
exp(−∆E/kBT)) and this ratio controls the rate of detrapping (see the Supplementary Materials 255
for more detail).
256
4.4. Simulated TL responses following isothermal treatments
257
The same approach was used to predict the effects of short duration heat treatments. For each
258
of these simulations, laboratory irradiation was reproduced by changing the dose rate, ˙D, to 0.1
259
Gy/s (this mimics the dose-rate received by crystals exposed to the90Sr/90Y beta source at UCLA)
260
and allowing the n(r′
) distribution to evolve for 200 s (a simulated laboratory dose of 20 Gy) at 20
261
◦
C. Next, this n(r′
) distribution was used as the initial condition of an isothermal heat treatment.
262
The simulated hold times were 100, 300, and 1000 s; and the temperatures were 100, 150, and 200
263
◦
C. Finally, the n(r′
) distribution was evaluated with Eq. 4, producing the TL curves shown in
264
Fig. 6c.
265
The effects of heating are to shift the TL emissions to higher measurement temperatures and
266
to reduce the peak intensity. This reason for this behavior is the progressive thermal erosion of
267
those sites which have lower recombination distances; the more stable sites comprise the higher
268
temperature regions of the TL measurements.
269
4.5. Trapping at a single recombination distance
270
Equation (1) can also be used to illustrate the evolution of trap populations under different
271
scenarios. An arbitrary recombination distance of r′
(e.g., 1.5) and a constant temperature of
272
−4.1 ◦
C (e.g., sample J1012) are examined within a 2 Ma simulation (Fig. 7a). The results are
273
shown as the fraction of traps which are filled (when n/N = 1, all available traps are filled). Once
about 86% of traps are filled, even small variations in the measured luminescence response will
275
lead to large or infinite errors in age determination and the trap is effectively saturated (Wintle
276
and Murray, 2006). This saturation level is described with the D0 parameter (effective saturation
277
occurring at doses > 2D0). In our case, we prescribe a value of D0 = 1.6 kGy based on dose
278
response measurements of sample J1012 (Fig. 5a); higher values result in a greater time required to
279
reach saturation.
280
In our simulation, trap filling through time progresses as expected for a discrete trap (Fig. 7a). As
281
the available sites fill, the fractional saturation behaves as a saturating exponential function. Notice
282
that at the chosen temperature, this site will not fill entirely (n/N <1). In other words, a thermal
283
steady-state ((n/N)SS) is reached which is incompletely saturated (cf. Christodoulides et al., 1971). 284
Of course, with randomly distributed luminescence centers many recombination distances will occur,
285
as discussed in the following section.
286
4.6. Trapping at all recombination distances
287
Considering all recombination distances present in the lattice and assuming randomly distributed
288
centers, we can visualize trapping as a function of both time and recombination distance. Using
289
Eq. 1, trapping is simulated at T = −4.1◦
C for durations of 0.25, 0.5, 1, and 2 Ma (Fig. 7b).
290
The results shown in Fig. 7a are indicated with the light blue line for reference. Those traps with
291
centers nearer than about r′
= 1.7 will not saturate completely (given the prescribed temperature
292
and dose rate) and sites atr′
.0.8 will not accumulate a significant concentration of electrons. Such
293
sites would accumulate appreciable charge, however, if the temperature were lowered sufficiently.
294
Nevertheless, after 2 Ma all sites are in thermal steady-state ((n/N)SS) and their concentrations 295
will not change until the temperature changes.
296
4.7. Trapping at drill core temperatures
297
Finally, the simulation conducted in Section 4.6 is repeated for the steady-state temperatures
298
experienced by drill core samples J1012, J1026, and J1030 (TSS = -4.1, 19.8, and 55.1 ◦C, respec-299
tively) (Fig. 7c). Ther′
values greater than about 1.48 reach effective saturation (n/N >0.86) after
300
some amount of time (in this example, sites nearer to centers than r′
= 1.48 experience
thermally-301
assisted tunneling at a rate higher than the filling rate). The more stable sites saturate after 800
302
ka, but some of the less stable sites reach saturation later. This is because the detrapping rate is
303
greater for these sites.
Higher mean temperatures result in a trapped population with greater minimum r′
values. In
305
other words, the nearer sites that would be occupied at lower temperatures remain empty at higher
306
temperatures. This trend in site occupancy with temperature can be examined in the measured TL
307
signals from drill core samples, which is discussed in the following section.
308
5. Comparing measured and modeled behaviors 309
5.1. Comparing natural signals to modeled signals
310
The T1/2 values for all drill core natural TL signals are shown as open symbols in Fig. 6b.
311
Also shown as a solid black curve in Fig. 6b are the T1/2 values simulated at natural conditions.
312
To produce these values, we first solve Eq. 1 for the time range t = 0 to 2 Ma at each sample’s
313
burial temperature, TSS. The resulting n(r′) distribution for each sample is evaluated with Eq. 4 314
to determine the TL that would result after burial at TSS for 2 Ma. A remarkable correlation is 315
found, suggesting that the measured relationship between natural T1/2 values and the steady-state
316
temperature is explainable in terms of site stability.
317
5.2. Comparing isothermal decay of TL signals to modeled response
318
TheT1/2values following laboratory irradiation and heat treatment are plotted as open symbols
319
in Fig. 6d. Also plotted are the T1/2 values that are simulated with Eqs. 1 and 4, given the
320
same kinetic parameters used in Fig. 6b. It is encouraging that the same kinetic parameters that
321
reproduce the natural drill core T1/2 values also resemble the high-temperature measurements.
322
This correlation between measured and simulated T1/2 values gets stronger at longer durations
323
and higher temperatures, which may suggest that our model fails to incorporate transient
lumi-324
nescence phenomena occurring at room temperature. Ground-state tunneling is omitted from the
325
current model, but this effect should only decrease the minimum stability distance, shifting theT1/2
326
value higher. This discrepancy deserves further consideration.
327
6. Discussion and Conclusions 328
Thermoluminescence signals from bedrock feldspars show a systematic dependence on ambient
329
temperature. During burial, the electron traps within these crystals were filled according to the
330
stability of each trapping site. Because this stability should depend on the distance to the nearest
331
recombination center, a distribution of trap saturation as a function of distance develops, n(r′
),
332
which characterizes a samples thermal history. In the case of thermal steady-state, some sites
are entirely filled (n/N ∼ 1), some are partially filled, and some remain empty (Fig. 7b). This
334
partially-occupied recombination distance controls the position of theT1/2 measurements shown for
335
the natural signals and for signals following isothermal treatments (Figs. 6b and d).
336
The systematic dependence of natural T1/2 values on ambient temperature (Fig. 6b) coupled
337
with the multiple-additive dose results (Fig. 3) imply that TSS controls trapping site occupancy 338
and therefore the natural shape of feldspar TL, a behavior that can be explained in light of recent
339
advances in our understanding of feldspar luminescence kinetics (e.g., Jain et al., 2015; Pagonis et al.,
340
2016). Within this context, the role of anomalous fading should be considered. In our formulation
341
(Eq. 1), fading is incorporated, though only in the excited-state (i.e., thermally-assisted tunneling).
342
Thermally-activated tunneling can produce the phenomenon of anomalous fading as commonly
343
measured in sediment studies (e.g., a decrease in luminescence intensity after storage at room
344
temperature; Huntley and Lamothe, 2001), though with current parameter values, the magnitude
345
of simulated room temperature fading is much lower than is experimentally observed. The observed
346
fading rate will depend primarily upon the activation energy required to access the excited state,
347
the ambient temperature, the effective frequency factor, and the density of recombination centers.
348
Of particular note is the agreement that we observe between model predictions and measured TL
349
responses following natural and high-temperature laboratory heating conditions (Fig. 6). The same
350
kinetic parameters (Table 2) described in Section 4.2 can be evaluated with Eq. 1 to reproduce the
351
T1/2position resulting from 1000 s at 200
◦
C (T1/2offset by 15
◦
C; Fig. 6d) and thermal steady-state
352
(t&order 105 ka) at -4.1 ◦
C (T1/2 offset by 5
◦
C; Fig. 6b).
353
We emphasize that this model is one of the simplest justifiable models for feldspar luminescence.
354
Additional pathways that could be incorporated in the future might include activation into the
band-355
tail states (up to the conduction band) or ground-state tunneling, both of which have been adopted
356
for IRSL thermochronometry with feldspars (e.g., Guralnik et al., 2015b; King et al., 2016b). The
357
main elements of this kinetic model are identical to those used in Jain et al. (2015) and have
358
been used in that and other studies (Kitis and Pagonis, 2013; Pagonis et al., 2016) to explain
359
both optical and thermal features of feldspar luminescence. Thermoluminescence signals may be
360
preferable over optical luminescence for feldspar thermochronology applications, however, as the
361
full range of thermal stability is monitored during a single TL measurement. Additionally, TL
362
measurements avoid the complications arising from preheating and phototransfer effects.
363
Moving forward, many questions remain to fully develop this method. Does the feldspar TL
re-364
sponse become more sensitive to radiation with prolonged heating or metamorphism? Both the TL
shape change after heating to 500 ◦
C (Brown, 2017) and the observation that the degree of felspar
366
ordering correlates with the degree of fading (p. 189, Aitken, 1985; Visocekas et al., 1994) suggest
367
that peak metamorphic conditions may influence the subsequent rate of charge accumulation. What
368
is the maximum steady-state temperature that can be identified using the leading edge of TL
emis-369
sions? In core W219, the natural TL signals were too low to resolve the T1/2 value atT ≥23.0
◦
C,
370
whereas for core R716, all samples gave useful TL signals, up to the highest temperatures measured:
371
60.2◦
C. How should one handle low-temperature shoulders when identifying the naturalT1/2value?
372
It may be useful to separate shoulders by curve deconvolution, for example. Can we analytically
373
define the closure temperature for a TL age resulting from different geothermal scenarios, or can this
374
only be defined numerically? What is the natural variation for the parameters of Table 2? Efforts
375
are underway currently to explore this variation for both optical and thermal signals in feldspars
376
(Sfampa et al., 2015; Guralnik et al., 2015b; Valla et al., 2016; Brown and Rhodes, 2017). Is
excited-377
state tunneling to randomly-distributed luminescence centers the primary detrapping pathway at
378
geologic conditions? For example, initial simulations of linear cooling scenarios (not shown here)
379
indicate that the TL system presented here may remain in thermal disequilibrium at cooling rates
380
as slow as about 10◦
C/Ma, but this result depends strongly on the parameter values chosen as well
381
as the incorporated recombination pathways.
382
Our results illustrate the potential utility of the feldspar TL signal for geothermal studies. The
383
n(r′
) distribution is sensitive to a wide range of ambient temperatures: −4.1−60.2 ◦
C. This
dis-384
tribution responds to thermally dynamic scenarios as well and initial simulations suggest that the
385
signal should be useful for monitoring rapid exhumation during the Quaternary. This combination
386
of low-temperature sensitivity and measurable signal growth between 102 to 106 years is promising
387
for tectonic and geomorphic applications involving short-wavelength, upper-crustal thermal
pertur-388
bations, and could prove useful in resolving questions of recent bedrock exhumation rates.
389
Acknowledgements 390
We thank Pierre Valla and Benny Guralnik for their insightful comments which have
signifi-391
cantly improved this work. We also thank the USGS Core Research Center for providing drill core
392
subsamples for analysis.
393
References 394
Adamiec, G., Aiken, M., 1998. Dose-rate conversion factors: update. Ancient TL 16, 37–50.
Aitken, M., 1985. Thermoluminescence Dating. Academic Press, London.
396
Aitken, M., Tite, M., Reid, J., 1964. Thermoluminescent dating of ancient ceramics. Nature 202,
397
1032–1033.
398
Bailey, R., 2001. Towards a general kinetic model for optically and thermally stimulated
lumines-399
cence of quartz. Radiation Measurements 33, 17–45.
400
Balescu, S., Lamothe, M., 1992. The blue emission of K-feldspar coarse grains and its potential for
401
overcoming TL age underestimation. Quaternary Science Reviews 11, 45–51.
402
Balescu, S., Lamothe, M., Lautridou, J.P., 1997. Luminescence evidence for two Middle Pleistocene
403
interglacial events at Tourville, northwestern France. Boreas 26, 61–72.
404
Balescu, S., Packman, S.C., Wintle, A.G., 1991. Chronological separation of interglacial raised
405
beaches from northwestern Europe using thermoluminescence. Quaternary Research 35, 95–102.
406
Blackwell, D., Richards, M., Frone, Z., Batir, J., Ruzo, A., Dingwall, R., Williams, M., 2011.
Tem-407
perature at depth maps for the conterminous US and geothermal resource estimates. Geothermal
408
Resources Council Transactions 35, 1545–1550.
409
Brown, N.D., 2017. Using luminescence signals from bedrock feldspars for low-temperature
ther-410
mochronology. Ph.D. thesis. University of California, Los Angeles.
411
Brown, N.D., Rhodes, E.J., 2017. Thermoluminescence measurments of trap depth in alkali feldspars
412
extracted from bedrock samples. Radiation Measurements 96, 53–61.
413
Christodoulides, C., Ettinger, K.V., Fremlin, J.H., 1971. The use of TL glow peaks at equilibrium
414
in the examination of the thermal and radiation history of minerals. Modern Geology 2, 275–280.
415
Cole, F., Bird, K.J., Toro, J., Roure, F., O’Sullivan, P.B., Pawlewicz, M., Howell, D.G., 1997. An
416
integrated model for the tectonic development of the frontal Brooks Range and Colville Basin 250
417
km west of the Trans-Alaska Crustal Transect. Journal of Geophysical Research 102, 20685–20708.
418
Collett, T., Bird, K., Magoon, L., 1993. Subsurface temperatures and geothermal gradients on the
419
North Slope of Alaska. Cold Regions Science and Technology 21, 275–293.
420
Duller, G., 1997. Behavioural studies of stimulated luminescence from feldspars. Radiation
Mea-421
surements 27, 663–694.
Duller, G.A.T., 1994. A new method for the analysis of infrared stimulated luminescence data from
423
potassium feldspars. Radiation Measurements 23, 281–285.
424
Durrani, S., Prachyabrued, W., Christodoulides, C., Fremlin, J., 1972. Thermoluminescence of
425
Apollo 12 samples: Implications for lunar temperature and radiation histories. Proceedings of
426
the Third Lunar Science Conference 3, 2955–2970.
427
Durrani, S., Prachyabrued, W., Hwang, F., Edgington, J., Blair, I., 1973. Thermoluminescence of
428
Apollo 14 and 16 fines and rock samples. Thermoluminescence of some Apollo 14 and 16 fines
429
and rock samples 3, 2465–2479.
430
Durrani, S.A., Khazal, K.A.R., Ali, A., 1977. Temperature and duration of the shadow of a
recently-431
arrived lunar boulder. Nature 266, 411–415.
432
Fall, A., Eichhubl, P., Bodnar, R.J., Laubach, S.E., Davis, J.S., 2015. Natural hydraulic fracturing
433
of tight-gas sandstone reservoirs, Piceance Basin, Colorado. GSA Bulletin 127, 61–75.
434
Fall, A., Eichhubl, P., Cumella, S.P., Bodnar, R.J., Laubach, S.E., Becker, S.P., 2012. Testing
435
the basin-centered gas accumulation model using fluid inclusion observations: Southern Piceance
436
Basin, Colorado. AAPG Bulletin 96, 2297–2318.
437
Fan, M., Quade, J., Dettman, D., DeCelles, P., 2011. Widespread basement erosion during the
438
late Paleocene-early Eocene in the Laramide Rocky Mountains inferred from 87Sr/86Sr ratios of
439
freshwater bivalve fossils. GSA Bulletin 123, 2069–2082.
440
Finn, T.M., 2005. Petroleum systems and geologic assessment of oil and gas in the Southwestern
441
Wyoming Province, Wyoming, Colorado, and Utah. U.S. Geological Survey. chapter Geothermal
442
gradient map of the Southwestern Wyoming Province, southwestern Wyoming, northwestern
443
Colorado, and northeastern Utah.
444
Fleming, S., Moss, H., Joseph, A., 1970. Thermoluminescence authenticity testing of some ‘six
445
dynasty’ figurines. Archaeometry 12, 57–63.
446
Gong, G.L., Li, S.H., Sun, W.D., Guo, F., Xia, B., Lu, B.F., 2010. Quartz thermoluminescence
-447
another potential paleo-thermometer for studies of sedimentary basin thermal history. Chinese
448
Journal of Geophysics 53, 103–112.
Gr¨un, R., Tani, A., Gurbanov, A., Koschug, D., Williams, I., Braun, J., 1999. A new method for the
450
estimation of cooling and denudation rates using paramagnetic centers in quartz: A case study
451
on the Eldzhurtinskiy Granite, Caucasus. Journal of Geophysical Research 104, 17531–17549.
452
Guralnik, B., Ankjaergaard, C., Jain, M., Murray, A., Muller, A., Walle, M., Lowick, S., Preusser,
453
F., Rhodes, E., Wu, T.S., Mathew, G., Herman, F., 2015a. OSL-thermochronometry using
454
bedrock quartz: A note of caution. Quaternary Geochronology 25, 37 – 48.
455
Guralnik, B., Jain, M., Herman, F., Ankjaergaard, C., Murray, A.S., Valla, P.G., Preusser, F.,
456
King, G.E., Chen, R., Lowick, S.E., Kook, M., Rhodes, E.J., 2015b. OSL-thermochronometry of
457
feldspar from the KTB borehole, Germany. Earth and Planetary Science Letters 423, 232 – 243.
458
Guralnik, B., Jain, M., Herman, F., Paris, R.B., Harrison, T.M., Murray, A.S., Valla, P.G., Rhodes,
459
E.J., 2013. Effective closure temperature in leaky and/or saturating thermochronometers. Earth
460
and Planetary Science Letters 384, 209–218.
461
Herman, F., Rhodes, E.J., Braun, J., Heiniger, L., 2010. Uniform erosion rates and relief
am-462
plitude during glacial cycles in the Southern Alps of New Zealand, as revealed from
OSL-463
thermochronology. Earth and Planetary Science Letters 297, 183–189.
464
Hoyt, H., Miyajima, M., Walker, R., Zimmerman, D., Zimmerman, J., 1971. Radiation dose rates
465
and thermal gradients in the lunar regolith: Thermoluminescence and DTA of Apollo 12 samples.
466
Proceedings of the Second Lunar Science Conference 3, 2245–2263.
467
Hoyt, H.P., Kardos, J.L., Miyajima, M., Seitz, M.G., Sun, S.S., Walker, R.M., Wittels, M.C., 1970.
468
Thermoluminescence, X-ray and stored energy measurements of Apollo 11 samples. Proceedings
469
of the Apollo 11 Lunar Science Conference 3, 2269–2287.
470
Huntley, D., Baril, M., 1997. The K content of the K-feldspars being measured in optical dating or
471
in thermoluminescence dating. Ancient TL 15, 11–13.
472
Huntley, D.J., 2006. An explanation of the power-law decay of luminescence. Journal of Physics:
473
Condensed Matter 18, 1359–1365.
474
Huntley, D.J., Lamothe, M., 2001. Ubiquity of anomalous fading in K-feldspars and the
measure-475
ment and correction for it in optical dating. Canadian Journal of Earth Sciences 38, 1093–1106.
476
Irwin, D., 1977. Subsurface cross-sections of Colorado. Rocky Mountain Association of Geologists.
Jagniecki, E.A., Jenkins, D.M., Lowenstein, T.K., Carroll, A.R., 2013. Expermental study of shortite
478
(Na2Ca2(CO3)3) formation and application to the burial history of the Wilkins Peak Member,
479
Green River Basin, Wyoming, USA. Geochemica et Cosmochimica Acta 115, 31–45.
480
Jain, M., Ankjaergaard, C., 2011. Towards a non-fading signal in feldspar: Insight into charge
481
transport and tunnelling from time-resolved optically stimulated luminescence. Radiation
Mea-482
surements 46, 292–309.
483
Jain, M., Guralnik, B., Andersen, M.T., 2012. Stimulated luminescence emission from localized
484
recombination in randomly distributed defects. Journal of Physics: Condensed Matter 24, 385402.
485
Jain, M., Sohbati, R., Guralnik, B., Murray, A., Kook, M., Lapp, T., Prasad, A., Thomsen, K.,
486
Buylaert, J., 2015. Kinetics of infrared stimulated luminescence from feldspars. Radiation
Mea-487
surements 81, 242–250.
488
Kars, R., Wallinga, J., Cohen, K., 2008. A new approach towards anomalous fading correction for
489
feldspar IRSL dating–tests on samples in field saturation. Radiation Measurements 43, 786–790.
490
King, G., Guralnik, B., Valla, P.G., Herman, F., 2016a. Trapped-charge thermochronometry and
491
thermometry: A status review. Chemical Geology 446, 3–17.
492
King, G., Herman, F., Lambert, R., Valla, P., Guralnik, B., 2016b. Multi-OSL-thermochronometry
493
of feldspar. Quaternary Geochronology 33, 76–87.
494
King, G.E., Herman, F., Guralnik, B., 2016c. Northward migration of the eastern himalayan
495
syntaxis revealed by OSL thermochronometry. Science 353, 800–504.
496
Kitis, G., Pagonis, V., 2013. Analytical solutions for stimulated luminescence emission from
tun-497
neling recombination in random distributions of defects. Journal of Luminescence 137, 109–115.
498
Li, B., Li, S.H., 2012. Determining the cooling age using luminescence-thermochronology.
Tectono-499
physics 580, 242–248.
500
McKeever, S.W.S., 1985. Thermoluminescence of solids. Cambridge University Press, Cambridge.
501
Mejdahl, V., 1983. Feldspar inclusion dating of ceramics and burnt stones, in: Third Specialist
502
Seminar on TL and ESR Dating.
503
Mejdahl, V., 1985. Thermoluminescence dating based on feldspars. Nuclear Tracks and Radiation
504
Measurments 10, 133–136.
Mull, C., Roeder, D., Tailleur, I., Pessel, G., Grantz, A., May, S., 1987. Geologic sections and maps
506
across Brooks Range and Artic Slope to Beaufort Sea, Alaska. Geological Society of America.
507
Murray, A., Buylaert, J., Thomsen, K., Jain, M., 2009. The effect of preheating on the IRSL signal
508
from feldspar. Radiation Measurements 44, 554–559.
509
Nambu, M., Mikami, K., Tsuchiya, N., Nakatsuka, K., 1996. Thermoluminescence of quartz in
510
the borehole cores from the Minase Geothermal area, Akita Prefecture, Japan. Journal of the
511
Geothermal Research Society of Japan 18, 39–49.
512
Pagonis, V., Ankjaergaard, C., Jain, M., Chithambo, M.L., 2016. Quantitative analysis of
time-513
resolved infrared stimulated luminescence in feldspars. Physica B 497, 78–85.
514
Plachy, A., Sutton, S., 1982. Determination of the dose-rate to quartz in granite, in: PACT, AATA.
515
pp. 188–194.
516
Prokein, J., Wagner, G., 1994. Analysis of thermoluminescent glow peaks in quartz derived from
517
the KTB-drill hole. Radiation Measurements 23, 85–94.
518
Rhodes, E., 2015. Dating sediments using potassium feldspar single-grain IRSL: initial
methodolog-519
ical considerations. Quaternary International 362, 14–22.
520
Roehler, H.W., 1992. Correlation, composition, areal distribution, and thickness of Eocene
strati-521
graphic units, Greater Green River Basin, Wyoming, Utah, and Colorado. Geology of the
522
Eocene Wasatch, Green River, and Bridger (Washakie) Formations, Greater Green River Basin,
523
Wyoming, Utah, and Colorado, U.S. Geological Survey.
524
Sarkar, S.D., Mathew, G., Pande, K., Chauhan, N., Singhvi, A., 2013. Rapid denudation of higher
525
Himalaya during Late Pliestocene, evidence from OSL thermochronology. Geochronometria 40,
526
304–310.
527
Schmidt, C., Friedrich, J., Z¨oller, L., 2015. Thermochronometry using red TL of quartz? Numerical
528
simulation and observations from in-situ drill-hole samples. Radiation Measurements 81, 98–103.
529
Sfampa, I., Polymeris, G., Pagonis, V., Theodosoglou, E., Tsirliganis, N., Kitis, G., 2015.
Correla-530
tion of basic TL, OSL and IRSL properties of ten K-feldspar samples of various origins. Nuclear
531
Instruments and Methods in Physics Research B 359, 89–98.
Smith, M., Carroll, A., Singer, B., 2008. Synoptic reconstruction of a major ancient lake system:
533
Eocene Green River Formation, western United States. GSA Bulletin 120, 54–84.
534
Spencer, J.Q., Sanderson, D.C.W., 1994. Mapping thermal exposure by luminescence thermometry.
535
Radiation Measurements 23, 465–468.
536
Spencer, J.Q.G., Sanderson, D.C.W., 2012. Decline in firing technology or poorer fuel resources?
537
high-temperature thermoluminscence (httl) archaeothermometry of neolithic ceramics from pool,
538
sanday, orkney. Journal of Archaeological Science 39, 3542–3552.
539
Strickertsson, K., 1985. The thermoluminescence of potassium feldspars–glow curve characteristics
540
and initial rise measurements. Nuclear Tracks and Radiation Measurements 10, 613–617.
541
Tang, S.L., Li, S.H., 2015. Low temperature thermochronology using thermoluminescence signals
542
from quartz. Radiation Measurements 81, 92–97.
543
Tsuchiya, M., Atsusue, T., Sakaki, H., 1987. Tunneling escape rate of electrons from quantum well
544
in double-barrier heterostructures. Physical Review Letters 59, 2356–2359.
545
Tsuchiya, N., Fujino, K., 2000. Evaluation of cooling history of the Quaternary Takidani pluton
546
using thermoluminescence technique, in: Proceedings of the World Geothermal Congress, pp.
547
3939–3944.
548
Tsuchiya, N., Suzuki, T., Nakatsuka, K., 2000. Thermoluminescence as a new research tool for the
549
evaluation of geothermal activity of the Kakkonda geothermal system, northeast Japan.
Geother-550
mics 29, 27–50.
551
Valla, P.G., Lowick, S.E., Herman, F., Champagnac, J.D., Steer, P., Guralnik, B., 2016. Exploring
552
IRSL50 fading variability in bedrock feldspars and implications for OSL thermochronometry.
553
Quaternary Geochronology 36, 55–66.
554
Valladas, H., Valladas, G., 1987. Thermoluminescence dating of burnt flint and quartz: Comparative
555
results. Archaeometry 29, 214–220.
556
Visocekas, R., Spooner, N., Zink, A., Blanc, P., 1994. Tunnel afterglow, fading and infrared emission
557
in thermoluminescence of feldspars. Radiation Measurements 23, 377–385.
558
Wintle, A., Huntley, D., 1982. Thermoluminescence dating of sediments. Quaternary Science
559
Reviews 1, 31–53.
Wintle, A., Murray, A., 2006. A review of quartz optically stimulated luminescence characteristics
561
and their relevance in single-aliquot regeneration dating protocols. Radiation Measurements 41,
562
369–391.
563
Ypma, P., Hochman, M., 1991. Thermoluminescence geothermometry - a case study of the Otway
564
Basin. The Australian Petroleum Exploration Association Journal 35, 312–324.
565
Zhang, E., Hill, R.J., Katz, B.J., Tang, Y., 2008. Modeling of gas generation from the Cameo coal
566
zone in the Piceance Basin, Colorado. AAPG Bulletin 92, 1077–1106.
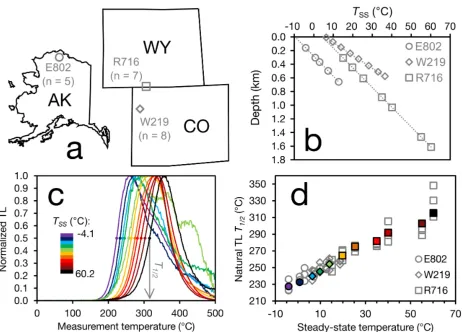
Figure 1: (a) Bedrock sample locations are shown for each of the three USGS CRC drill core sites: E802, W219, and R716. (b) Also shown are the steady-state temperatures for the drill core samples, according to their depths. (c) Representative natural TL signals are colored according to their steady-state temperature, TSS. The T1/2 values for these TL curves (normalized to maximum intensity) are shown as solid circles in
(c) and are plotted as a function ofTSS in (d). The colored symbols in (d) derive from the TL curves shown
in (c). The grey symbols represent all of the measured T1/2values, i.e., every aliquots for every sample (see
[image:25.612.77.539.179.511.2]Figure 2: The natural TL signals are plotted by drill core and colored according to the steady-state temper-ature, TSS (four aliquots
are shown per sample). Missing data points within a TL curve signify that the thermal background curve (TL measured after the natural signal and with no dose) at that time bin is larger than the natural signal. Notice the shift in the leading edge and the decreasing brightness as the natural TSS value
Figure 3: (a) The glow curve shown in blue is a natural aliquot of sample J1012 (TSS = −4.1◦C; core
E802) (β = 5 ◦C/s; the thermal background has been subtracted, so some data points are missing). In
red is the TL curve of another aliquot of J1012 that has been given a dose of 242.2 Gy in addition to the natural dose. Notice that the low-temperature portion of the TL glow curve grows with dose, whereas no growth occurs above about 250 ◦C. The same measurements are shown for (b) two aliquots of J1030
(TSS = 55.1◦C; core R716). (c) The ratios of the natural response to the added-dose response are plotted
as a function of measurement temperature for both samples. A ratio of 1 (dashed line) indicates that the sample is in complete field saturation. Notice how the colder sample is nearly saturated (ratio ∼0.95) at lower measurement temperatures and saturation occurs at higher measurement temperatures for the sample with a higher burial temperature. Above about 375 ◦C, we see a slight rise in the ratio, which may be
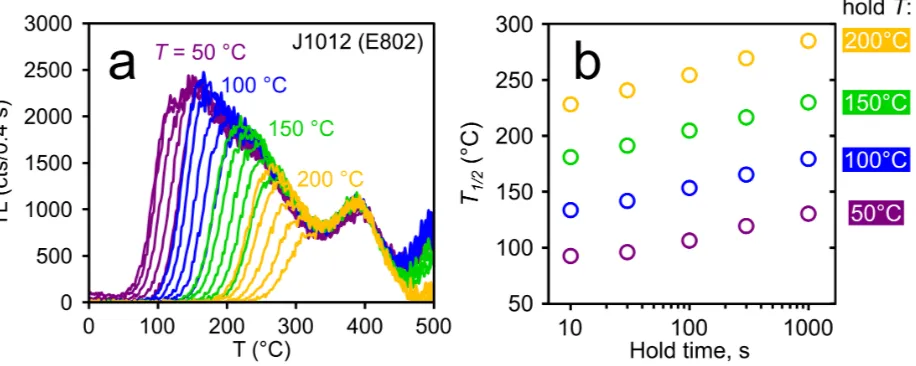
[image:27.612.85.539.269.382.2]Figure 4: (a) Measured TL curves are shown for sample J1012 (core E802), following isothermal treatments of durations 10, 30, 100, 300, and 1000 s at holding temperatures of 50 (purple curves), 100 (blue), 150 (green), and 200 ◦C (orange). (b) The T1
/2 values of these measurements are plotted as a function of hold
time and colored according to hold temperature. Notice the shift towards higherT1/2values with longer hold
[image:28.612.80.538.271.454.2]Figure 5: (a) Single-aliquot regenerative (SAR) dose-response measurements of sample J1012 are fitted to a single saturating exponential function. The three TL channels plotted here (230, 270, and 310◦C) represent
the observed range of natural T1/2 values. The fitted D0 values at increasing measurement temperatures
decrease from 1.70 to 1.34 kGy. (b) The isothermal thermoluminescence (ITL) decay data from sample J1012 following a beta dose of 121 Gy are plotted for a hold time of 400 s at hold temperatures of T = 250, 300, and 350◦C. These decays are fitted to the expression for isothermal decay (Eq. 6) from Jain et al.
(2015)(‘J+15’), using the parameters listed in Table 2 and varying only the initial population (n0) and the
[image:29.612.77.540.251.436.2]Figure 6: (a) Starting with empty traps, Eq. 1 is solved for isothermal geologic histories. The trapped populations at the final times then become the initial condition for another evaluation of Eq. 1 representing the TL measurement. These are the plotted curves. (Note that after 2 Ma,n/N ∼1 for the most stable traps). (b) This simulation is repeated for each of the steady-state temperature values and the resulting TLT1/2values
(solid curve) are compared to the measuredT1/2values (open symbols). (c) Instead of reproducing a geologic
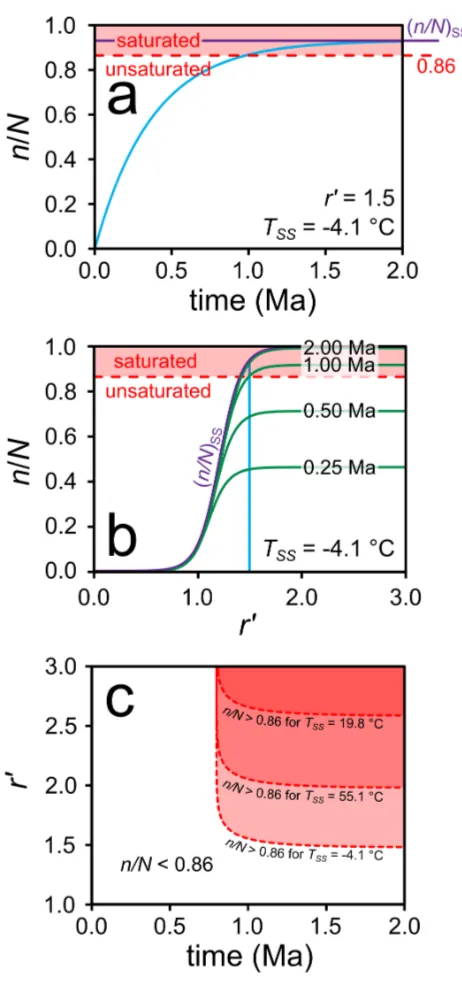
[image:30.612.74.540.158.507.2]Figure 7: (a) For an arbitrary recombination dis-tance ofr′ = 1.5, trap filling is simulated for 2 Ma
at -4.1◦C (TSS for J1012) by assuming an initially
emptyn(r′) distribution that evolves with time
ac-cording to Eq. 1. After about 1 Ma, the sites at this distance are effectively saturated. Notice that in steady-state at this temperature, not all of the traps will be full, even though they are in steady-state. We illustrate this steady-state limit ((n/N)SS) with
a purple line. This represents the upper-limit for the concentration of trapped electrons at this tem-perature. (b) This process is then shown for a range of recombination distances within a lattice, at the same constant temperature (T = 4.1◦C). The sites
[image:31.612.71.302.70.570.2]