This is a repository copy of Transcriptome-based identification of the optimal reference CHO genes for normalisation of qPCR data.
White Rose Research Online URL for this paper: http://eprints.whiterose.ac.uk/120973/
Version: Accepted Version
Article:
Brown, A.J., Gibson, S., Hatton, D. et al. (1 more author) (2017) Transcriptome-based identification of the optimal reference CHO genes for normalisation of qPCR data. Biotechnology Journal. ISSN 1860-6768
https://doi.org/10.1002/biot.201700259
[email protected] https://eprints.whiterose.ac.uk/
Reuse
Items deposited in White Rose Research Online are protected by copyright, with all rights reserved unless indicated otherwise. They may be downloaded and/or printed for private study, or other acts as permitted by national copyright laws. The publisher or other rights holders may allow further reproduction and re-use of the full text version. This is indicated by the licence information on the White Rose Research Online record for the item.
Takedown
If you consider content in White Rose Research Online to be in breach of UK law, please notify us by
1 Biotech Method
Transcriptome-based identification of the optimal reference CHO genes for
normalisation of qPCR data
Adam J. Brown1, Suzanne Gibson2, Diane Hatton2, David C. James1*
1
Department of Chemical and Biological Engineering, University of Sheffield, University of
Sheffield, Mappin St., Sheffield, S1 3JD, England
2
Biopharmaceutical Development, MedImmune, Cambridge, CB21 6GH, England
*Corresponding author: David C. James, Department of Chemical and Biological
Engineering, University of Sheffield, Mappin St., Sheffield, S1 3JD
telephone: +44-(0)114-222-7505, Email: [email protected]
Keywords: Chinese hamster ovary cells, qPCR, Gene expression, Reference genes,
Expression stability.
Abbreviations: CHO = Chinese hamster ovary; CV = coefficient of variation; Ct = cycle
threshold; MFC = maximum fold change; qPCR = quantitative polymerase chain reaction;
2 Abstract
Real-time quantitative PCR (qPCR) is the standard method for determination of relative
changes in mRNA transcript abundance. Analytical accuracy, precision, and reliability are
critically dependent on the selection of internal control reference genes. In this study we have
identified optimal reference genes that can be utilized universally for qPCR analysis of CHO
cell mRNAs. Initially, transcriptomic datasets were analysed to identify eight endogenous
genes that exhibited high expression stability across four distinct CHO cell lines sampled in
different culture phases. The relative transcript abundance of each gene in twenty diverse,
commonly-applied experimental conditions was then determined by qPCR analysis. Utilizing
GeNorm, BestKeeper, and NormFinder algorithms, we identified four mRNAs (Gnb1,
Fkbp1a, Tmed2 and Mmadhc) that exhibited a highly stable level of expression across all
conditions, validating their utility as universally-applicable reference genes. Whilst any
combination of only two genes can be generally used for normalization of qPCR data, we
show that specific combinations of reference genes are particularly suited to discrete
experimental conditions. In summary we report the identification of fully-validated universal
reference genes, optimized primer sequences robust to genomic mutations, and simple
reference gene pair selection guidelines that enable streamlined qPCR analyses of mRNA
3 1. Introduction
Real-time quantitative PCR (qPCR) is the standard method of choice for determining relative
changes in gene expression at the transcriptional level. In Chinese hamster ovary (CHO) cell
research it is routinely utilized to, for example, evaluate relative clone performance,
determine expression stability, test the functionality of genetic components, and identify
mechanistic bases of phenotypic variation (e.g. [1-4]). Accordingly, for this
industrially-important cell type, qPCR is a commonly-used core technique, where accuracy and precision
are of critical importance.
Accurate relative quantification of gene expression by qPCR is dependent on a
normalization strategy to correct for sample-to-sample variations in RNA quantity, RNA
integrity, and reverse-transcriptase efficiency [5-7]. Typically, this is achieved by
normalizing the expression of genes of interest to that of internal control reference genes.
Accordingly, the quality of qPCR data is critically dependent on the ‘quality’ of reference
genes used. However, despite the publication of the MIQE guidelines [8], and frequent
reminders of the importance of reference gene selection (e.g. [9]), unvalidated, sub-optimal
reference genes are still commonly utilized [10-12].
An ideal reference gene exhibits consistent expression levels across all experimental
conditions of interest (e.g. cell types, physiological states, growth conditions). However,
previous studies suggest that such ideal universal reference genes do not exist, necessitating
the use of reference gene combinations specific to different experimental systems. Indeed, it
has been shown that many commonly utilized, historically-popular reference genes (e.g.
Gapdh, Actb) display divergent expression levels dependent on experimental conditions
[13-17]. Unsurprisingly, the universal application of these traditional ‘housekeeping genes’ can
lead to significant errors in data interpretation. Accordingly, it is essential to identify and
4
followed for many diverse cell-types and experimental setups [18-21]. Whilst useful
reference genes have been previously identified in CHO cells [22], in this study we
significantly improve upon previous work through the use of RNA-seq transcriptomic
datasets to identify novel, optimal reference genes and genomic sequence analysis to design
primers that are robust across all CHO cell lineages. We validate reference gene performance
in previously untested experimental conditions and identify specific, optimal reference gene
combinations for commonly applied experimental designs, maximising analytical accuracy
and precision. We provide simple guidelines for the selection of fully-validated,
5 2. Materials and methods
RNA-seq analysis of CHO cell transcriptomes and candidate reference gene selection
Two distinct transcriptomic datasets were separately generated and analyzed. Total RNA was
extracted from 1.) three CHO cell lines (CAT-S, derived from CHOK1 by MedImmune;
CAT-S clone expressing glutamine synthetase; CAT-S clone expressing a monoclonal
antibody and glutamine synthetase) during exponential and stationary phases of growth
(dataset 1; six experimental conditions), and 2.) a single CHO cell line (CHO-S clone
expressing a monoclonal antibody) during lag, exponential, and stationary phases of growth
(dataset 2; three experimental conditions). For each experimental condition, RNA was
extracted from 5 x 10⁶ viable cells (two technical replicates) using RNAeasy mini kits
(Qiagen, Crawley, UK). RNA purity and integrity were confirmed using a NanoDrop
spectrophotometer (Thermo Fisher Scientific, Paisley, UK) and 2100 Bioanalyzer (Agilent
Technologies, Wokingham, UK). RNA-seq libraries were prepared using the TruSeq RNA
library preparation kit (Illumina, Essex, UK) and sequenced using an Illumina HiSeq 2000
system (Illumina). For each dataset, all libraries were indexed and sequenced simultaneously
(i.e. dataset 1 comprised two technical replicates of six conditions = twelve libraries).
Sequence reads were mapped to the CHO-K1 reference genome using Tophat [23, 24], and
the relative abundance of each transcript was calculated using Cufflinks [25]. Genes with
mean expression levels above the 80th percentile were selected, and the coefficient of
variation (CV%; standard deviation/mean) and maximum fold change (MFC; highest
expression level/lowest expression level) of each gene were calculated in both datasets. The
five genes with highest expression stability across the experimental conditions (i.e. lowest
CV% and MFCs), along with the three highest ranking ‘traditional housekeepers’ [26], were
6
Due to confidentiality restrictions, RNA-seq data from proprietary CHO cell lines
cannot be deposited in public databases. However, the datasets can be obtained from the
authors for non-commercial research purposes upon acceptance of a material transfer
agreement.
Primer design and validation
Chinese hamster, CHO-K1, and murine gene sequences were aligned using Clustal [27], and
primers were designed to amplify conserved regions. Using Primer-BLAST [28], primers
were designed to span exon-exon boundaries and anneal at 60°C (Table 2). Primers were
synthesized (Sigma, Poole, UK) and amplification efficiencies were determined from
standard curves (10-fold serial dilutions of pooled cDNA samples) using the equation E = 10
(–1/slope) (Table 2). Primer specificities were confirmed by agarose gel electrophoresis,
melting curve analysis, and direct sequencing of qPCR products.
Cell culture and sampling conditions
All CHO cell lines were routinely cultured in CD-CHO medium (Thermo Fisher Scientific,
Paisley, UK) at 37°C in 5% (v/v) CO2 in vented Erlenmeyer flasks (Corning, UK), shaking at
140 rpm, and subcultured every 3-4 days at a seeding density of 2 x 10⁵ cells/ml. Cell
concentration and viability were determined by an automated Trypan Blue exclusion assay
using a Vi-Cell cell viability analyser (Beckman-Coulter, High Wycombe, UK). Clonal,
recombinant protein-expressing cell lines were constructed under MSX (Sigma) selection in
the glutamine synthetase expression system. CHO-S derived cell lines evolved over 200
generations were obtained from A. Fernandez-Martell [29]. Cell-line specific RNA samples
were obtained from exponentially growing cultures in Erlenmeyer flasks. Cell culture
24-7
well plates (static culture; Nunc, Stafford, UK), 96-well plates (shaking culture; Nunc),
mini-bioreactors (shaking growth; Sartorius, Epsom, UK), and 125-ml Erlenmeyer flasks (shaking
culture; Thermo Fisher Scientific). Experimental technique-specific samples were harvested
from i) cells transfected with DNA-lipid complexes comprising DNA and Lipofectamine
(Thermo Fisher Scientific), prepared according to the manufacturer’s instructions, ii) cells
electroporated with DNA using the Amaxa Nucleofector (Lonza; program U024), and iii)
cells cultured at 32°C. All samples were collected in triplicate.
RNA extraction, reverse transcription, and qPCR analysis
Total RNA was extracted from cells using RNeasy mini kits (Qiagen, Crawley, UK). RNA
purity was confirmed by measuring 260 : 230 nm and 260 : 280 nm absorbance ratios using a
NanoDrop spectrophotometer (Thermo Fisher Scientific). RNA integrity was confirmed
using a Bioanalyzer (Agilent Technologies, Wokingham, UK) and agarose gel
electrophoresis. 800 ng of extracted RNA was reverse transcribed using the Quantitect
reverse transcription kit (Qiagen), according to manufacturer’s instructions (genomic DNA
was eliminated during this procedure). cDNA was diluted 1: 10 in nuclease free water prior to
qPCR analysis using a 7500 fast real-time PCR system (Applied Biosystems, Cheshire, UK).
Reaction mixtures containing 12.5 µl QuantiFast SYBR green PCR master mix (Qiagen), 2
µl cDNA, 2.5 µl primer mix (final concentration of 200 nM per primer), and 8 µl nuclease
free water were prepared in MicroAmp fast optical 96-well plates (Applied Biosystems).
Amplification conditions were as follows: 95°C for 5 min, followed by 40 cycles at 95°C for
15 s and 60°C for 60 s. Melting curve analysis was performed from 60 – 95°C. Reaction
mixtures containing no template, or products from reverse transcription reactions performed
in the absence of reverse transcriptase, were used as negative controls. All samples were run
8
Analysis of gene expression stability
Reference gene expression stabilities across varying experimental conditions were analysed
using GeNorm ([30]; https://genorm.cmgg.be/), NormFinder ([31];
http://moma.dk/normfinder-software), and BestKeeper ([32];
9 3. Results and discussion
In silico identification of candidate reference genes
In order to identify potential reference genes, we analysed two transcriptomic datasets,
derived from RNA-seq analyses of 1.) three discrete CHO cell lines (CAT-S, a CAT-S clone
expressing glutamine synthetase, and a CAT-S clone expressing glutamine synthetase and a
monoclonal antibody) in two different growth phases (exponential and stationary), and 2.) a
further CHO cell line (CHO-S clone expressing a monoclonal antibody) in three distinct
growth phases (lag, exponential, and stationary). Ideally reference gene expression levels are
similar to those of the gene(s) of interest. Therefore, given that the majority of qPCR studies
in CHO cells measure expression of strongly-expressed recombinant genes, we focussed our
search for reference gene candidates on relatively highly-expressed endogenous genes
(expression levels > the 80th percentile). Genes were ranked according to expression stability
across all experimental conditions in both datasets, as measured by both coefficient of
variation (CV%) and maximum fold change (MFC; fold change between the largest and
smallest expression values within the dataset).
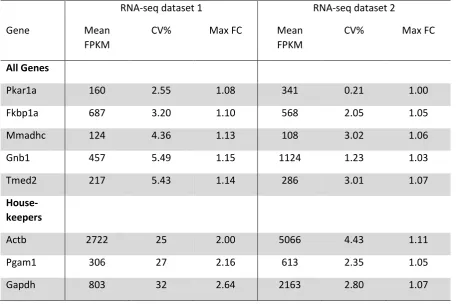
As shown in Table 1, the five top ranked genes exhibited very high expression
stability across the experimental conditions tested, having CVs < 5.5%, and MFCs < 1.16 in
both datasets. Accordingly, these genes (Pkar1a, Fkbp1a, Mmadhc, Gnb1, Tmed2) were
identified as ideal reference gene candidates for qPCR analyses in CHO cells. We also
determined the expression stability of commonly-used ‘traditional housekeepers’ [26]. The
three highest ranking housekeepers (Actb, Pgam1, Gapdh) exhibited significantly lower
expression stabilities (CVs > 25%, MFCs > 2) than the top-ranked genes. Accordingly, we
hypothesized that the five newly-identified candidates would have superior reference gene
performance across diverse experimental conditions in CHO cells. However, for comparison,
10
note that all genes had significantly higher CVs in dataset 1 compared to dataset 2,
presumably due to the increased number of experimental conditions tested (6 > 3).
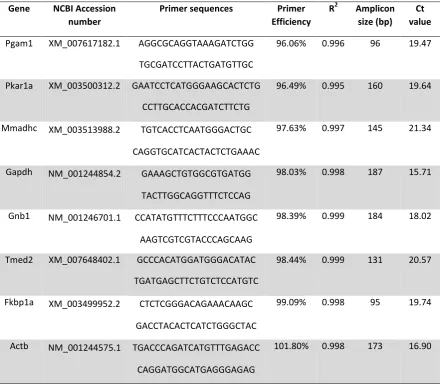
Optimized qPCR primers were designed for each of the eight candidate reference
genes using Primer-BLAST [28]. Given that CHO cells are prone to genetic changes (e.g. via
genetic drift and DNA replication errors [33-35]), we designed primers to target sequence
regions that are conserved between mouse, chinese hamster [36], and CHO-K1 [24] genomes
(see Table 2 for primer sequences). We reasoned that these regions will be less susceptible to
genetic changes, and accordingly that our primers will be robust across diverse CHO cell
lineages and experimental setups. Further, to facilitate the use of reference gene combinations
in high-throughput qPCR analysis, all primers were designed to amplify targets at a unified
annealing temperature (60°C). Specificity and acceptable amplification efficiency (96 -
102%; Table 2) was confirmed for each primer pair by melt curve and standard curve
analysis respectively.
Gnb1, Fkbp1a, Mmadhc, and Tmed2 exhibit very high expression stability across all
experimental conditions
To identify reference genes that can be utilized for the vast majority of experimental designs
we profiled the expression level of each candidate gene in a wide variety of diverse,
commonly-applied experimental conditions (Figure 1). Samples included nine discrete CHO
cell lines that had been subjected to cloning, selection and directed evolution processes. With
respect to the latter, these cell lines had been maintained in culture for over 200 generations,
and accordingly enabled a direct assessment of the hypothesis that our designed primers
target sequence regions that are robust to genetic drift. Moreover, they provided a direct
measurement of the impact of cell culture age (i.e. passage number) on reference gene
11
exponential, early stationary, late stationary), cell culture environments (e.g. shaking culture,
static culture, mini-bioreactors), and commonly used techniques (e.g. electroporation,
lipofection, cold-shock). Collectively, these conditions cover the majority of experimental
manipulations that are used in qPCR studies employing CHO cells, providing a
comprehensive assessment of candidate reference gene functionality.
The relative transcript abundance of candidate reference genes in 20 discrete CHO
cell samples (Figure 1) was determined by qPCR analysis. To evaluate gene expression
stabilities across the entire dataset we utilized three distinct, commonly-applied software
packages. These three algorithms (GeNorm [30], NormFinder [31], BestKeeper [32]) use
different methods to measure gene expression stability. NormFinder uses a linear mixed
effects model to estimate expression variation, GeNorm calculates the mean pairwise
variation for each gene compared to all other candidates (M), and BestKeeper uses Ct values
to calculate descriptive statistics such as standard deviation (SD) and CV. Whilst they
generally provide very similar results, to account for the relative strengths and weaknesses of
each method, they are typically utilized in combination to assess candidate reference gene
suitability [37, 38]. Each tool provides a ranking of candidate reference gene performance
according to expression stability (S) values (NormFinder), M values (GeNorm) and SDs
(BestKeeper), where values greater than 0.5, 0.5 and 1 respectively are considered indicators
of unstable expression.
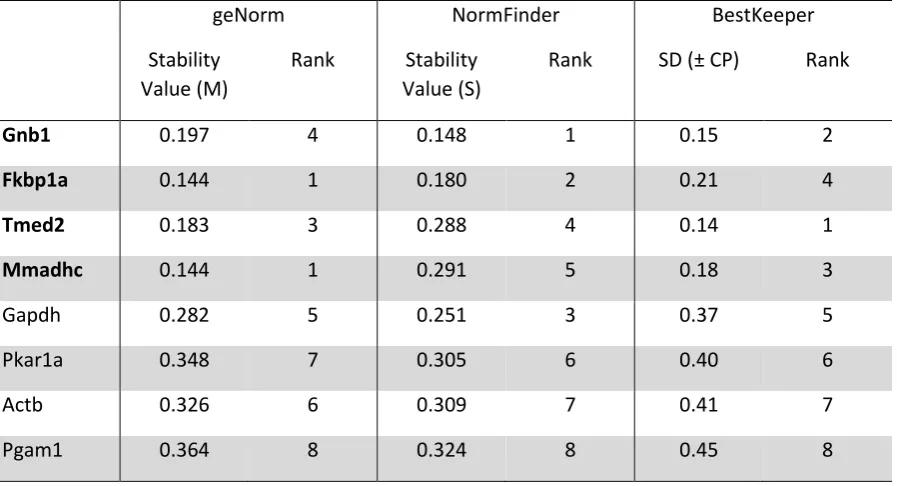
As shown in Table 3, whilst there was no absolute consensus between the three
methods, gene rankings were similar for each algorithm and four genes were clearly
identified as having higher expression stability than the other candidates. Gnb1, Fkbp1a,
Tmed2 and Mmadhc were identified as the four most stably expressed genes by both
GeNorm and Bestkeeper (in different ranking orders; Table 3), and ranked as four of the top
12
software package. Moreover, the relative stability values calculated for these genes were
significantly lower (i.e. indicating greater expression stability) than those of the four
remaining candidate genes (Gapdh, Pkar1a, Actb, Pgam1). For example,
Bestkeeper-calculated SDs and GeNorm M values ranged from 0.14 – 0.21 and 0.144 – 0.197
respectively for the top four genes, compared to 0.37 – 0.45 and 0.282 – 0.364 for the bottom
four genes. Indeed, GeNorm M values highlight the clear separation of the candidate genes
into two distinct groups, as only genes with M values below 0.2 are considered to have ‘very
high’ expression stability [39]. These findings are therefore largely in line with our original
RNA-seq results (which only profiled relative expression levels in four distinct cell lines and
three different growth phases), where the top five ranked genes (including Pkar1a) had
significantly higher expression stabilities than classical “housekeepers”. Accordingly, our
results i) validated that traditional housekeeping genes, specifically Gapdh, Actb and Pgam1,
are suitable reference genes for qPCR analyses in CHO cells (i.e. all three have acceptable
expression stabilities, as evidenced by M values < 0.5, S values < 0.5, and SDs < 1), but ii)
determined that four newly-identified genes with significantly higher expression stabilities
offer superior reference gene performance, and, importantly iii) showed that these four genes
exhibit stable expression across a wide range of commonly-used experimental conditions,
potentially enabling a universal combination of reference genes to be utilized for all qPCR
studies. With respect to the latter, GeNorm can be used to determine the optimal number of
reference genes required for accurate data normalization by calculating the pairwise variation
(Vn/n+1) between sequential normalization factors (NFn and NFn+1) (as described in [30]).
Analysing the entire dataset, V2+3 is calculated to be 0.063 (V3+4 = 0.046), well below the
proposed cut-off value of 0.15, indicating that only two of the identified reference genes are
13 Identifying optimal reference gene-pair combinations for any qPCR study in CHO cells
To both i) further confirm that a universal set of reference genes can be utilized generically
for qPCR experiments in CHO cells, and ii) identify specific, optimal combinations of
reference genes for discrete experimental setups, we analysed gene expression stability in
distinct conditions individually. To rigorously test candidate reference gene performance in
each specific condition, we profiled gene expression levels in all nine discrete cell lines (see
Figure 1) following electroporation, lipofection, and cold-shock. Further, we investigated
gene expression levels in each growth phase (lag, exponential, early stationary, late
stationary) in three different host cell lines (CAT-S, CHO-S, CHO-K1). Late stationary phase
RNA samples were taken from cells that had not divided for > 3 days, providing a direct
measurement of reference gene expression stability in ‘old cells’. Table 4 shows the results
from analysing each individual dataset with GeNorm, BestKeeper and NormFinder. Gnb1,
Fkbp1a, Tmed2 and Mmadhc exhibited very high expression stability in all experimental
conditions, having M values < 0.23, S values < 0.25 and SDs < 0.32 in all five datasets.
Accordingly, these data conclusively show that all four genes exhibit constant expression
levels across diverse experimental conditions, and are therefore ‘ideal’ reference genes that
can be universally-applied in qPCR analyses (whilst we predict that their expression will be
similarly stable in more unusual experimental conditions not tested here, their performance in
such systems should be validated before use). Although we specifically selected candidate
reference genes with relatively high expression levels in order to enable optimal
normalization of strongly-expressed recombinant gene mRNA transcript abundances, Gnb1,
Fkbp1a, Tmed2 and Mmadhc will also be suitable for studies measuring expression of
endogenous CHO genes. In each of the RNA samples that we analyzed by RNA-seq, the log2
fold change between the highest expressed reference gene and median gene expression levels
14
expressed to prevent accurate normalization of most endogenous gene transcript abundances
in qPCR analyses.
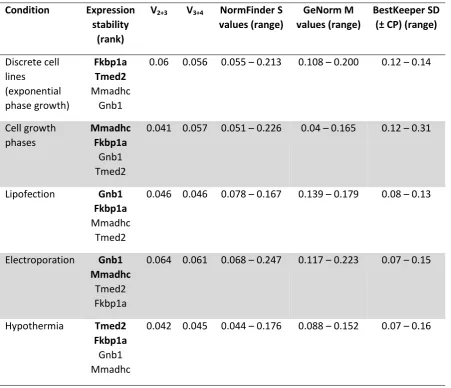
As shown in Table 4, specific optimal combinations of reference genes were
identified for different experimental conditions, where V2+3 was < 0.07 for each dataset. For
example, our findings indicate that Gnb1+Mmadhc and Gnb1+Fkbp1a are ideal reference
gene selections when quantifying gene expression by qPCR following electroporation and
lipofection respectively. Whilst the four newly-identified, universally-applicable reference
genes all exhibit highly stable expression in each experimental system, utilizing the most
stably expressed gene pair for each condition will optimize both accuracy and precision.
Accordingly, the use of condition-specific gene pairs may decrease the minimum detectable
fold-change in gene expression levels. Therefore, based on our findings, we suggest the
following simple rules for reference gene selection for qPCR analyses in CHO cells:
1. Routinely use the same reference gene pair for all studies (we recommend Gnb1 and
Fkbp1a, but Tmed2 and Mmadhc are also applicable; see Table 3).
2. When maximum accuracy is required (e.g. detecting fold changes < 1.5), use
condition-specific reference gene combinations according to Table 4.
3. If conditions are significantly different to those tested in this study (see Figure 1), validate
the performance of Gnb1, Fkbp1a, Tmed2 and Mmadhc in the experimental system, and use
genes that exhibit highest expression stabilities.
4. Concluding remarks
In conclusion, we have utilized transcriptomic datasets to identify novel reference gene
candidates, and subsequently comprehensively validated their expression stability in diverse,
commonly-used experimental conditions. We have identified a set of optimal reference genes
15
and specifically designed corresponding primers that are robust to genomic mutations. These
genes function in different cellular pathways, being involved in protein folding (Fkbp1a),
protein trafficking (Tmed2), signal transduction (Gnb1), and vitamin B12 metabolism
(Mmadhc), and accordingly the risk of co-regulation is minimal. Our findings show that these
newly-identified genes exhibit sufficient expression stability such that only two reference
genes are required for accurate normalization of qPCR data, enabling significant savings in
time, cost, and sample usage. The provision of fully-validated universal reference genes,
optimized primer sequences, and simple gene pair selection guidelines (including specific,
optimal gene combinations for discrete experimental conditions) will enable industrial and
academic groups to perform streamlined qPCR analyses with maximum accuracy and
precision. The specific route of reference gene identification and validation described in this
study is particularly applicable to other cell-types that are commonly utilized in a large
16 Acknowledgements
This work was supported by MedImmune.
The authors declare no financial or commercial conflict of interest.
5. References
[1] Ahmadi, M., Mahboudi, F., Eidgahi, A., Reza, M., et al., Evaluating the efficiency of
phiC31 integrase mediated monoclonal antibody expression in CHO cells. Biotechnol. Prog.
2016, 32, 1570-1576.
[2] Li, H., Chen, K., Wang, Z., Li, D., et al., Genetic analysis of the clonal stability of
Chinese hamster ovary cells for recombinant protein production. Mol. Biosyst. 2016, 12,
102-109.
[3] Balasubramanian, S., Rajendra, Y., Baldi, L., Hacker, D. L., Wurm, F. M., Comparison of
three transposons for the generation of highly productive recombinant CHO cell pools and
cell lines. Biotechnol. Bioeng. 2016, 113, 1234-1243.
[4] Zhang, A., Tsang, V. L., Markely, L. R., Kurt, L., et al., Identifying the differences in
mechanisms of mycophenolic acid controlling fucose content of glycoproteins expressed in
different CHO cell lines. Biotechnol. Bioeng. 2016, 113(11), 2367-2376.
[5] Bustin S.A., Nolan, T, Pitfalls of quantitative real-time reverse-transcription polymerase
chain reaction. J Biomol. Tech. 2004, 15, 155-166.
[6] Fleige, S., Pfaffl, M. W., RNA integrity and the effect on the real-time qRT-PCR
performance. Mol. Aspects Med. 2006, 27, 126-139.
[7] Huggett, J., Dheda, K., Bustin, S., Zumla, A., Real-time RT-PCR normalisation; strategies
17
[8] Bustin, S. A., Benes, V., Garson, J. A., Hellemans, J., et al., The MIQE guidelines:
minimum information for publication of quantitative real-time PCR experiments. Clin. Chem.
2009, 55, 611-622.
[9] Bustin, S. A., Benes, V., Garson, J., Hellemans, J., et al., The need for transparency and
good practices in the qPCR literature. Nat. Methods 2013, 10, 1063-1067.
[10] Dijkstra, J. v., van Kempen, L., Nagtegaal, I., Bustin, S., Critical appraisal of
quantitative PCR results in colorectal cancer research: can we rely on published qPCR
results? Mol. Oncol. 2014, 8, 813-818.
[11] Bustin, S., The continuing problem of poor transparency of reporting and use of
inappropriate methods for RT-qPCR. Biomol. Detect Quantif. 2017, 12, 7-9.
[12] Bustin, S. A., Nolan, T., Improving the reliability of peer reviewed publications: we are
all in it together. Biomol. Detect Quantif. 2016, 7, A1-A5.
[13] Thellin, O., Zorzi, W., Lakaye, B., De Borman, B., et al., Housekeeping genes as
internal standards: use and limits. J. Biotechnol. 1999, 75, 291-295.
[14] Schmittgen, T. D., Zakrajsek, B. A., Effect of experimental treatment on housekeeping
gene expression: validation by real-time, quantitative RT-PCR. J. Biochem. Biophys.
Methods 2000, 46, 69-81.
[15] Bas, A., Forsberg, G., Hammarström, S., Hammarström, M. L., Utility of the
housekeeping genes 18S rRNA, Actin and Glyceraldehyde 3 phosphate
dehydrogenase for normalization in real time quantitative reverse transcriptase polymerase
chain reaction analysis of gene expression in human T lymphocytes. Scand. J. Immunol.
2004, 59, 566-573.
[16] Derks, N., Müller, M., Gaszner, B., Tilburg-Ouwens, D., et al., Housekeeping genes
revisited: different expressions depending on gender, brain area and stressor. Neuroscience
18
[17] Guénin, S., Mauriat, M., Pelloux, J., Van Wuytswinkel, O., et al., Normalization of
qRT-PCR data: the necessity of adopting a systematic, experimental conditions-specific, validation
of references. J. Exp. Bot. 2009, 60, 487-493.
[18] Jacob, F., Guertler, R., Naim, S., Nixdorf, S., et al., Careful selection of reference genes
is required for reliable performance of RT-qPCR in human normal and cancer cell lines.
PLoS One 2013, 8, e59180.
[19] van de Moosdijk, A. A. A., van Amerongen, R., Identification of reliable reference genes
for qRT-PCR studies of the developing mouse mammary gland. Sci. Rep. 2016, 6, 35595.
[20] Sgamma, T., Pape, J., Massiah, A., Jackson, S., Selection of reference genes for diurnal
and developmental time-course real-time PCR expression analyses in lettuce. Plant methods
2016, 12, 21.
[21] Pessoa, D. D. V., Vidal, M. S., Baldani, J. I., Simoes-Araujo, J. L., Validation of
reference genes for RT-qPCR analysis in Herbaspirillum seropedicae. J. Microbiol. Methods
2016, 127, 193-196
[22] Bahr, S. M., Borgschulte, T., Kayser, K. J., Lin, N., Using microarray technology to
select housekeeping genes in Chinese hamster ovary cells. Biotechnol. Bioeng. 2009, 104,
1041-1046.
[23] Trapnell, C., Pachter, L., Salzberg, S. L., TopHat: discovering splice junctions with
RNA-Seq. Bioinformatics 2009, 25, 1105-1111.
[24] Xu, X., Nagarajan, H., Lewis, N. E., Pan, S., et al., The genomic sequence of the
Chinese hamster ovary (CHO)-K1 cell line. Nat. Biotechnol. 2011, 29, 735-741.
[25] Trapnell, C., Williams, B. A., Pertea, G., Mortazavi, A., et al., Transcript assembly and
quantification by RNA-Seq reveals unannotated transcripts and isoform switching during cell
19
[26] Kozera, B., Rapacz, M., Reference genes in real-time PCR. J. Appl. Genet. 2013, 54,
391-406.
[27] Larkin, M. A., Blackshields, G., Brown, N., Chenna, R., et al., Clustal W and Clustal X
version 2.0. Bioinformatics 2007, 23, 2947-2948.
[28] Ye, J., Coulouris, G., Zaretskaya, I., Cutcutache, I., et al., Primer-BLAST: a tool to
design target-specific primers for polymerase chain reaction. BMC Bioinformatics 2012, 13,
134.
[29] Mozley, O. L., Thompson, B. C., Fernandez Martell, A., James, D. C., A mechanistic
dissection of polyethylenimine mediated transfection of CHO cells: To enhance the
efficiency of recombinant DNA utilization. Biotechnol. Prog. 2014, 30, 1161-1170.
[30] Vandesompele, J., De Preter, K., Pattyn, F., Poppe, B., et al., Accurate normalization of
real-time quantitative RT-PCR data by geometric averaging of multiple internal control
genes. Genome Biol. 2002, 3(7), 0034.1-0034.11.
[31] Andersen, C. L., Jensen, J. L., Ørntoft, T. F., Normalization of real-time quantitative
reverse transcription-PCR data: a model-based variance estimation approach to identify genes
suited for normalization, applied to bladder and colon cancer data sets. Cancer Res. 2004, 64,
5245-5250.
[32] Pfaffl, M. W., Tichopad, A., Prgomet, C., Neuvians, T. P., Determination of stable
housekeeping genes, differentially regulated target genes and sample integrity: BestKeeper–
Excel-based tool using pair-wise correlations. Biotechnol. Lett. 2004, 26, 509-515.
[33] Davies, S. L., Lovelady, C. S., Grainger, R. K., Racher, A. J., et al., Functional
heterogeneity and heritability in CHO cell populations. Biotechnol. Bioeng. 2013, 110,
20
[34] Kaas, C. S., Kristensen, C., Betenbaugh, M. J., Andersen, M. R., Sequencing the CHO
DXB11 genome reveals regional variations in genomic stability and haploidy. BMC
Genomics 2015, 16, 160.
[35] Cao, Y., Kimura, S., Itoi, T., Honda, K., et al., Construction of BAC based physical
map and analysis of chromosome rearrangement in chinese hamster ovary cell lines.
Biotechnol. Bioeng. 2012, 109, 1357-1367.
[36] Brinkrolf, K., Rupp, O., Laux, H., Kollin, F., et al., Chinese hamster genome sequenced
from sorted chromosomes. Nat. Biotechnol. 2013, 31, 694-695.
[37] Zhu, J., Zhang, L., Li, W., Han, S., et al., Reference gene selection for quantitative
real-time PCR normalization in Caragana intermedia under different abiotic stress conditions.
PLoS One 2013, 8, e53196.
[38] De Spiegelaere, W., Dern-Wieloch, J., Weigel, R., Schumacher, V., et al., Reference
gene validation for RT-qPCR, a note on different available software packages. PLoS One
2015, 10, e0122515.
[39] Hellemans, J., Mortier, G., De Paepe, A., Speleman, F., Vandesompele, J., qBase
relative quantification framework and software for management and automated analysis of
21 Table 1: Identification of candidate reference genes. Two transcriptomic datasets derived
from RNA-seq analysis of four discrete CHO cell lines in different growth phases were
analysed to identify genes exhibiting highest expression stabilities (dataset 1 = three cell lines
in two growth phases, dataset 2 = one cell line in three growth phases). Genes were ranked
according to coefficient of variation (CV%; standard deviation/mean) and maximum fold
change (MFC; highest expression level/ lowest expression level) in expression across
different experimental conditions. The five genes with highest expression stabilities are
shown, as well as the three highest ranking genes from a panel of ‘traditional housekeepers’.
FPKM = fragments per kilobase of transcript per million mapped reads.
RNA-seq dataset 1 RNA-seq dataset 2
Gene Mean
FPKM
CV% Max FC Mean
FPKM
CV% Max FC
All Genes
Pkar1a 160 2.55 1.08 341 0.21 1.00
Fkbp1a 687 3.20 1.10 568 2.05 1.05
Mmadhc 124 4.36 1.13 108 3.02 1.06
Gnb1 457 5.49 1.15 1124 1.23 1.03
Tmed2 217 5.43 1.14 286 3.01 1.07
House- keepers
Actb 2722 25 2.00 5066 4.43 1.11
Pgam1 306 27 2.16 613 2.35 1.05
22 Table 2: Reference gene primer sequences and amplification efficiencies. Primers span
exon-exon boundaries, anneal at 60°C, and amplify regions conserved in Chinese Hamster,
CHO-K1 and Mouse. Amplification efficiencies and correlation coefficients (R2) were
determined from standard curves (10-fold serial dilutions of pooled cDNA samples) using the
equation E = 10 (–1/slope), and linear regression analysis respectively. Ct values represent
the mean of twenty independent experiments (see Figure 1).
Gene NCBI Accession number
Primer sequences Primer Efficiency
R2 Amplicon size (bp)
Ct value
Pgam1 XM_007617182.1 AGGCGCAGGTAAAGATCTGG
TGCGATCCTTACTGATGTTGC
96.06% 0.996 96 19.47
Pkar1a XM_003500312.2 GAATCCTCATGGGAAGCACTCTG
CCTTGCACCACGATCTTCTG
96.49% 0.995 160 19.64
Mmadhc XM_003513988.2 TGTCACCTCAATGGGACTGC
CAGGTGCATCACTACTCTGAAAC
97.63% 0.997 145 21.34
Gapdh NM_001244854.2 GAAAGCTGTGGCGTGATGG
TACTTGGCAGGTTTCTCCAG
98.03% 0.998 187 15.71
Gnb1 NM_001246701.1 CCATATGTTTCTTTCCCAATGGC
AAGTCGTCGTACCCAGCAAG
98.39% 0.999 184 18.02
Tmed2 XM_007648402.1 GCCCACATGGATGGGACATAC
TGATGAGCTTCTGTCTCCATGTC
98.44% 0.999 131 20.57
Fkbp1a XM_003499952.2 CTCTCGGGACAGAAACAAGC
GACCTACACTCATCTGGGCTAC
99.09% 0.998 95 19.74
Actb NM_001244575.1 TGACCCAGATCATGTTTGAGACC
CAGGATGGCATGAGGGAGAG
[image:23.595.71.514.236.622.2]23 Table 3: Gnb1, Fkbp1a, Tmed2 and Mmadhc exhibit very high expression stability
across diverse, commonly-applied experimental conditions. The transcript abundance of
eight candidate reference genes in twenty discrete CHO cell samples (see Figure 1) was
measured by qPCR analysis, and relative gene expression stabilities across all experimental
conditions were determined using GeNorm, NormFinder and Bestkeeper software packages.
geNorm NormFinder BestKeeper
Stability Value (M)
Rank Stability Value (S)
Rank SD (± CP) Rank
Gnb1 0.197 4 0.148 1 0.15 2
Fkbp1a 0.144 1 0.180 2 0.21 4
Tmed2 0.183 3 0.288 4 0.14 1
Mmadhc 0.144 1 0.291 5 0.18 3
Gapdh 0.282 5 0.251 3 0.37 5
Pkar1a 0.348 7 0.305 6 0.40 6
Actb 0.326 6 0.309 7 0.41 7
[image:24.595.71.520.210.453.2]24 Table 4: Identification of specific, optimal reference combinations for discrete
experimental conditions. The expression stability of the four ‘best-performing’ reference
gene candidates (see Table 3) was analysed in distinct conditions individually. For each
experimental system, samples were collected from nine discrete CHO cell lines (see Figure
1). Optimal reference gene combinations recommended for use in each specific experimental
condition are shown in bold.
Condition Expression
stability (rank)
V2+3 V3+4 NormFinder S
values (range)
GeNorm M values (range)
BestKeeper SD (± CP) (range)
Discrete cell lines (exponential phase growth) Fkbp1a Tmed2 Mmadhc Gnb1
0.06 0.056 0.055 0.213 0.108 0.200 0.12 0.14
Cell growth phases Mmadhc Fkbp1a Gnb1 Tmed2
0.041 0.057 0.051 0.226 0.04 0.165 0.12 0.31
Lipofection Gnb1 Fkbp1a
Mmadhc Tmed2
0.046 0.046 0.078 0.167 0.139 0.179 0.08 0.13
Electroporation Gnb1 Mmadhc
Tmed2 Fkbp1a
0.064 0.061 0.068 0.247 0.117 0.223 0.07 0.15
Hypothermia Tmed2 Fkbp1a
Gnb1 Mmadhc
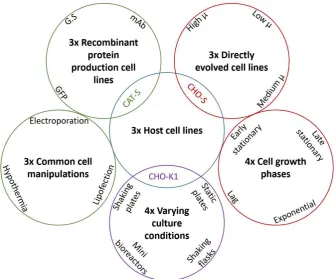
[image:25.595.67.519.235.623.2]25 Figure 1: Reference gene expression levels were profiled in a wide range of
commonly-applied experimental conditions. The expression stability of eight candidate reference
genes (see Table 1) was determined across twenty discrete experimental samples (see Table
3). Host cell-line specific RNA samples were obtained from exponentially growing cultures
of CAT-S, CHO-S and CHOK1. Other condition-specific RNA samples were obtained from
varying host cell lines (denoted by circle colours). GFP = green fluorescent protein; mAb =