White Rose Research Online URL for this paper: http://eprints.whiterose.ac.uk/91824/
Version: Accepted Version
Article:
Canfield, C, Bruine de Bruin, W orcid.org/0000-0002-1601-789X and Wong-Parodi, G (2017) Perceptions of electricity-use communications: effects of information, format, and individual differences. Journal of Risk Research, 20 (9). pp. 1132-1153. ISSN 1366-9877 https://doi.org/10.1080/13669877.2015.1121909
[email protected] https://eprints.whiterose.ac.uk/
Reuse
Unless indicated otherwise, fulltext items are protected by copyright with all rights reserved. The copyright exception in section 29 of the Copyright, Designs and Patents Act 1988 allows the making of a single copy solely for the purpose of non-commercial research or private study within the limits of fair dealing. The publisher or other rights-holder may allow further reproduction and re-use of this version - refer to the White Rose Research Online record for this item. Where records identify the publisher as the copyright holder, users can verify any specific terms of use on the publisher’s website.
Takedown
If you consider content in White Rose Research Online to be in breach of UK law, please notify us by
Perceptions of Electricity Use Communications:
Effects of Information, Format, and Individual Differences
Casey Canfield,1 Wändi Bruine de Bruin,1, 2* and Gabrielle Wong-Parodi1
Accepted for publication in the Journal of Risk Research
1
Department of Engineering and Public Policy, Carnegie Mellon University, 5000 Forbes Avenue, Pittsburgh PA 15213 (US)
2
Centre for Decision Research, Leeds University Business School, Maurice Keyworth Building, Leeds LS2 9JT (UK)
* corresponding author
Additional contact information: Casey Canfield ([email protected]; x1-4122682670), Wändi Bruine de Bruin ([email protected]; x44-7904891250),
Gabrielle Wong-Parodi ([email protected]; x1-5103161631),
Acknowledgements
This work was supported by the U.S. Department of Energy (DE-OE0000300 and DE-OE0000204) via a cost-share arrangement with the Carnegie Mellon Electricity Industry Center as well as the center for Climate and Energy Decision Making (0949710; SES-1463492), through a cooperative agreement between the National Science Foundation and Carnegie Mellon University. Casey Canfield was supported by the National Science Foundation Graduate Research Fellowship (1121895). This report was prepared as an account of work sponsored by an agency of the United States Government. Neither the United States Government nor any agency thereof, nor any of their employees, makes any warranty, express or implied, or assumes any legal liability or responsibility for the accuracy, completeness, or usefulness of any information, apparatus, product, or process disclosed, or represents that its use would not infringe privately owned rights. Reference herein to any specific commercial product, process, or service by trade name, trademark, manufacturer, or otherwise does not necessarily constitute or imply its endorsement, recommendation, or favoring by the United States Government or any agency thereof. The views and opinions of authors expressed herein do not necessarily state or reflect those of the United States
Government or any agency thereof.
We thank Denise Caruso, Barbara Bugosh, and Jack Wang for their help in conducting the research. In addition, we are grateful to Baruch Fischhoff, Yasmina Okan,
Eric Stone, and anonymous reviewers from CMU’s Engineering and Public Policy faculty for
their comments on an earlier draft.
Abstract
Electricity bills could be an effective strategy for improving communications about
consumers’ electricity use and promoting electricity savings. However, quantitative
communications about electricity use may be difficult to understand, especially for
consumers with low energy literacy. Here, we build on the health communication and graph
comprehension literature to inform electricity bill design, with the goal of improving
understanding, preferences for the presented communication, and intentions to save
electricity. In a survey-based experiment, each participant saw a hypothetical electricity bill
for a family with relatively high electricity use, covering information about (a) historical use,
(b) comparisons to neighbors and (c) historical use with appliance breakdown. Participants
saw all information types in one of three formats including (a) tables, (b) bar graphs, and (c)
icon graphs. We report on three main findings. First, consumers understood each type of
electricity use information the most when it was presented in a table, perhaps because tables
facilitate simple point reading. Second, preferences and intentions to save electricity were
the strongest for the historical use information, independent of format. Third, individuals
with lower energy literacy understood all information less. We discuss implications for
designing utility bills that are understandable, perceived as useful, and motivate consumers to
save energy.
Introduction
To curb the risks of climate change, the Intergovernmental Panel on Climate Change
(IPCC 2014) posits that global carbon dioxide emissions from the energy supply sector must
be reduced to 90% below 2010 levels between 2040 and 2070. In 2011, the U.S. produced
17% of all carbon dioxide (CO2) emissions worldwide (EIA 2011), with approximately 14%
of that coming from U.S. residential energy consumption alone (EIA 2012). It has been
estimated that residential energy consumption could be reduced by approximately 20% in 10
years through energy efficiency and conservation strategies (Dietz, Gardner, Gilligan, Stern,
and Vandenbergh 2009; Pacala and Socolow 2004). Unfortunately, consumers face several
barriers to saving electricity, including a lack of understanding about which behaviors use the
most or the least electricity (Attari, DeKay, Davidson, and Bruine de Bruin 2010; Owens and
Driffill 2008; Gardner and Stern 2008).
In a review of 26 bill-based interventions, Fischer (2008) suggests that clear, frequent,
and detailed feedback can help residential consumers to reduce their electricity consumption.
Because most people pay at least some attention to their electricity bills, improving the
communications provided via their bills could be an effective strategy for enhancing their
understanding of their electricity use and increasing their intentions to save electricity.
Consumers who are concerned that their electricity use is relatively high tend to be especially
interested in receiving electricity use information (Fischer 2008; Karjalainen 2011). At
present, however, electricity bills provide no information about whether consumers’
electricity use is high or low, or what appliances contribute most to their overall use (Fischer
2008). Moreover, when electricity providers do add quantitative electricity use information to
have been published on this topic lack a theoretical foundation, and remain qualitative in
nature (Fischer 2008). Hence, relatively little is known about which types of information or
communication formats best improve consumers’ understanding, their preferences for the
materials, or their intentions to save electricity.
Formative research on consumers’ responses to hypothetical electricity bills is needed
to convince electricity companies to invest in electricity bill re-design and field trials
examining resulting effects on their consumers’ actual behavior over time. Indeed,
convincing organizations to design and test new communications is no easy feat
(Keller-Cohen 1987). Handbooks of communication design also recommend first conducting
formative research that presents consumers with hypothetical communication materials,
before investing in expensive field trials (Fischhoff, Downs, and Brewer 2011; Morgan et al.
2002).
Only a few formative studies have been conducted to test people’s response to
hypothetical electricity bills (Egan, 1999; Karjalainen 2011). However, those studies have
ignored variables identified as relevant in related domains. Here, we build on formative
research in the domain of health risk communication, as well as cognitive theories of graph
comprehension, which highlight that it is important to test the usefulness of presentation
formats for different types of information, and for recipients varying in background
knowledge (Friel, Curcio, and Bright 2001; Lipkus 2007; Peters, Hart, and Fraenkel 2011;
Shah, Freedman, and Vekiri 2005; Shah and Hoeffner 2002; Shah and Freedman 2009).
Below, we discuss how insights from these domains can inform the re-design of electricity
differences in background knowledge (i.e., ‘energy literacy’). Before doing so, we first
highlight the communication goals for improved electricity bills.
Proposed Communication Goals for Improved Electricity Bills
Cognitive research on the design of tables and graphs has mostly focused on improving
students’ understanding of quantitative information in classroom settings (Friel et al. 2001;
Shah and Hoeffner 2002; Vessey 1991). However, outside of the classroom, tables and
graphs may be designed for additional purposes. An electricity company may want to design
information that meets consumers’ preferences, with understanding being only a secondary
goal (Keller-Cohen 1989). Indeed, qualitative interviews with consumers have indicated that
they will throw out bills if they dislike how the information is presented (Egan 1999). A
third communication goal, often promoted by policy makers, is to better inform people’s
decisions or inspire behavior change (Bruine de Bruin and Bostrom 2013). Hence, it is
important to study the ability of tables and graphs to achieve different communication goals
in real-world contexts. In summary, designers of electricity bills have the following
communication goals: (1) to improve recipients’ understanding of their electricity use, (2) to
increase the preferences for the presented communication, so that recipients are willing to
engage with it and apply it to their decisions, and (3) to increase intentions to save electricity
(Egan 1999; Fischer 2008).
The health communication literature also recognizes the three goals of improving
understanding, preferences, and intentions to change behavior (Ancker et al. 2006; Lipkus
2007). Unfortunately, the health communication literature has found that communications
understanding may not actually be preferred (Ancker et al. 2006; Lipkus and Peters 2009;
Miron-Shatz, Hanoch, Graef, and Sagi 2009; Schapira, Nattinger, and McHorney 2001) or
even undermine recipients’ willingness to implement the presented health recommendations
(Stone et al. 2003; Weinstein and Sandman 1993). Additionally, relatively little is known
about how specific communication features interact with each other or with recipients’
ability to understand the presented information (Fagerlin et al. 2007; Lipkus 2007; Lipkus
and Peters 2009). Hence, before disseminating communications to large audiences, it is
important to first test their effectiveness in terms of their effect on understanding, preferences,
and behavioral intentions (Hegarty, Smallman, and Stull 2012; Lipkus 2007; Spiegelhalter,
Person, and Short 2011).
Proposed Information Content for Improved Electricity Bills
Proposed content for improved electricity bills includes information about historical
use, neighbor comparisons, and appliance-specific breakdowns (Egan 1999).
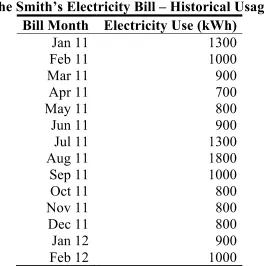
First, information about households’ historical electricity use presents how residential
electricity use changes over time, including periods of peak usage and seasonal trends.
Typically, historical use is presented for each month over the past year, thus allowing
recipients to compare specific months within and across seasons (see Figure 1). Such
communications aim to improve consumers’ understanding about when their electricity use is
relatively high, and increase their intentions to change the underlying behaviors. Historical
information is thought to be most likely to motivate behavior change when consumers find
interviews, consumers have indicated that they do indeed value electricity bills that present
information about how their own electricity use has changed over time (Karjalainen 2011).
[Figure 1 near here]
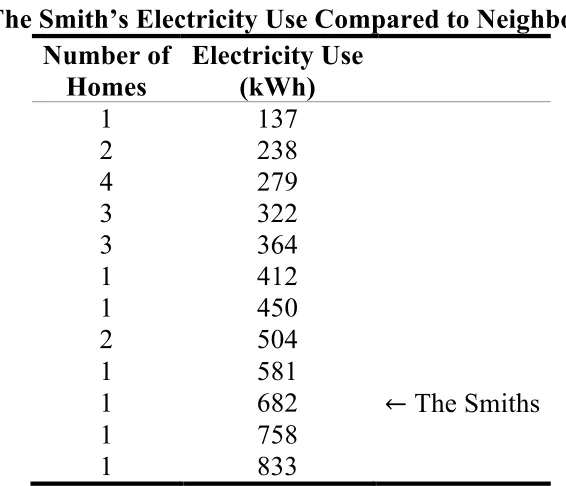
Second, neighbor comparisons show the household’s use for one specific month, as
well as that month’s use for similar households in the same neighborhood (see Figure 2).
Specifically, communications that present neighbor comparisons highlight whether the
recipients’ household uses more or less electricity than comparable neighbors. Such
approaches build on theories positing that individuals are motivated to behave in line with
social norms (Schultz, Nolan, Cialdini, Goldstein, and Griskevicius 2007), and are consistent
with findings that people have limited awareness of how much electricity use is the norm
(Attari et al. 2010). People perceive neighbor comparison information as useful, perhaps
because it helps them to evaluate whether their electricity use is relatively high or low (Egan
1999). Among especially wasteful consumers, neighbor comparisons can indeed lead to the
understanding that using less electricity has been the social norm among their neighbors, and
promote the motivation to start saving electricity (Allcott 2011; Schultz et al. 2007). Yet,
neighbor comparison information can inadvertently teach frugal consumers that most of their
neighbors use more electricity, which has been found to undermine the motivation to save
electricity (Schultz et al. 2007). To avoid such detrimental effects on the electricity use of
frugal consumers, it is therefore important to show approval of their behavior, through for
example printing a smiley face on their electricity bill (Schultz et al. 2007).
[Figure 2 near here]
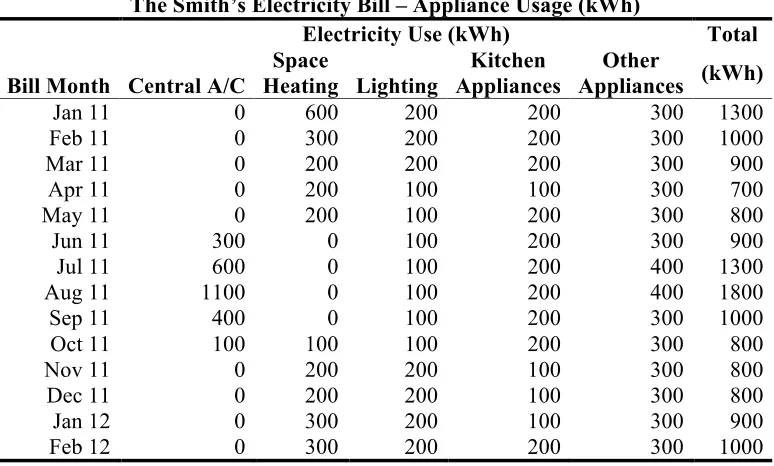
A third type of information that could be included on electricity bills involves a historical
the specific household, by showing how much the use of specific appliances contributes to
the overall electricity use of the recipients’ household over time (see Figure 3). Adding such
an appliance-specific breakdown should increase understanding because most consumers
know relatively little about which of their appliance-specific behaviors contribute to higher
electricity use (Attari et al. 2010). Consumers have also indicated that they want to receive
more information about which specific appliances use the most electricity (Karjalainen 2011;
Krishnamurti et al. 2012). Detailed information about which appliance-specific behaviors use
the most electricity may also motivate consumers to use those appliances less, or to replace
them with more energy-efficient appliances (Fischer 2008).1
Proposed Formats for Communicating Quantitative Electricity Use Information
Relatively few studies have examined the effectiveness of different formats for
communicating quantitative electricity use information. Below, we present findings from
health communication and graph comprehension research, while recognizing the need to test
the best format for presenting different types of electricity use information.
The first presentation format of interest is the table format (See Figures 1A, 2A, 3A).
Classic research on table and graph design has noted the importance of the ‘cognitive fit’
with the decision task at hand (Friel, Curcio, and Bright 2001; Shah and Hoeffner 2002;
Vessey, 1991). Tables were found to be better than graphs for tasks that required
understanding specific point values (Friel et al. 2001; Shah and Hoeffner 2002; Vessey,
1991). Even in the domain of health, tables are recommended for tasks that require
understanding numbers ‘verbatim’ such as the specific percent of a patient population who
helpful for communicating how much electricity a household used in a specific month, and
whether their use is more or less than in the past or compared to their neighbor’s. Indeed,
qualitative interviews with consumers have indicated that they like tables for receiving
electricity use information (Karjalainen 2011).
By contrast, tables are less useful than graphs for tasks that require understanding
more complex ‘integrative’ patterns and interpretations (Friel et al. 2001; Shah and Hoeffner
2002; Vessey 1991). Tables are not recommended in the health domain, where the goal of
communications is to inform complex comparisons between the risks and benefits of
treatments (Brewer et al. 2012; Hawley et al. 2008). Hence, electricity consumers may find
tables less useful when trying to get a deeper understanding of their electricity use patterns.
The second presentation format of interest is the bar graph format (see Figures 1B,
2B, 3B), which has been found to facilitate comparisons between groups (Lipkus and
Hollands, 1999). Especially when showing multiple data points, bar graph formats are easier
to interpret than tables (Brewer et al. 2012). Histograms, one type of bar graph format that
presents bars to indicate the frequency of specific outcomes, are useful for communicating
distributions of outcomes (Ibrekk and Morgan, 1987; Lipkus and Hollands, 1999). Bar graph
formats facilitate simple point comparisons, and divided bar graphs can be beneficial when
both absolute and relative values need to be communicated (Shah and Hoeffner 2002).
However, as compared to other types of graphical formats, histograms may reduce the
likelihood that recipients will recognize the specific point value of the overall mean, which is
often confused with the mode of the distribution (Ibrekk and Morgan 1987; Rowe et al.
More recent research in the domain of health has highlighted the effectiveness of icon
graph formats over other types of graphical formats. The icon graph format includes any
graphical display that presents data points as discrete icons (see Figures 1C, 2C, 3C). In
health communications, icon graph formats are typically used to indicate the specific
percentage of people who are at risk (vs. not at risk) for a particular disease. This type of icon
graph format is also referred to as an icon array, because it displays icons to represent the
number of people who are at risk, using different colors for those who experienced and those
who avoided the negative health outcome (Retamero and Cokely 2013;
Garcia-Retamero, Okan, and Cokely 2012). Icon graph formats can also be used to show
distributions of outcomes as experienced in a population, thus replacing the bars in a
histogram with stacks of icons (Egan 1999). Communications that compare consumers’
electricity use to that of their neighbors are better understood with an icon graph format
(similar to Figure 2C) than with a simple range chart (Egan, 1999; Iyer, Kempton, and Payne,
2006). Initial designs and tests of icon graph formats in the electricity use domain have
focused only on presenting neighbor comparisons (see Egan 1999).
Of course, as noted above, formats that are best understood are not necessarily ones
that people like to receive, or inspire behavior change (Ancker et al., 2006; Feldman-Stewart
et al. 2000; Hawley et al. 2008). Tables may not be effective for improving understanding of
complex information, but they tend to be liked because they seem more trustworthy and
scientific than graphical formats (Johnson and Slovic 1995; Hawley et al. 2008). Icon graph
formats may improve understanding and be perceived as useful, but undermine behavior
change (Stone et al. 2003). Relatively little is known about how these formats affect
Individual Differences in Energy Literacy
According to theories of graph comprehension, consumers’ responses will depend on
their ability to understand the presented information (Shah and Freedman 2009). In the
context of health communications, researchers have highlighted the importance of health
literacy and numeracy, which refers to the ability to understand quantitative and qualitative
information about health risks (Ancker and Kauffman 2007; Sorensen et al. 2012). Patients
who have less of these skills are worse at self-managing their health conditions, perhaps in
part due to misunderstanding instructions (Cavanaugh et al. 2008; Estrada et al. 2004).
In the context of electricity bills, individuals’ responses will likely depend on their
energy literacy, which refers to the ability to understand qualitative and quantitative
information about electricity use (DeWaters and Powers 2011). According to a report by the
National Environmental Education and Training Foundation (2002), only one in eight
Americans can answer simple energy literacy questions, for example about how most of U.S.
electricity is generated. Improving energy literacy may promote energy-saving behavior
(Zografakis, Menegaki, and Tsagarakis 2008). However, little is known about how energy
literacy influences consumers’ responses to the energy information provided with electricity
bills.
Research Questions
Before implementing expensive field trials, we aimed to identify the most promising
interventions through a more cost-effective hypothetical survey-based experiment (Fischhoff
differences on consumers’ responses to electricity bill designs. As noted above, we followed
health communication and bill design studies that defined responses in terms of
understanding of the materials, preferences for materials, and behavioral intentions (Ancker
et al. 2006; Egan 1999; Lipkus 2007). We presented participants with three types of
information that have been recommended for helping consumers to understand their
electricity use (Allcott 2011; Fischer 2008; Schultz et al. 2007): households’ historical use,
comparison to neighbors’ use, and households historical use with appliance-specific
breakdown and (see Figures 1-3). Based on the health communication and graph
comprehension literature, we presented these types of information in the format of tables, bar
graphs, or icon graphs, and recognized the importance of examining how these outcomes
may vary with individual differences in domain knowledge or energy literacy (Shah and
Hoeffner 2011).
Methods
Sample
We recruited a diverse sample of 201 participants through community organizations
in the greater Pittsburgh metropolitan area. A total of 80.1% of our participants had not
finished a 4-year college degree, with 44.4% having only completed high school or less.
Their mean age was 45.9 (SD=14.93) and ranged from 18 to 88, with 70.3% female, 77.3%
Procedure
Survey sessions were administered at the organizations through which participants
were recruited. Participants arrived in groups, but worked individually and at their own pace.
Following previous work (Egan 1999), participants received hypothetical information about
the electricity use of the Smith family household in one of three formats.
Information. Each participant received three pieces of information about the Smiths’
electricity use in order of complexity, which would be the presentation order preferred by
electricity bill designers and educators in the real world because it allows participants to
learn from the simpler formats before tackling the more complex formats (van Merriënboer,
Kirschner, and Kester 2003). In order, the information received by each participant covered
the Smith family’s historical electricity use (Figure 1), electricity use as compared to
neighbors (Figure 2), and historical electricity use broken down by appliances (Figure 3),
which, as noted above, show promise for being well-received by consumers (Allcott 2011;
Fischer 2008; Schultz et al. 2007). For each type of information, formats were designed to
follow recommendations from the literature while ensuring enough similarity between
conditions to allow for fair comparisons (Cleveland and McGill 1984; Lipkus 2007). All
information was designed for a month in which electricity use was relatively high, both
compared to the household’s own use and compared to that of their neighbors, as those are
the conditions under which behavior change is needed (Egan 1999; Schultz et al. 2007). All
materials were pilot-tested with participants from a wide range of backgrounds, informing
the readability of the instructions and the size of the presented materials.
Format. Our 201 participants were randomly assigned to receive information about
receiving each format. The following communication formats were developed to present
comparable information, as in the health communication literature (Brewer et al. 2012;
Hawley et al., 2008): (a) tables, (b) bar graphs or (c) icon graphs.
Dependent Variables. We used three outcome measures to evaluate each type of
information and format, following recommendations in the health communication literature
suggesting that effective information formats should improve understanding, preferences,
and behavioral intentions (Ancker et al. 2006; Lipkus 2007). Each of these measures was
repeated for the historical use information, the neighbor comparison information, and the
historical appliance breakdown information. The full set of questions is available in the
Supplemental Materials (Dependent Measures Section). For example, we measured
participants’ (1) understanding of the presented information as seen in the number of correct
responses across seven true/false questions measuring both ‘verbatim’ understanding (for
example “The highest electricity use was 1800kWh”) and more ‘complex’ use of information
(for example “The Smith's home used the most electricity in the summer months (Jun, July,
Aug)”), (2) preferences for the materials reflected in mean ratings across ten Likert-scale
items (for example, “How useful would it be if this information came with your electricity
bill?”) (1=Not at all; 7=Very much) for each type of content ( =.89 for historical use, =.94
for neighbor comparison, and =.92 for appliance breakdown), and (3) intentions to save
electricity rated on one Likert-scale item (“How much does this information make you want
to lower your electricity usage?”) (1=Not at all; 7=A lot), while noting that findings based on
single-item measures tend to replicate findings based on multi-item measures while reducing
respondent burden (Bergkvist and Rossiter 2007; Wanous, Reichers, and Hudy 1997).
items about home energy use adapted from a high-school level energy literacy test, which is
the background knowledge relevant to understanding the information presented on electricity
bills (DeWaters and Powers, 2011; see Supplemental Materials – Individual Differences in
Energy Literacy). Participants also completed questions about their demographic
background.
Our study was part of a 1.5 hour session, for which participants received $45. We
also offered participants the opportunity to enroll in a competition to win a $50 gift
certificate, which was announced at the start of the study. Specifically, these gift cards were
awarded to the four individuals with the most correct answers to our true/false questions
measuring understanding of the presented electricity-use information. Such
performance-based monetary payments have been shown to encourage more thoughtful responses
(Hertwig & Ortman, 2001).
Results
Below, we discuss our analyses, which examine the effectiveness of the table, bar
graph, and icon graph formats in terms of improving understanding, preferences, and
intentions to save electricity, and how it varied across different types of information (i.e.,
historical use, comparison to neighbors’ use, or historical appliance-specific use), as well as
for individuals varying in background knowledge.
Individual Differences in Background Knowledge
Participants varied in their energy literacy (MDN=.39; M=.44; SD=.21), with a
one-sample Kolomogorov-Smirnov test showing that the distribution of scores was significantly
SE=.34). In the analyses below, we therefore divided participants into two groups, reflecting
whether their energy literacy scores were above or below the median. Analyses with the
full-range measure of Energy Literacy yielded the same conclusions ( =.05). For each dependent
variable (understanding, liking, and behavioral intentions), we thus examined effects of the
information provided (historical use, neighbor comparisons, and historical use with appliance
breakdown), format (table vs. bar graph vs. icon graph) and energy literacy (high vs. low).
Effects on Understanding of Electricity Use Information
For each type of electricity use information (historical use, neighbor comparison, and
historical use with appliance-breakdown), we conducted a separate Analysis of Variance
(ANOVA) to examine the effect of format (table vs. bar graph vs. icon graph) and energy
literacy (high vs. low) on understanding. Table 1 summarizes the mean and standard
deviation of understanding scores by electricity use information and format.
[Table 1 near here]
There was a main effect for format for each type of the electricity use information,
including historical use, F(2,186)=5.83, p2= .06, p=.004, the neighbor comparison,
F(2,186)=32.48, p2= .26, p<.001, and the historical use with appliance breakdown,
F(2,186)=6.54, p2= .07, p=.002. As shown in Table 1, the table format was easiest to
understand for each type of electricity use information. When receiving information about
historical use and appliance breakdowns, participants showed better understanding when
being presented with the table format rather than with either of the graphical formats. For the
neighbor comparison information, participants understood the table and the histogram with
A similar pattern was found when conducting analyses separately for the verbatim and
complex items, although they were less likely to reach significance due to having lower
statistical power (see Supplemental Materials – Expanded Table 1).
There was also a main effect for energy literacy for all three pieces of electricity use
information. For the historical use information, F(1,186)=21.2, p2= .10, p<.001, participants
with high energy literacy (M=5.85; SD=.95) had higher understanding than those with low
energy literacy (M=5.05; SD=1.40). This same relationship held for the neighbor comparison
information, F(1,186)=6.18, p2= .03, p=.014 (M=4.94; SD=1.72 vs. M=4.34; SD=1.60) and
the historical appliance breakdown information, F(1,186)=9.03, p2= .05, p=.003 (M=4.93;
SD=1.29 vs. M=4.33; SD=1.44).
Effects on Preferences for Electricity Use Information
A Repeated-Measures ANOVA examined the effect of between-subjects variables
format (table vs. bar graph vs. icon graph) and respondents’ energy literacy (high vs. low) as
well as within-subjects variable of information type (historical use vs. neighbor comparison
vs. historical appliance breakdown) on preferences for the materials. There was no
significant main effect for format or energy literacy on preferences (p>.05). However, there
was a significant main effect of type of information, F(2, 378)=95.59, p2= .34, p<.001, with
Sidak’s post-hoc tests showing that, overall, the historical use information was preferred the
most (M=5.75, SD=1.12), followed by the historical appliance breakdown information
(M=5.26, SD=1.33), and lastly the neighbor comparison information (M=4.39, SD=1.62),
In addition, there was a significant interaction between type of electricity use
information and format, F(4, 378)=5.27, p2= .05, p<.001. A multivariate ANOVA showed
that the neighbor comparison information yielded a main effect of format, F(2, 190)=3.68,
p2= .04, p=.027, with Sidak’s post-hoc tests ( =.05) showing that the table was preferred
more than the histogram with bars, and the histogram with icons showing no difference
between either the table or histogram with bars (Table 2).
In addition, there was an interaction between the type of electricity use information
and energy literacy, F(2, 378)=5.01, p2= .03, p=.007. Simple t-tests showed that participants
with lower energy literacy preferred the historical use information significantly less than did
participants with higher energy literacy (M=5.56, SD=1.37 vs. M=5.88, SD=.89),
t(196)=-1.98, p=.049, with no significant differences for the other types of information ( =.05).
There were no additional interactions ( =.05).
[Table 2 near here]
Effects on Intentions to Save Electricity
A Repeated-Measures ANOVA examined the effect of format (table vs. bar graph vs.
icon graph), type of electricity use information (historical use vs. neighbor comparison vs.
historical appliance breakdown), and respondents’ energy literacy (high vs. low), on their
behavioral intentions. The only main effect was for content F(2, 366)=21.74, p2= .11, p<.001.
According to Sidak post-hoc tests ( =.05), intentions to save electricity in response to the
historical use information (M=5.71; SD=1.76) and historical appliance breakdown
information (M=5.42; SD=1.73) were significantly higher than those for the neighbor
Discussion
To reduce climate-change risks, it is important to help consumers to lower their
residential electricity use and associated carbon emissions (IPCC 2014). Better
communications about electricity use could be added to electricity bills, to provide a
relatively inexpensive strategy towards achieving this goal. We therefore sought to inform
the design of electricity bills by building on theories and methods of health communication
and graph comprehension. These literatures have posited that the effectiveness of
communication materials depends on the type of information, the presentation format, as
well as recipients’ background knowledge (Lipkus 2007; Peters, Hart, and Fraenkel 2011;
Shah, Freedman, and Vekiri 2005; Shah et al. 2009). Thus, we created table, bar graph, and
icon graph formats to provide information about a household’s historical electricity use,
comparisons to neighbors’ use, and historical appliance-specific use. We tested their effects
on recipients’ understanding, preferences for the presented information, and intentions to
save electricity, while taking into account individual differences in background knowledge
(i.e., energy literacy). Below we present our findings on these three outcome measures, and
their theoretical implications, followed by a discussion of limitations and practical
implications.
Improving Understanding of Electricity Use Information
Our first main finding is that the tables we designed to communicate electricity use
information were the easiest format for participants to understand. Independent of the
well or better than the icon graph format and consistently better than the bar graph format. A
qualitative study also found that tables presenting household electricity use information were
well-understood and preferred by consumers (Karjalainen 2011). These findings are in line
with theories suggesting that the table format provides the best ‘cognitive fit’ when tasks
require understanding simple point reading of a specific number, while graphical formats are
better for use with more complex tasks that require information integration and interpretation
(Friel et al. 2001; Shah and Hoeffner 2002; Vessey 1991). Indeed, as noted, electricity bills
may mostly be used for point reading of household electricity use, and simple comparisons to
previous use or that of neighbors.
Of course, other real-world contexts may require more complex interpretations of
information, which can be better communicated with graphs. For example, health
communications often involve the evaluation of health options’ risks and benefits, following
complex health regimes, and weighing short-term against long-term benefits
(Garcia-Retamero and Cokely 2011; Peters et al. 2007). Indeed, icon graph formats have shown
promise for communicating risk comparisons in the health domain (Garcia-Retamero and
Cokely 2013; Garcia-Retamero, Okan, and Cokely 2012).
Yet, even in the health domain, tables are sometimes better than graphs for
communicating straightforward numbers, such as the specific percent of a patient population
who will get sick (Hawley et al. 2008). Tables have also been found to be useful for the
presentation of financial statements that require the point reading of a specific number, while
graphs are better for processing more complex patterns in financial data (Davis 1989).
Although the table format was most effective across the types of information we
comparisons. In our study, the histogram with icons showed the location of a specific
household in the distribution of electricity use across neighbors (Figure 2C). Hence, it was
similar to a bar graph (Figure 2B), but replaced the bars with icons of houses. Recent
research in health communication has indicated that the types of icons that are used in the
graph can make a difference, with anthropomorphic icons such as restroom icons, head
outlines, and photo leading to better risk recall than other icons such as blocks or ovals
(Hawley et al. 2013). However, the effectiveness of the specific icons may depend on the
context under consideration, and the background knowledge of the recipients (Hawley et al.
2013, Stone et al. 1997). Although people have indicated that they like the presentation of
house icons (Egan 1999), icon types have not yet been studied in the context of electricity
use information.
Improving Preferences and Intentions to Save Electricity
Our second main finding is that preferences for the presented information and
intentions to save electricity were the strongest for the historical use information. Historical
use information is requested in qualitative interviews with consumers (Karjalainen 2011).
Even when electricity bills provide no historical use information, consumers may attempt to
understand trends in their use by comparing their current electricity bill with preceding ones
(Hayes and Cone 1981). Because individuals have a choice of whether or not to pay
attention to the presented information, it is important to design electricity bills that they are
willing to look at (Egan 1999). Presenting information that consumers prefer and perceive as
useful is an important goal for companies who seek to promote customer satisfaction
Possibly, historical use information evoked such positive responses due to its
familiarity and associated ease of processing, especially among individuals with higher
background knowledge (Shah and Freedman 2009). We deliberately presented historical use
information first, thus choosing a presentation order that would realistically be implemented
on electricity bills. Indeed, educators recommend allowing participants to learn from the
simple version of a task before asking them to tackle more complex versions (van
Merriënboer et al. 2003). Yet, we also recognize that it is important for future research to
test how many tasks can be presented before causing fatigue (Galesic and Bosnjak 2009;
Krosnick 1999), or how well individual complex tasks can be understood when simpler tasks
are not presented first.
Although historical use information can provide insights about a household’s overall
usage pattern, it has been criticized for making it difficult to interpret irregularities due to
extreme weather or long absences (Egan 1999; Karjalainen 2011). We are not aware of
studies that have tested whether consumers recognize such effects on their historical use
information. Another remaining empirical question is how to present more complex
historical use information that is corrected for local weather, so that recipients understand
and trust it. Moreover, research is needed to examine the long-term effects of bill-based
historical use information on electricity use behavior. When electricity use is already low,
historical use information should have little to no effect on motivations to save electricity,
and may even cause use to go up. Adding smiley face when use is low as compared to
neighbors avoids increases in use (Schultz et al. 2007). Possibly, adding a smiley face to the
electricity bill when historical use is low could also reduce adverse effects on low users, but
Interestingly, neighbor comparison information was not received as positively as
historical use information. In studies of communications about water use, consumers have
also been found to pay the most attention to historical use information, as compared to
neighbor comparisons and other types of information (Erickson, Podlaseck, Sahu, Dai, Chao,
and Naphade 2012). Yet, providing neighbor comparisons has shown promise in previous
work on electricity use, in terms of yielding positive responses (Egan 1999; Schultz et al.
2007). However, those studies did not directly compare neighbor comparisons with
historical use information, leaving it unclear which type of information consumers prefer.
Our study did compare recipients’ responses to different types of electricity use
information. In a within-subjects design, participants saw historical use information and
neighbor comparison information, as well as appliance-specific information. In qualitative
interviews, people had shown similar preferences (Karjalainen 2011). When making direct
comparisons, it is easier for people to identify the presentation they find most appealing and
comprehensible (Brewer et al. 2011). However, the ultimate test of the effectiveness of
electricity bill information should involve measures of actual household electricity use, with
the best information leading to the largest reductions.
Recognizing Individual Differences in Background Knowledge
Although initial studies had examined consumers’ responses to electricity bills (Egan
1999; Karjalainen 2011), none had examined the role of individual differences in recipients’
ability to understand the presented knowledge. Yet, individual differences in domain
knowledge are found to be important to table and graph comprehension (Shah and Freedman
information less, independent of the presented content or format. Thus, individuals with low
energy literacy may need to be provided with written descriptions of how to interpret the
presented information, and apply it to decisions about their own electricity use (Shah and
Hoeffner 2002).
In addition, low energy literacy participants found the historical use information less
useful than those with high energy literacy. Possibly, they found the historical use
information too technical. The health communication literature does indeed suggest that
individuals with low health numeracy prefer to focus on the qualitative rather than the
quantitative aspects of communications (Peters et al. 2007; Peters et al. 2011; Reyna et al.
2009; Ancker et al. 2006). Individuals with low numeracy may not want to think hard about
complex numerical information (Bruine de Bruin, McNair, Taylor, Summers, and Strough,
2015).
Our work included no performance measures of numeracy or graph literacy, both of
which are important for understanding graphs (Garcia-Retamero and Galesic 2010). Such
general skills promote graph comprehension beyond specific domain knowledge (Shah and
Freedman 2009). These specific skills may interact, such that individuals with low numeracy
and high graph literacy may benefit from having visual displays added to standard numerical
health risk information (Garcia-Retamero and Galesic 2010). Future research should
examine whether such effects are also seen in domains where simple ‘verbatim’ numbers are
the main focus of communication.
Taken together, these findings suggest that the type of information that is provided
could be tailored to the needs and wants of the individual. With the advance of online billing,
useful, in the format they prefer. Studies of in-home displays have indeed suggested that
people are interested in designing the information they receive about their electricity use,
though they may not always be good at selecting the information that they understand best
(Krishnamurti, Davis, Wong-Parodi, & Canfield, 2013).
Limitations
Like any study, ours had limitations. We summarize the main limitations here, even
though some have already been noted above. First, we presented participants with
hypothetical electricity bills and had no direct measure of electricity use, leaving it unclear
which type of information or format would have actually led to the most electricity savings.
Because field trials tend to be expensive, we conducted a cost-effective survey-based
experiment to identify the most promising bill designs (Fischhoff et al. 2011). Yet, to be
more confident about our findings, it is important to invest in randomized controlled field
trials in which the responses of actual consumers are followed over time after random
assignment to different electricity bills. Second, the presented information pertained to only
one month in which electricity use was relatively high, both compared to the household’s
own use and compared to that of their neighbors. As noted, information may be less
effective and even counter-productive when use is relatively low. However, presenting low
users with positive feedback in the form of a smiley face may encourage continued savings
(Schultz et al. 2007). Third, our understanding questions focused on point reading and
simple point comparisons, which are the types of tasks consumers face when being presented
with electricity bills. Our findings may not generalize to contexts that require more complex
are presented in graphical formats (Friel, Curcio, and Bright 2001; Shah and Hoeffner 2002;
Vessey 1991).
Practical Implications
Despite its limitations, our study suggests the possibility that information presented
on electricity bills may be better understood and preferred, as well as increase intentions to
save electricity, if they start presenting information about households’ historical use in table
format (rather than information about neighbor comparisons or appliance breakdowns, or
graphical formats). If additional information is provided, people prefer an appliance-specific
breakdown, which is also better understood in table format. It is likely that other billing or
account statements could also benefit from the presentation of tables with historical use
information. For example, our findings may also be useful for providing information about
consumers’ use of water, gas, telecommunications, and banking, especially if these tasks
involve point reading. To date, few studies have examined bill design in such contexts (for
exceptions see Egan 1999; Karjalainen 2011; Keller-Cohen 1989; Wilhite and Ling 1995).
Perhaps as a result, bills often provide no useful information for evaluating the need
to reduce electricity use (Fischer 2008). Even if tables and graphs are presented in
real-world contexts, they can be hard to understand (Beattie and Jones 1997; Woller-Carter, Okan,
and Cokely 2013). Because experts’ may not have good intuitions about how to present
information to non-experts, developing effective communications requires input from
interviews and survey-based experiments with the intended audience (Bruine de Bruin and
understanding the effect of content, format and individual differences on consumers’
responses to bill-based electricity use information.
Before widespread implementation of new bill designs, it is critical to empirically test
the usefulness of the presented information. Re-designed electricity bills may be augmented
with other strategies to promote long-term behavior change. Longitudinal field trials are
lacking in the domain of energy behavior, but promising strategies may include goal setting,
competitive games, incentive schemes, and real-time visual information through in-home
displays (Abrahamse et al. 2005; Fischer 2008). Similar strategies have been suggested for
promoting reductions in residential water use (Erickson et al. 2012). Each of these strategies
may benefit from being presented with electricity use information that promotes
understanding, preferences, and behavior change. Hence, our findings contribute to a
potential portfolio of strategies for reducing residential electricity use and curbing climate
change.
Footnote
1
To provide households with feedback about their appliance-specific electricity use,
homes may need to be instrumented with appliance-level meters. Lower-cost options
include estimating appliance use based on consumer-provided information (e.g.,
Residential Energy Consumption Survey, www.eia.gov/consumption/residential),
which may not be as accurate.
References
Abrahamse, W., Steg, L., Vlek, C., and Rothengatter, T. (2005). A review of intervention
studies aimed at household energy conservation. Journal of Environmental
Allcott, H. (2011). Social norms and energy conservation. Journal of Public Economics, 95,
1082–1095.
Ancker, J. S., and Kaufman, D. (2007). Rethinking Health Numeracy: A Multidisciplinary
Literature Review. Journal of the American Medical Informatics Association, 14,
713–721.
Ancker, J. S., Y. Senathirajah, R. Kukafka, and Starren, J. B. (2006). Design features of
graphs in health risk communication: A systematic review. Journal of the American
Medical Informatics Association, 13, 608-618.
Attari, S. Z., DeKay, M. L., Davidson, C. I., and Bruine de Bruin, W. (2010). Public
perceptions of energy consumption and savings. Proceedings of the National
Academy of Sciences, 107, 16054-16059.
Beattie, V., and Jones, M. J. (1997). A Comparative Study of the Use of Financial Graphs in
the Corporate Annual Reports of Major U.S. and U.K. Companies. Journal of
International Financial Management and Accounting, 8, 33–68.
Bergkvist, L., and Rossiter, J.R. (2007). The predictive validity of multiple-item versus
single-item measures of the same constructs. Journal of Marketing Research, 44,
175-184.
Brewer, N. T., Gilkey, M. B., Lillie, S. E., Hesse, B. W., and Sheridan, S. L. (2012). Tables
or Bar Graphs? Presenting Test Results in Electronic Medical Records. Medical
Decision Making, 32, 545–553.
Bruine de Bruin, W., and Bostrom, A. (2013). Assessing what to address in science
communication. Proceedings of the National Academy of Sciences, 110, 14062–
Bruine de Bruin, W., McNair, S.J., Taylor, A.L., Summers, B., and Strough, J. (2015).
“Thinking about numbers is not my idea of fun”: Need for cognition mediates age
differences in numeracy performance. Medical Decision Making, 35, 22-26.
Cavanaugh, K., Huizinga, M. M., Wallston, K. A., Gebretsadik, T., Shintani, A., Davis, D.,
et al. (2008). Association of numeracy and diabetes control. Annals of Internal
Medicine, 148, 737-746.
Cleveland, W. S., and McGill R. (1984). Graphical perception: Theory, experimentation, and
application to the development of graphical methods. Journal of the American
Statistical Association, 79, 531-554.
Davis, L. R. (1989). Report format and the decision maker's task: An experimental
investigation. Accounting, Organizations and Society, 14, 495–508.
DeWaters, J. E. and Powers, S. E. (2011). Energy literacy of secondary students in New
York State (USA): A measure of knowledge, affect, and behavior. Energy Policy, 39,
1699-1710.
Dietz, T., Gardner, G. T., Gilligan, J., Stern, P. C., and Vandenbergh, M. P. (2009).
Household actions can provide a behavioral wedge to rapidly reduce US carbon
emissions. Proceedings of the National Academy of Sciences, 106, 18452-18456.
Egan, C. (1999). Graphical displays and comparative energy information: What do people
understand and prefer? ACEEE Summer Study Proceedings. Retrieved from
http://www.eceee.org/conference_proceedings/eceee/1999/Panel_2/p2_12/paper.
Energy Information Administration (EIA). (2011). International Energy Statistics. Retrieved
on February 12, 2014 from
Energy Information Administration (EIA). (2012). U.S. Energy-Related Carbon Dioxide
Emissions, 2012. Retrieved on June 10, 2014 from
http://www.eia.gov/environment/emissions/carbon/
Erickson, T., Podlaseck, M. E., Sahu, S., Dai, J. D., Chao, T., and Naphade, M. (2012). The
Dubuque Water Portal: Evaluation of the Uptake, Use and Impact of Residential
Water Consumption Feedback. Presented at the CHI, Austin, Texas.
Estrada, C. A., Martin-Hryniewicz, M., Peek, B., Collins, C., and Byrd, J. (2004). Literacy
and Numeracy skills and anticoagulation control. American Journal of the Medical
Sciences, 328, 88-93.
Fagerlin, A., Ubel, P. A., Smith, D. M., and Zikmund-Fisher, B. J. (2007). Making numbers
matter: Present and future research in risk communication. American Journal of
Health and Behavior, 31, S47-S56.
Feldman-Stewart, D., N. Kocovski, B. A. McConnell, M. D. Brundage, and Mackillop, W. J.
(2000). Perception of quantitative information for treatment decisions. Medical
Decision Making, 20, 228-238.
Fischer, C. (2008). Feedback on household electricity consumption: A tool for saving
energy? Energy Efficiency, 1, 79-104.
Fischhoff, B., Brewer, N.T., and Downs, J.S. (2011). Communicating Risks and Benefits: An
Evidence-Based User’s Guide. Washington, DC: US Department of Health and
Human Services Food and Drug Administration.
Friel, S. N., Curcio, F. R., and Bright, G. W. (2001). Making Sense of Graphs: Critical
Factors Influencing Comprehension and Instructional Implications. Journal for
Galesic, M., and Bosnjak, M. (2009). Effects of Questionnaire Length on Participation and
Indicators of Response Quality in a Web Survey. Public Opinion Quarterly, 73, 349–
360.
Garcia-Retamero, R., and Cokely, E. T. (2013). Communicating Health Risks With Visual
Aids. Current Directions in Psychological Science, 22, 392–399.
Garcia-Retamero, R., and Cokely, E. T. (2011). Effective communication of risks to young
adults: Using message framing and visual aids to increase condom use and STD
screening. Journal of Experimental Psychology: Applied, 17, 270–287.
Garcia-Retamero, R., Okan, Y., and Cokely, E. T. (2012). Using Visual Aids to Improve
Communication of Risks about Health: A Review. The Scientific World Journal,
2012, 1–10.
Garcia-Retamero, R., and Galesic, M. (2010). Who profits from visual aids: Overcoming
challenges in people's understanding of risks. Social Science and Medicine, 70,
1019-1025.
Gardner, G. T., and Stern, P. C. (2008). The short list: The most effective actions U.S.
households can take to curb climate change. Environment Magazine, 50, 12-25.
Hawley, S.T., B. Zikmund-Fisher, P. Ubel, A. Jancovic, T. Lucas, and Fagerlin, A. (2008).
The impact of the format of graphical presentation on health-related knowledge and
treatment choices. Patient Education and Counseling, 73, 448-455.
Hayes, S.C., and Cone, J.D. (1981). Reduction of residential consumption of electricity
Hegarty, M., Smallman, H. S., and Stull, A. T. (2012). Choosing and using geospatial
displays: Effects of design on performance and metacognition. Journal of
Experimental Psychology: Applied, 18, 1–17.
Hertwig, R., & Ortmann, A. (2001). Experimental practices in economics: A methodological
challenge for psychologists? Behavioral and Brain Sciences, 24, 383-451.
Ibrekk, H., and Morgan, M. G. (1987). Graphical Communication of Uncertain Quantities to
Nontechnical People. Risk Analysis, 7, 519–529.
IPCC. (2014). Climate change 2014: Mitigation of Climate Change. Summary for Policy
Makers. Downloaded from: http://www.ipcc.ch/report/ar5/wg3/
Iyer, M., Kempton, W., and Payne, C. (2006). Comparison Groups on Bills: Automated,
Personalized Energy Information. Energy and Buildings, 38, 988–996.
Johnson, B. B., and Slovic, P. (1995). Presenting Uncertainty in Health Risk Assessment:
Initial Studies of Its Effects on Risk Perception and Trust. Risk Analysis, 15, 485–
494.
Karjalainen, S. (2011). Consumer preferences for feedback on household electricity
consumption. Energy and Buildings, 43, 458–467.
Keller Cohen, D. (1987). Organizational contexts and texts: The redesign of the Midwest bell
telephone bill. Discourse Processes, 10, 417–428.
Krishnamurti, T., Davis, A. L., Wong-Parodi, G., Wang, J., & Canfield, C. (2013). Creating
an in-home display: Experimental evidence and guidelines for design. Applied Energy,
108, 448–458.
Krishnamurti, T., Schwartz, D., Davis, A., Fischhoff, B., Bruine de Bruin, W., Lave, L. and
research approach to understanding consumer expectations about smart meters.
Energy Policy, 41, 790-797.
Krosnick, J. A. (1999). Survey Research. Annual Review of Psychology, 50, 537–567.
Lipkus, I.M. (2007). Numeric, verbal, and visual formats of conveying health risks:
Suggested best practices and future recommendations. Medical Decision Making, 27,
696-713.
Lipkus, I. M., and Hollands, J. G. (1999). The Visual Communication of Risk. Journal of the
National Cancer Institute Monographs, 25, 149–163.
Lipkus, I. M., and Peters, E. (2009). Understanding the Role of Numeracy in Health:
Proposed Theoretical Framework and Practical Insights. Health Education and
Behavior, 36, 1065–1081.
van Merriënboer, J.J.G., Kirschner, P.A., and Kester, L. (2003). Taking the load off a
learner’s mind: Instructional design for complex learning. Educational Psychologist,
38, 5-13.
Miron-Shatz, T., Hanoch, Y., Graef, D., and Sagi, M. (2009). Presentation format affects
comprehension and risk assessement: The case of prenatal screening. Journal of
Health Communication, 14, 439-450.
Morgan, M. G., Fischhoff, B., Bostrom, A., and Atman, C. J. (2002). Risk communication: A
mental models approach. Cambridge Univ Press.
Owens, S. and Driffill, L. (2008). How to change attitudes and behaviors in the context of
National Environmental Education and Training Foundation (NEETF). (2002). Americans’
low “energy IQ:” A risk to our energy future. Retrieved from
http://www.neefusa.org/pdf/roper/Roper2002.pdf.
Pacala, S. and Socolow, R. (2004). Stabilization wedges: Solving the climate problem for the
next 50 years with current technologies. Science, 305, 968-72.
Peters, E., Dieckmann, N., Dixon, A., Hibbard, J. H. and Mertz, C. K. (2007) Less is more in
presenting quality information to consumers. Medical Care Research and Review, 64,
169-190.
Peters, E., Hart, P. S. and Fraenkel, L. (2011). Informing patients: The influence of numeracy,
framing, and format of side effect information on risk perception. Medical Decision
Making, 31, 432-436.
Reyna, V.F., W.L. Nelson, P.K. Han, and Dieckmann, N.F. (2009). How numeracy
influences risk comprehension and medical decision making. Psychological Bulletin,
135, 943-973.
Rowe, A., Gibson, J. M., Bruine de Bruin, W., and Stone, E. R. (2013). Impact of
communication format on perception and understanding of unexploded ordnance
risks at closed military bases. Environmental Science and Technology, 47, 4004-4013
Schapira, M. M., Nattinger, A. B., and McHorney, C. A. (2001). Frequency or Probability? A
Qualitative Study of Risk Communication Formats Used in Health Care. Medical
Decision Making, 21, 459–467.
Schultz, P. W., Nolan, J. M., Cialdini, R. B., Goldstein, N. J., and Griskevicius, V. (2007).
The constructive, destructive, and reconstructive power of social norms.
Shah, P., and Freedman, E. G. (2009). Bar and Line Graph Comprehension: An Interaction of
Top-Down and Bottom-Up Processes. Topics in Cognitive Science, 3, 560–578.
Shah, P., Friedman, E. G., and Vekiri, I (2005). The comprehension of quantitative
information in graphical displays. In P. Shah and A. Miyake (Eds.), The Cambridge
Handbook of Visuospatial Thinking (pp. 426-476). New York: Cambridge University
Press.
Shah, P., and Hoeffner, J. (2002). Review of Graph Comprehension Research: Implications
for Instruction. Educational Psychology Review, 14, 47–69.
Sørensen, K., Van den Broucke, S., Fullam, J., Doyle, G., Pelikan, J., Slonska, Z., et al.
(2012). Health literacy and public health: A systematic review and integration of
definitions and models. BMC Public Health, 12, 80.
Spiegelhalter, D., Pearson, M., and Short, I. (2011). Visualizing uncertainty about the future.
Science, 333, 1393-1400.
Stone, E. R., Sieck, W. R., Bull, B. E., Frank Yates, J., Parks, S. C., and Rush, C. J. (2003).
Foreground:background salience: Explaining the effects of graphical displays on risk
avoidance. Organizational Behavior and Human Decision Processes, 90, 19–36.
Stone, E. R., Yates, J. F., and Parker, A. M. (1997). Effects of numerical and graphical
displays on professed risk-taking behavior. Journal of Experimental Psychology:
Applied, 3, 243-256.
Vessey, I. (1991). Cognitive Fit: A Theory-Based Analysis of the Graphs Versus Tables
Literature. Decision Sciences, 22, 219–240.
Wanous, J.P., Reichers, A.E., and Hudy, M.J. (1997). How good are single-item measures?
Weinstein, N. D., and Sandman, P. M. (1993). Some Criteria for Evaluating Risk Messages.
Risk Analysis, 13, 103–114.
Wilhite, H. and Ling, R. (1995) Measured energy savings from a more informative energy
bill. Energy and Buildings, 22, 145-155.
Woller-Carter, M.M., Okan, Y., Cokely, E.T., and Garcia-Retamero, R. (2013).
Communicating and distorting risks with graphs: An eye-tracking study. Proceedings
of the human factors and ergonomics society annual meeting, 56, 1-5.
Zografakis, N., Menegaki, A. N., and Tsagarakis, K. P. (2008). Effective education for
Table 1: Proportion of correct responses to the seven understanding questions.
Electricity use information Table formats
Bar graph formats
Icon graph formats
Historical use .84bi
(.16)
.73 (.20)
.77 (.17)
Neighbor comparisons .75b
(.19)
.49 (.22)
.75b (.21)
Appliance breakdown .73bi
(.19)
.64 (.20)
.61 (.18)
Table 2: Mean (SD) ratings of preferences for information.
Electricity use information Table format
Bar graph format
Icon graph format
Historical use 5.67
(1.12)
5.72 (1.14)
5.85 (1.11)
Neighbor comparisons 4.80b
(1.51)
4.09 (1.55)
4.26 (1.72)
Appliance breakdown 5.41
(1.21)
5.41 (1.14)
4.97 (1.57)
Figure 1. Historical use information as presented to participants in (a) a table format, (b) a bar graph format, and (c) an icon graph format.
(A)
Imagine that this table shows the Smith’s electricity use. This table shows their historical
(B)
Imagine that this graph shows the Smith’s electricity use. This graph shows their historical
(C)
Imagine that this graph shows the Smith’s electricity use. This graph shows their historical
Figure 2. Neighbor comparison information as presented to participants in (a) a table format, (b) a bar graph format (histogram with bars), and (c) an icon graph format (histogram with icons).
(A)
Imagine that this table shows the Smith’s electricity use compared to their neighbors. This
shows how much electricity the Smiths used in total last month compared to 20 of their neighbors.
(B)
Imagine that this graph shows the Smith’s electricity use compared to their neighbors. This
shows how much electricity the Smiths used in total last month compared to 20 of their neighbors.
(C)
Imagine that this graph shows the Smith’s electricity use compared to their neighbors. This
shows how much electricity the Smiths used in total last month compared to 20 of their neighbors.
Figure 3. Historical appliance breakdown information as presented to participants in (a) a table format, (b) a bar graph format, and (c) an icon graph format.
(A)
Imagine that this table shows the Smith’s electricity use by appliance. This table shows personalized estimates of how much electricity their appliances used over the last year.
The Smith’s house has central A/C for cooling and mostly uses natural gas instead of
(B)
Imagine that this graph shows the Smith’s electricity use by appliance. This graph shows
personalized estimates of how much electricity their appliances used over the last year.
The Smith’s house has central A/C for cooling and mostly uses natural gas instead of electricity for heating. However, they do have a few electric space heaters that are shown on this graph. The kitchen appliances include a refrigerator, freezer, dishwasher, and
(C)
Imagine that this graph shows the Smith’s electricity use by appliance. This graph shows
personalized estimates of how much electricity their appliances used over the last year.
The Smith’s house has central A/C for cooling and mostly uses natural gas instead of
electricity for heating. However, they do have a few electric space heaters that are shown on this graph. The kitchen appliances include a refrigerator, freezer, dishwasher, and