A STUDY ON SERUM URIC ACID LEVELS IN
ACUTE MYOCARDIAL INFARCTION
Dissertation submitted to
THE TAMIL NADU DR. M.G.R. MEDICAL UNIVERSITY
In partial fulfillment of the regulations
For the award of the degree of
MD GENERAL MEDICINE
GOVT. TIRUNELVELI MEDICAL COLLEGE & HOSPITAL
TIRUNELVELI
THE TAMIL NADU DR. M.G.R. MEDICAL UNIVERSITY CHENNAI, TAMIL NADU
ii
CERTIFICATE
This is to certify that the dissertation entitled
“A STUDY ON
SERUM URIC ACID LEVELS IN ACUTE MYOCARDIAL
INFARCTION”
submitted by Dr. L. Sivaranchani to the faculty of
General Medicine, The Tamil Nadu Dr. M.G.R. Medical University,
Chennai, in partial fulfillment of the requirement for the award of
M.D. degree Branch I (General Medicine) is a bonafide research work
carried out by her under my strict supervision and guidance.
Dr.M.RAVICHANDRAN M.D., Dr.R.GEETHA RANI M.D.,
Professor of Medicine, Professor and Head of the
Department of Internal Medicine, Department of Medicine,
Tirunelveli Medical College, Tirunelveli Medical College,
Tirunelveli Tirunelveli.
Dr. M.MANOHARAN M.S.,
The Dean,
iii
DECLARATION
I, Dr.L.Sivaranchani, solemnly declare that this
dissertation titled
“A Study on Serum Uric Acid Levels in Acute
Myocardial Infarction”
is a bonafide work done by me at
Tirunelveli Medical College from January 2011 to September 2012
under the supervision and guidance of my unit chief,
Prof. Dr.M.Ravichandran M.D.,
Professor of Medicine.
This dissertation is submitted to TamilNadu Dr. M.G.R.
Medical University, towards partial fulfillment of regulations for the
award of M.D. degree in General Medicine.
PLACE: TIRUNELVELI (DR.L.SIVARANCHANI)
DATE:
iv
ACKNOWLEDGEMENT
I thank our dean, Dr. Manoharan M.S., Tirunelveli Medical College for allowing me to avail the facilities needed for my dissertation work.
I am extremely thankful to our beloved Professor and Head of the
Department of Internal Medicine, Dr. R.Geetha Rani M.D., for having approved
this study and for her valuable guidance.
I express my sincere heart felt gratitude to our beloved unit chief,
Prof.Dr.Ravichandran M.D., for his motivation, guidance and valuable
suggestions and criticisms.
I extend my sincere thanks to our unit Asst. Professors, Dr. Manjula
MD, Dr. Thomas Kingsley MD DTCD., and Dr. Shankaranarayanan MD.,DM.,
for their invaluable support and guidance.
I express my gratitude to our Professor of Cardiology,
Dr. Ravichandran Edwin MD., DM who allowed me to carry out this study in
the cardiac intensive care unit and for his valuable guidance.
I thank my patients without whom this study would not have been
possible.
I extend my love and gratitude to my parents and friends for their
vi
CONTENTS
Sl. NO
TOPIC
PAGE
1 INTRODUCTION
1
2
AIMS OF THE STUDY
4
3
REVIEW OF LITERATURE
5
4 MATERIALS
AND
METHODS
44
5
RESULTS AND OBSERVATIONS
48
6 DISCUSSION
83
7 CONCLUSION
90
8 REFERENCES
92
9 ANNEXURES
1
INTRODUCTION
Acute Coronary Syndrome is one of the leading causes of mortality in our
country. With the increasing incidence of Diabetes and metabolic syndrome, we
are encountering more cases of myocardial infarction with increasing severity.
For the past two decades, there has been an increasing trend of chronic
metabolic diseases globally against a back drop of infectious diseases. This
epidemiological transition has been described as three basic stages by Omran :
Pestilence and famine, Receding pandemics, Manmade and degenerative
diseases. Olshansky1 added a fourth stage, delayed degenerative diseases.
FOUR STAGES OF EPIDEMIOLOGICAL TRANSITION (TABLE1)
STAGE
PROPORTION OF DEATHS DUE TO CVD
MAJOR TYPE OF CVD
Pestilence
&famine <10%
RHD, Cardiomyopathy due to malnutrition and infection
Receding
Pandemics 10-35% RHD, Hypertension, CAD, Stroke Degenerative
diseases 35-65% Stroke , CAD Delayed
degenerative diseases
2
GLOBAL BURDEN OF CAD 1
Of the 45 million adult deaths reported in 2002, more than three quarters
were due to non-communicable diseases(WHO 2003)30. In the twentieth
century, less than 10% of deaths were due to coronary artery disease. By the
beginning of 21 st century, CAD accounted for almost half of all deaths in the
developed world and 25% in the developing world2. By 2020, it has been
predicted that CAD will claim about 25 million lives annually around the world.
Globally, Ischaemic Heart Disease was the leading killer in the age group
>60 years. In adults aged 15-59 years, Ischaemic Heart Disease was the second
leading cause of mortality, second only to HIV/AIDS1.
Although the use of prediction models like the Framingham’s study
greatly increases the detection of atherosclerotic risk, about 20% of myocardial
infarction occurs in the absence of classical vascular risk factors. Many trials
have been conducted to identify novel markers and risk factors of
atherosclerosis. Similarly, there are only a few clinical predictors of prognosis
in acute coronary syndromes (the Killip staging ,TIMI and GRACE scores) .
The need for biochemical cardiac markers in predicting major adverse cardiac
events (MACE) and mortality has been realized in the recent past. Recent
studies have focussed on the prognostic significance of novel markers like hs-
3
Uric acid is a marker of oxidative stress that reflects the inflammatory
process occuring in atherosclerotic plaques and has also been linked to
endothelial dysfunction and cell death. It is one of the most studied markers in
ACS and other multifactorial diseases like obesity, hypertension, metabolic
syndrome and stroke. Studies have ended up with conflicting results, with some
studies showing a strong correlation, while others have not demonstrated a clear
association. Similarly, a few studies carried out in populations with acute
coronary syndrome have shown that uric acid is an independent marker of
adverse cardiac outcomes in both short term and long term, while some studies
refute it.
In this study, we have focussed on the association of uric acid with
various clinical prognostic indicators, major adverse cardiac events(MACE) and
mortality in patients presenting with acute ST Elevation MI
4
AIMS OF THE STUDY
• To assess the prevalence of hyperuricemia in patients with Acute ST
Elevation MI
• To study the association of uric acid levels with various risk factors of
cardiovascular disease in these patients
• To study the association of uric acid levels with Killip Class, TIMI risk
score and adverse cardiac events
• To assess the usefulness of uric acid as an independent prognostic marker
of short term mortality in Acute STEMI
5
REVIEW OF LITERATURE
CAD - TRENDS IN INDIAIn India, CAD incidence is on the rising scale for the past 40 years
whereas a declining trend has been noted in the western countries. Mortality due
to CAD is expected to rise by 103% in Indian men and 90% in women from
1975 to 2015.(Bulatao and Stephens 1992) .
The Study of Health Assessment and Risk in Ethnic groups(SHARE) has
reported a higher incidence of cardiovascular events among South Asians when
compared to Europeans and Chinese3 . Asian Indians are at three times higher
risk of CAD than white Americans, six times higher than Chinese and 20 times
higher than Japanese.(Ghaffar et al. 2004) . The SHARE study showed that
atherosclerosis was higher among Europeans while thrombosis was higher
among South Asians, suggesting a thrombogenic profile prevailing among
South Asian population3. A study in the South East Asian population by
Meenakshisundaram et al has brought out that many subjects had an MI even in
the presence of low BMI and interestingly, dyslipidemia was not present in
most of the studied population27. This may be seen in two perspectives: South
East Asians have a lower BMI threshold to be called obese. Many other studies
have also brought out this fact. Hence the ideal BMI in this population is <23
6
obese27. This result may also indicate an existing thrombogenic profile in the
South East Asian population.
However, the INTERHEART study, one of the largest case control
studies, has not proved any ethnic risk factors in South Asians29. This study
explained that traditional risk factors like smoking, alcoholism, diabetes,
hypertension, high waist-hip ratio, dyslipidemia, sedentary life style accounts
for more than 90% of CAD events in South Asians.The ICMR study performed
in Delhi and Vellore in 1990s reported higher prevalence of CAD in North
India29.
TRENDS IN TRADITIONAL CARDIOVASCULAR RISK FACTORS
Diabetes, hypertension, dyslipidemia, triglyceridemia, metabolic
syndrome, smoking , alcoholism, family history of myocardial infarction are the
traditional risk factors.
A 35 year trend in BMI, systolic BP and cholesterol has been reported
from 199 high income, low income and middle income countries by the Global
Burden of Diseases Chronic Disease Risk Factors Collaborating Group1 from
1980-2005. A trend for increasing BMI was noted in all these countries, with
greater rise in high income countries. Mean systolic BP increased in low
income countries and dropped in high and middle income countries4. Mean
7
and middle income countries. In India , data is similar to that in low income
countries.
Epidemiological studies performed in various states have shown that
obesity , hypertension, self reported diabetes are common in Kerala and Tamil
Nadu, while smoking is common in Mizoram. In India, the cardiovascular risk
factors are more prevalent in the urban areas in contrast to the western countries
where it is equal in both urban and rural population29
NOVEL RISK FACTORS CRP5
CRP has long been recognised as an inflammatory marker and it provides
an indirect evidence of the inflammatory milieu of atherosclerosis. Emerging
evidence shows that CRP has a direct causal effect on atherosclerosis31. CRP
binds to oxidized LDL, promoting its uptake by the macrophages in the
atherosclerotic plaque , thereby perpetuating the process5. hs-CRP levels help
us to start statin therapy in high risk individuals. simvastatin reduces CRP levels
even before it reduces LDL levels.
LIPOPROTEIN a
Lp(a) is a similar molecule as LDL except for the addition of
apolipoprotein --apo(a). It resembles plasminogen5 in structure and thereby
thought to play a role in thrombosis. It also accumulates in atherosclerotic
8
Lp (a) >30 mg/dl increases the cardiovascular risk5)31. Niacin is the only
available drug that reduces the level of Lp(a).
HOMOCYSTEINE
Homocysteine impairs the production of endothelial nitric oxide,
increases the proliferation of smooth muscle cells in the atherosclerotic plaque
and activates protein c5, thereby promoting thrombosis.
FIBRINOGEN
It is a protein synthesized in liver, that activates thrombin, stimulates
platelet aggregation, and increases smooth muscle proliferation in the
atherosclerotic plaque. Age, menopause, smoking, stress, obesity increases the
levels of fibrinogen. Pentoxifylline, omega 3 fatty acids, fibrates, ticlopidine
reduces the fibrinogen levels.
MYELOPEROXIDASE
MPO is released during degranulation of leucocytes in an atherosclerotic
plaque. It has been shown to predict the 30 day mortality after NSTEMI. Levels
of myeloperoxidase increase with endothelial dysfunction. It has been observed
that myeloperoxidase is an even stronger predictor of cardiovascular events than
9
ATHEROSCLEROSIS AND CORONARY ARTERY DISEASE
Experimental results in animals and humans have shown that fatty streak
is the initial manifestation of atherosclerosis. This has been increasingly
recognised as an inflammatory process resulting in the formation of reactive
oxygen species and endothelial damage50. LDL particles accumulate within the
intima and associate with proteoglycans in the extracellular matrix. This
sequestration favours oxidative modification of lipoproteins, which trigger an
inflammatory reaction, that results in leucocyte recruitment. The leucocytes
exhibit receptors for modified lipoproteins and start ingesting more oxidised
lipids and transform into foam cells. As the lesion evolves, smooth muscle cells
from the media migrate into the expanding intima and lay down an extracellular
matrix there and form an atherosclerotic plaque. In the heart, atherosclerotic
process shows a predilection for the proximal left anterior descending artery50.
PLAQUE RUPTURE
A superficial erosion of the endothelium or a plaque rupture produces a
thrombus that occludes the vessel and causes an acute coronary syndrome due
to the lack of a well formed collateral circulation. Morphometric studies of
these atherosclerotic plaques have shown that macrophages and lymphocytes
predominate in these lesions rather than the smooth muscle cells. Patients with
active atherosclerotic process and those with acute coronary syndromes exhibit
10
plaques and endothelial cells remote from the culprit lesion exhibit markers of
inflammation51. The integrity of the plaque is decided by these inflammatory
markers. IFN gamma found in these lesions inhibits the proliferation of smooth
muscle cells. Cytokines produced by activated leucocytes increase the formation
of proteolytic enzymes that degrade the matrix of the fibrous cap. Thus these
inflammatory mediators inhibit the collagen synthesis required for the repair of
the eroded fibrous cap and also makes it thin and prone for rupture (hence called
the vulnerable plaques). These plaques have a thin fibrous cap and matrix and
more inflammatory cells, that trigger thrombotic and fibrinolytic processes,
which cause acute arterial occlusion and result in acute coronary syndrome.
This knowledge about pathogenesis of atherosclerosis is very important
in identifying newer mechanisms linking it to various risk factors and the ways
in which current therapies improve outcomes and in finding out newer
therapeutic targets.
ACUTE CORONARY SYNDROME
Patients with ischaemic heart disease fall into two categories : Stable
angina and Acute coronary syndromes(ACS). ACS can be subdivided into three
groups based on the ECG findings and cardiac markers: ST elevation MI; Non
ST elevation MI and Unstable angina. Unstable angina and NSTEMI occur due
to plaque erosion or rupture with a non occlusive thrombus. They are usually
11
fibrin thrombi(red thrombi). When patients present with non ST elevation ACS ,
cardiac markers are helpful in differentiating unstable angina and NSTEMI.
Patients with UA/NSTEMI usually have multiple vulnerable plaques.
Patients with unstable angina and multiple risk factors are at increased
risk of developing ST elevation MI. ST elevation is produced by complete
occlusion of an epicardial coronary artery. While evaluating a STEMI, we have
to consider the temporal phase of the infarction: a) acute phase, lasting from the
first few hours to 7 days; b)healing phase- 7 to 28 days ; c)healed phase ->29
12
CLINICAL CLASSIFICATION OF MYOCARDIAL INFARCTION5
(J Am Coll Cardiol 2007)
TYPE 1 – Spontaneous MI related to ischaemia from a coronary plaque
rupture or dissection
TYPE 2 – MI due to ischaemia resulting from invreased oxygen demand or
decreased supply
TYPE 3 – Sudden cardiac death with symptoms of ischaemia, new ST
elevation, or LBBB or coronary thrombus
TYPE 4a – MI associated with PCI
TYPE 4b – MI associated with stent thrombosis
TYPE 5 – MI associated with CABG
FIBRINOLYTIC THERAPY IN STEMI
Fibrinolytic therapy reduces the risk of mortality in STEMI by 50% while
administered within an hour of onset of symptoms . When administered early,
fibrinolytic therapy reduces the infarct size, limits LV dysfunction, reduces the
incidence of complications of STEMI like ventricular septal rupture,
arrhythmias and cardiogenic shock. It is proved to be of benefit when
13
benefit till a period of 12 hours, especially when the pain is persisting or ST
segment remains elevated13. Patients < 75 years of age attain greater risk
reduction with fibrinolytic therapy when compared to older individuals53.
MAJOR ADVERSE CARDIAC EVENTS
The following are the commonest adverse cardiac events occuring in
patients with ST elevation MI53:
1. Ventricular dysfunction
2. Pump failure
3. Cardiogenic shock
4. Right ventricular infarction
5. Arrhythmias
6. Recurrent angina
7. Pericarditis
8. Thromboembolism
9. Left ventricular aneurysm
10. Reinfarction
11. Ventricular septal rupture
14
ARRHYTHMIAS
Arrhythmias are the most common complications of myocardial
infarction. Various rhythm disturbances occuring during MI include ventricular
premature beats, accelerated idioventricular rhythm, ventricular tachycardia,
ventricular fibrillation, sinus bradycardia,atrioventricular and intraventricular
conduction disturbances. Among these, ventricular premature beats are
commonly encountered . According to current guidelines , prophylactic anti
arrhythmic drugs are contraindicated unless a clinically important ventricular
arrhythmia occurs. Beta blockers are ideal in case of frequent ventricular
premature beats. Accelerated idioventricular rhythm or slow VT occurs
transiently during thrombolytic therapy and is benign and does not lead to
ventricular tachycardia13. Sinus bradycardia and atrioventricular conduction
blocks occurs most commonly in inferior wall MI and may require pacing .
LV FAILURE AND CARDIOGENIC SHOCK
Hemodynamic evidence of LV dysfunction appears when left ventricular
contraction is impaired in 20-25% of the ventricle. >40% of left ventricular
infarction results in cardiogenic shock53. Patients with acute MI and cardiogenic
shock usually have triple vessel disease with frequent involvement of LAD.
15
cardiogenic shock in MI are right ventricular infarction, ventricular septal
rupture, acute mitral regurgitation, cardiac tamponade and free wall rupture.
POST- MYOCARDIAL INFARCTION RISK STRATIFICATION
After diagnosing a myocardial infarction, a physician’s goal must be to
risk stratify patients, treat complications and to initiate risk factor modification.
The following factors help to predict inhospital mortality and recurrent cardiac
events
PREDICTORS OF IN HOSPITAL MORTALITY53
1. older age
2. tachycardia
3. hypotension
4. Killip class>1
5. Anterior wall infarction
6. Previous infarction
7. LV dysfunction and Heart failure
8. Malignant arrhythmias like supraventricular tachycardia, ventricular
fibrillation and ventricular fibrillation
9. Elevated initial serum creatinine
16
11.New ST segment changes either depression or elevation
12.Severe coronary artery disease
13.Poor glycemic control
14.Anaemia
AGE
Age is the most important mortality predictor post MI. Older patients are
at risk of recurrent MI and the mortality rates are higher in the elderly. More
number of older individuals present with atypical symptoms and the risk of
bleeding is also high in the elderly, when compared to younger individuals.
KILLIP STAGING
Killip and Kamball described four classes in MI based on clinical
presentation and hemodynamic status. This helps to assess the prognosis of
patients presenting with MI.
KILLIP CLASS CLINICAL FINDINGS MORTALITY
I No evidence of CCF 5.1%
II Rales/ raised JVP/S3 13.6%
III Pulmonary edema 32.2%
IV Cardiogenic shock 57.8%
17
LV FUNCTION
This is the second most important predictor of mortality. Ejection
fraction<40% is associated with a poor prognosis. Usually, shock occurs when
atleast 40% of the left ventricular mass undergoes infarction53. But recent
studies have shown that shock occurs due to inappropriate vasodilatation
combined with ventricular dysfunction. The raised inflammatory markers and
nitric oxide synthase suggest a systemic inflammatory response syndrome that
is responsible for sustaining the cardiogenic shock. There are various available
options for assessing left ventricular function . These include echocardiography,
radionuclide angiography and left ventriculography. No modality has been
proved superior to the other but cost and availability are important determinants.
Echocardiography is the most commonly used imaging modality.
CARDIAC MARKERS
A few cardiac markers have been found useful in risk stratification of
acute MI patients. Among the traditional markers, CK MB has the disadvantage
of a short half life, though higher levels are associated with high mortality rates.
Troponin, B-type natriuretic peptide and C- Reactive Protein have been found
18
OTHER FACTORS
Women have a later age of onset of MI but the mortality rates remain the
same in both men and women. Women have higher risk of bleeding.
Patients with diabetes are at a higher risk of death and adverse events ,
but the treatment in both groups is the same. Anti platelet agents have a
consistent or enhanced effect in patients with diabetes.
About 30-40% of the patients with MI have renal dysfunction and is
associated with a bad prognosis and increases the risk of bleeding.
RISK MODELS IN ACUTE MYOCARDIAL INFARCTION
Certain risk scores have been formulated using the above mentioned
factors to assess the prognosis of the patients presenting with STEMI.They are:
1. TIMI score( Thrombolysis in Myocardial Infarction)
2. The GRACE score ( Global Registry of Acute Coronary Events)
3. The GISSI score( Gruppo Italiano per lo Studio della Sopravvivenza
nell’Infarto Miocardio
TIMI RISK SCORE IN STEMI33
David A. Morrow et al has formulated a simple, bedside, clinical score
for risk assessment of ST elevation MI (Circulation 2000;102:2031-2037). This
is a useful bedside method of predicting 30 day mortality in patients with
19
SL NO VARIABLES SCORES
1 AGE 65-74 YEARS 2
AGE> 75 YEARS 3
2 SYSTOLIC BP<100 3
3 HEART RATE>100 2
4 KILLIP II-IV 2
5 ANTERIOR STE OR LBBB 1
6 DIABETES, H/O ANGINA/HYPERTENSION 1
7 WEIGHT<67 kg 1
8 TIME TO TREATMENT>4 HRS 1
This risk scoring was derived from patients with ST Elevation MI,
eligible for thrombolysis. It has been observed that patients ineligible for
thrombolysis were at higher risk of developing adverse cardiac events and
hence were excluded from the trials. The 30 day mortality was 44% among
those with TIMI score 0 and rose to 77% when TIMI score was more than 833.
The maximum TIMI score that can be obtained is 14.
ASSESSMENT OF RESIDUAL ISCHAEMIA
As seen already, severe CAD and recurrent angina are strong predictors
of mortality in a patient with myocardial infarction53. So submaximal stress
testing has been advocated for patients who are not in failure for at least 2 days
20
MI. Patients who can ahcieve upto 3 METs carry a good prognosis. Usually
exercise stress testing is done but in case of unpredictable ECG pattern like left
bundle branch block, baseline ST segment changes or left ventricular
hypertrophy, exercise stress testing is contraindicated and we have to go for
pharmacological stress testing using dobutamine or adenosine. ACC
recommends stress testing within 72 hours of discharge in all patients with uncomplicated infarction53. Significant ST segment changes during exercise, hypotension or inability to achieve 3 METS is a sign of poor prognosis and such
patients warrant coronary angiography.
ROLE OF CARDIAC BIOMARKERS IN DIAGNOSIS AND RISK SRATIFICATION OF PATIENTS WITH MI
Laboratory evidence of myocardial necrosis is always an integral part in
diagnosing and treating acute coronary syndrome. Cardiac biomarkers have
been used in conjunction with history and ECG findings in order to confirm the
diagnosis of myocardial infarction. An ideal marker has to be specific to the
myocardium, sensitive, and quantitative and there should be an early rise in the
serum levels of the markers. CPK-MB and Troponin are traditional cardiac
biomarkers used at present to diagnose infarction. These markers have certain
limitations. As myocardial necrosis is time dependent, these markers may be
21
When evaluating a novel marker physicians should consider whether
1.there is a standardized and reproducible assay for the marker of interest;
2.there are consistent prospective studies demonstrating that the given
parameter predicts future risk; 3. The novel marker adds to the predictive value
of lipid screening 4. There is evidence that it adds to global risk prediction
scores like the Framingham’s study. Also to be considered is the relative
magnitude of novel markers in terms of risk prediction, particularly in
comparison to lipid profile. These markers may refine risk assessment and some
of them have prognostic significance.
Among the traditional cardiac biomarkers, only troponin has a role in
predicting adverse cardiac events. CPK MB has a short half life and is also
relatively less specific for myocardial infarction. Certain novel biomarkers,
when measured in combination with CK-MB or troponin helps in risk
stratification of patients with acute MI51.
NOVEL BIOCHEMICAL CARDIAC MARKERS5
1.MARKERS OF INFLAMMATION
♦ Hs- CRP
♦ Myeloperoxidase
♦ Pregnancy associated plasma protein A,
22
♦ Interleukin -6(IL-6)
♦ VCAM , ICAM-1
3. MARKERS OF HAEMODYNAMIC STRESS OR NEUROHORMONAL
ACTIVATION
♦ BNP, NT-pro BNP
4. MARKERS OF VASCULAR DAMAGE
♦ Creatinine Clearance
♦ Cystatin C
5. MARKERS OF ACCELERATED ATHEROSCLEROSIS
♦ HbA1C
6. MARKERS OFTHROMBOSIS & PLATELET ACTIVATION
♦ Von Willebrand factor antigen
♦ Plasminogen Activator Inhibitor 1
♦ Tissue- Plasminogen Activator
♦ Fibrinopeptide A
♦ Prothrombin fragment 1+2
♦ Factors V,VII and VIII
23
MARKERS OF INFLAMMATION & OXIDATIVE STRESS
Atherosclerosis is basically an inflammatory disease. Understanding the
pathogenesis of atherosclerosis has led to a keen interest on the inflammatory
markers that predict the risk of coronary artery disease. Inflammatory markers
of atherosclerosis include hs- CRP, lipoprotein (a), homocysteine,
myeloperoxidase, soluble CD-40 ligand, IL-6,IL-18 and s ICAM-1 . As already
mentioned, atherosclerosis and plaque rupture results in increase in the levels of
these inflammatory markers which further create a pro oxidative milieu and
makes the plaque unstable50. Among the inflammatory markers, CRP is the only
proved prognostic marker till now. Myeloperoxidase has shown promising
results in various studies and has been tried both as a diagnostic and prognostic
marker. According to recent studies, elevated levels of MPO are associated with
increased cardiovascular risk even in the presence of normal troponin and CRP
levels5. Thus MPO may be a more definite marker of future cardiovascular
events when compared to Troponin and CRP.
Uric acid is a marker of oxidative stress and inflammation17. It has been
studied in various populations and many studies have established a strong
association of uric acid levels with cardiovascular mortality. A few studies have
directly compared uric acid with hs-CRP26 and have proved a positive
correlation between the two markers. Uric acid is basically an antioxidant which
24
BIOCHEMISTRY OF URIC ACID
Uric Acid (2,6,8- trioxypurine- C5H4N4O3) is a weak organic acid that is
endogenously produced by purine metabolism6. It is formed by the liver and
mainly excreted by the kidneys and intestines. RNA and DNA are degraded
into purine nucleotides and bases, which are metabolized by the enzyme
Xanthine Oxidoreductase into xanthine and uric acid. These steps are
irreversible and produce superoxide anions. In lower animals, uric acid is
converted to a water soluble product, allantoin by the enzyme uricase and
excreted in urine. Man is the only mammal lacking the enzyme uricase6 (with
the exception of the Dalmatian dog), thus having higher levels of uric acid in
blood. Nearly two thirds of serum uric acid is produced endogenously while one
third is produced from break down of purines. Approximately 70% of urate
produced daily is excreted by the kidneys. In the kidney, uric acid is filtered,
reabsorbed or excreted by the proximal tubules by the urate/anion exchanger6,
URAT 1. URAT 1 has been identified over brush border membranes of
proximal tubular cells and is inhibited by the angiotensin II receptor blocker,
Losartan6.
Normally men have higher uric acid levels when compared to females.
Upper limit of normal uric acid levels in men is 5.5 mg/dl17 while in women, it
is 4.5 mg/dl17. Uric acid levels increase with age. Pre menopausal women have
25
effect. Post menopausal females have similar urate levels as that of men.
Alcohol causes hyperuricemia through increased lactate production, that
competes with uric acid for the URAT transporter52. Diuretics lead to volume
depletion and decreased absorption of uric acid7.
OXIDATIVE STRESS & XOR
Reactive oxygen species(ROS) are normal byproducts of aerobic
metabolism. In the heart, the potential sources of ROS include xanthine oxidase
and NADPH oxidase. According to recent studies, Xanthine oxidase plays a
more significant role in the production of ROS when compared to NADPH
oxidase. ROS produced by XOR can modulate the activity of various
intracellular proteins and signalling pathways including proteins involved in
excitation-contraction coupling, such as sarcoplasmic reticulum calcium release
channels, ion channels, myofilament proteins and signalling pathways which are
coupled to myocyte growth. The modulation of activity of ryanodine receptors
and Ca-ATPase result in decreased cardiac contractility. Oxidative stress occurs
when production of ROS exceeds the buffering activity of anti-oxidant defence
systems, leading to excess of ROS within the cell. ROS may arise secondary to
mechanical strain of the myocardium, neurohormonal stimulation or due to
26
INJURIOUS STIMULI RESPONSIBLE FOR XANTHINE OXIDASE ACTIVATION AND OXIDATIVE STRESS7(TABLE 4)
• Angiotensin II
• Amylin
• Advanced glycosylation
/fructosylation end products
• Apolipoprotein B
• Anti oxidant reserve
compromised
• Aging
• Asymmetrical dimethyl arginine
• Free fatty acid toxicity
• Lipotoxicity- Hyperlipidemia
• Insulin toxicity
• Inflammation
• Glucotoxicity
• Sorbitol/ Poliyol pathway
• Pseudohypoxia( increased
NADH/NAD ratio)
• Hypertension
• Homocysteine
• Hs-CRP
• Triglyceride toxicity
• Uric Acid toxicity – conditional
pro oxidant
XANTHINE OXIDOREDUCTASE
Xanthine oxidoreductase (XOR) belongs to the group of molybdenum
iron-sulfur-flavin hydroxylase group of enzymes. It is predominantly found in
liver, GIT, kidneys, brain and mammary gland16. It is also found throughout the
27
these are 10 to 1000 times lower than the levels found in liver and mammary
gland. Expression of these forms are increased in the presence of ischaemia16
and when there is an increase in pro inflammatory cytokines.
The subcellular location XOR remains controversial till now. In the past,
XOR was thought to be entirely cytosolic but researches have shown XOR
expression in the rough endoplasmic reticulum, lysosomes and peroxisomes of
hepatocytes and in Kupffer and sinusoidal cells
There is about three fold difference in the expression of Xanthine
Oxidase activity among individuals. This is due to the presence of various
inactive forms like desulfo-XOR. XOR has two interconvertible forms,
xanthine oxidase and xanthine dehydrogenase. The major role of xanthine
oxidase is conversion of xanthine and hypoxanthine to uric acid. Xanthine
dehydrogenase converts NAD+ to NADH. These actions yield hydroxyl free
radicals and hydrogen peroxide.
XANTHINE OXIDASE
Hypoxanthine+ H2O+ 2O2 Xanthine+ O2- +H2O2
Xanthine+ H2O2+ 2O2 Uric acid+ O2-+ H2O2
XANTHINE DEHYDROGENASE
Hypoxanthine+ NAD+ +H2O Xanthine+ NADH+ H+
Xanthine+ NAD+ +H2O Uric acid+ NADH+ H+
28
XDH prefers NAD+ as oxidising substrate but is able to react with O2 ,while
XO uses only O2( Daria Pasalik et al)52
FACTORS THAT REGULATE XOR GENE EXPRESSION(TABLE 6)
POSITIVE REGULATION NEGATIVE REGULATION
Hypoxia
Interferon gamma
Lipopolysaccharide
Interleukin-1
Interleukin-6
Dexamethasone
Tumor necrosis factor alfa
Prolactin
Cortisol
Hyperoxia
Oxygen tension regulates XOR gene expression and also affects the post
translational modification of proteins. Studies have shown that xanthine oxidase
expression in bovine endothelial cells doubles after exposure to prolonged
hypoxia16. It has been proposed that hypoxia causes phosphorylation of the
enzyme, which increases the enzymatic activity if xanthine oxidase.
The other prime factor that influences XOR expression is nitric oxide
29
directly16. Xanthine Oxidoreductase levels are brought down by the reduction of
nitrates into nitrites.
Studies show that xanthine oxidase levels are higher in heart failure and
in the recent days has been gaining importance over NADPH oxidase as a
source of oxidative stress in these conditions35. Xanthine oxidase has also been
implicated in intermittent hypoxia induced vascular dysfunction. It has also
become an area of therapeutic target.
CAUSES OF HYPERURICEMIA
Under steady state conditions, uric acid production is in balance to its
disposal. High levels of uric acid are seen in conditions associated with high cell
turn over, enzymatic defects or impaired excretion. Hyperuricemia is a state in
which uric acid levels exceed the urate solubility. Uric acid in the blood is
saturated at 6.4-6.8 mg/dl at ambient conditions, with the upper limit of
solubility placed at 7 mg/dl17. In men, hyperuricemia is defined as uric acid
level >7 mg% in males, while in females it is > 6 mg%6. In children,
30
CAUSES OF HYPERURICEMIA(TABLE 7)
Genetic Causes
Familial Hyperuricemic Nephropathy
Lesch-Nehan Syndrome (HGPRT mutation)
Phospho ribosyl pyrophosphate synthase (PRPPS)mutation
Drugs
Thiazides
Loop diuretics
Calcineurin Inhibitors(Cyclosporine>Tacrolimus)
Pyrazinamide
Low dose Aspirin
Dietary Causes
Diet high in purines(shell fish,organ meats,fatty meats)
Diet high in fructose(high fructose corn sugar, table sugar,honey)
Ethanol
Volume depletion
Hypoxia(tissue or systemic) Increased cell turn over
myeloproliferative disorders, polycythemia vera
Conditions associated with higher uric acid levels
31
Metabolic syndrome/Obesity
Untreated hypertension
African American race
Pre eclampsia
Vigorous exercise
Reference:Becker et al. 2005
Long standing hyperuricemia leads to pathological damage to kidney,
joints and connective tissue. Hyperuricemia without associated complications is
called asymptomatic hyperuricemia. Recent studies have revealed that
asymptomatic hyperuricemia is associated with hypertension, metabolic
syndrome, dyslipidemia and cardiovascular disease.
BIOLOGICAL ROLES OF URIC ACID
As said earlier, uric acid levels are higher in humans when compared to
other mammals. It has been proposed that this confers a survival advantage to
humans as increased uric acid levels maintain normal blood pressure in the
presence of low salt intake (Watanabe et al). Due to its double bond, uric acid
has great anti-oxidant activity and is responsible for more than 2/3 of plasma
anti-oxidant activity18. This survival advantage has also been linked to the
32
acid and xanthine oxidoreductase may have vast biological roles apart from
purine metabolism. Hancock et al has proposed that XOR has anti microbial
properties through Nitric oxide dependent mechanism. Breast milk has a high
XOR activity which prevents the occurrence of gastroenteritis.
The well established correlation between uric acid levels and
atherosclerosis could be a protective reaction (anti-oxidant) or a primary cause
(pro-oxidant). This might be due to uric acid being activated against oxidative
stress but behaving as a pro oxidant when produced in excess well above
normal limits.
Conversely, uric acid may be an indirect evidence of high levels of
xanthine oxidase which produces reactive oxygen species. Many hold to the
simple concept that serum uric acid in patients with metabolic syndrome,
hypertension, type 2 DM, renal failure may reflect a compensatory mechanism
to the oxidative stress. However, this does not explain why hyperuricemia is
associated with worse outcomes. Some authors have proposed the concept of an
anti-oxidant prooxidant switch or urate redox shuttle depending upon the local
33
THE ANTI OXIDANT PROOXIDANT URATE REDOX SHUTTLE7 Serum uric acid is an important anti oxidant during the early stages of
atherosclerosis and is a major determinant of plasma anti oxidative capacity.
However, when the levels reach the upper one-third of the normal limits, it
becomes pro oxidant. This is known as the anti oxidant prooxidant urate redox
shuttle. This anti-oxidant pro oxidant shuttle seems to depend on its surrounding
environment such as timing (early or late in disease process), the surrounding
oxidant milieu , location of substrate, acidity, the duration of supply of oxidant
substrates and the depletion of anti oxidants. In the atherosclerotic vulnerable
plaque, the intima of the vessel has an acidic medium, is depleted of local anti
oxidants, and associated with decrease in e NOS production. e NO is a naturally
occurring anti –oxidant in the blood vessel. In atherosclerosis, there is decrease
in the production of e NO and there is uncoupling of eNOS7. This leads to
vascular dysfunction. This is also one of the proposed mechanisms for diabetic
microvascular complications.
All these processes lead to increased production of purines due to
apoptosis and necrosis of the vascular endothelial and smooth muscle cells,
thereby increasing uric acid synthesis , allowing it to undergo a prooxidant anti
34
PROOXIDANT ANTI OXIDANT URATE REDOX SHUTTLE IN AN ATHEROSCLEROTIC PLAQUE(FIGURE 1)
NECROSIS OF VASCULAR ENDOTHELIUM
PRESENCE OF ANTI INFLAMMATORY CELLS IN ATHEROSCLEROTIC
PLAQUE
DNA RNA DEGRADATION
ENDOTHELIAL DYSFUNCTION
ADENINE, GUANINE
ENOS UNCOUPLING INCREASEDLDLc
XANTHINE
REDUCED ANTIOXIDANTS
XOR
ANTI OXIDANT URIC ACID PROOXIDANT URICACID
O 2 H2O2
35
OXIDATIVE STRESS AND ENDOTHELIAL DYSFUNCTION
Oxidative stress contributes significantly to endothelial dysfunction in
cardiovascular disease as superoxide radicals readily inactivate nitric oxide
which is a potent vasodilator. Nitric oxide and superoxide radicals react at a rate
three fold greater rate than the rate at which superoxide dismutase clears
O2-(Cai &Harrison)
Endothelium bound XOR inhibits nitric oxide dependent cyclic GMP
production in smooth muscle cells thereby impairing vasodilatation(Houston et
al.) The role of XOR in oxidative stress and endothelial dysfunction has been
confirmed by the isolation of XOR from diseased coronary arteries . It exhibits
a negative correlation with endothelium mediated vasodilatation(Landmesser et
al. 2002). Local uric acid concentrations are elevated to five to six fold higher in
atherosclerotic plaques indicating upregulation of XOR activity16(Patetsios et al.
2001)
URIC ACID IN METABOLIC SYNDROME
Higher uric acid levels are seen in people with metabolic syndrome. This
is thought to be due to the increased production of fatty acyl co A in tissues23.
This results in the formation of AMP, which breaks down into adenine and then
36
pathogenesis of metabolic syndrome. This is because fructose enters the cells,
especially hepatocytes and triggers the uninhibited use of ATP for its
metabolism by fructokinase. ATP depletion results in lactic acidosis and
resultant hyperuricemia52. Due to the excessive use of ATP, synthetic processes
are triggered, especially triglyceride levels are raised23. Studies have shown that
measures that decrease triglyceride levels are associated with decrease in uric
acid levels. Hyperinsulinemia reduces the excretion of uric acid and thereby
induces hyperuricemia in metabolic syndrome52.
SERUM URIC ACID LEVELS IN HYPERTENSION
Disturbances in renal function is one of the major mechanisms involved
in the pathogenesis of systemic hypertension. Any disturbance in the function of
URAT transporters, polymorphisms of genes associated with these transporters
and reduced glomerular filtration rate are the main causes of hyperuricemia in
hypertension23. It has also been postulated that uric acid causes tubulointerstitial
disease of the kidneys in hypertensive patients leading to salt dependent
hypertension23. Hypertension also induces microvascular renal injury and causes
an increase in lactate levels, which in turn leads to hyperuricemia52. In essential
hypertension, there is alteration of renal handling of sodium, leading to increase
in mean arterial pressure and decrease in renal blood flow, thus leading to
37
URIC ACID AND DYSLIPIDEMIA
Higher uric acid levels have been observed in persons with high waist hip
ratio. In these subjects uric acid levels show a linear correlation with the plasma
levels of leptin produced by the adipose tissue. Triglyceride levels have a
significant association with hyperuricemia. This is because Triglyceride
synthesis in the liver is associated with increased requirement of NADPH and it
also accelerates purine formation, leading to hyperuricemia23. Some studies
show a negative correlation of uric acid with HDL.
URIC ACID AND CARDIAC DISEASE
Uric acid first gained medical importance when it was discovered by
Garrod as the cause of gout. About 50% of patients with gout had hypertension,
one quarter suffered from renal disease, and majority developed cardiovascular
disease. Subsequent researches proved its association with hypertension,
atherosclerosis, renal disease and stroke.
In 1951, Gertler et al proved that uric acid levels are much higher in
hospitalised CAD patients when compared to patients hospitalised due to other
diseases17. Uric acid has also been identified as a risk factor in the recent past. It
has been found that uric acid increases platelet aggregation, reduces nitric oxide
production and causes endothelial dysfunction, raises the levels of oxidised
LDL and promotes atherosclerosis37. But the fact whether uric acid is a
38
One particular study has proved that uric acid levels along with left
ventricular mass estimation is a strong predictor of future cardiovascular events
like angina, myocardial infarction, congestive cardiac failure and even
cerebrovascular event. In a study conducted in China, Chang-Fu Kuo et al have
brought out association of hyperuricemia with increase in arterial stiffness and
the development of cardiac hypertrophy14.
Uric acid levels show a linear correlation with cardiovascular mortality in
patients with heart failure. This has been linked to endothelial dysfunction and
mechanoenergetic uncoupling ( increase in energy consumption while cardiac
work decreases), which lead to increased formation of lactate. Lactate competes
with uric acid for the URAT transporter and hence leads to hyperuricemia.
Patients with heart failure have very low levels of Superoxide dismutase ,while
the XOR acttivity is enhanced to >200% in the endothelium. Allopurinol has
been proved to increase myocardial contractility and decrease the demand of the
stunned myocardium in animal studies.
Hyperuricemia has also been linked to ischaemia-reperfusion injury that
occurs in myocardial infarction16. Though the precise mechanisms have not
been determined yet, the increase in substrates for the enzyme XOR during
ischaemia appears to positively regulate XOR expression. XOR levels are found
to be eight times elevated in aortic endothelium after reperfusion following
39
MAJOR STUDIES THAT STUDIED ASSOCIATION OF URIC ACID WITH CARDIOVASCULAR OUTCOMES (TABLE 8)
SLNO STUDY RESULTS
1
THE NHANES I EPIDEMIOLOGIC FOLLOW UP STUDY
Serum uric acid levels predicted cardiovascular mortality in both males and females even after adjustment for age and race and this association was well pronounced in post menopausal females
2 THE FRAMINGHAM STUDY
A prospective study conducted on whites which proved no significant association between uric acid levels and cardiovascular mortality when adjustments were made for age, race and other covariates
3 THE LIFE STUDY
Serum uric acid levels had significant association with incidence of cardiovascular events in high risk hypertensive subjects
4 THE PIUMA STUDY
Serum uric acid levels in highest quartiles were associated with higher incidence of fatal cardiovascular events and all cause mortality
5 KOJIMA ET AL
40
STUDIES OF URIC ACID IN CARDIOVASCULAR DISEASE AND OUTCOMES
There are two large studies regarding the role of uric acid in
cardiovascular disease and outcomes.
THE NHANES 1 EPIDEMIOLOGIC FOLLOW UP STUDY44
The NHANES 1 Epidemiologic Follow up Study( 1971-1987) indicated
that baseline serum uric acid was an independent predictor of mortality,
particularly of cardiovascular death, but only in women. But another large cross
sectional study, the Framingham’s Study reported that the apparent relationship
of uric acid to cardiovascular mortality was not sustained. The authors
concluded that the use of diuretics reduced the statistical significance of serum
uric acid to cardiovascular outcome. So in order to prove the unresolved
correlation between uric acid levels and cardiovascular mortality, the NHANES
I epidemiologic follow up study was extended to a period of five years from
1987 to 1992. This nearly doubled the deaths available for study in the sampled
population.
The total NHANES 1 sample included 20729 persons, aged 25 to 74
years. Low income persons, women of child bearing age, the elderly were
oversampled. Subjects were excluded if they had myocardial infarction , gout,
stroke, or were pregnant at the baseline. Of the total sample, a subsample of
41
up data was collected in four series of follow up. Death was analysed for all
causes and ischaemic heart disease.
Of the total deaths, 45.9% were due to cardiovascular disease. It was
observed that uric acid levels predicted the cardiovascular mortality of both men
and women older than 45 years of age whereas it did not predict the outcome in
younger individuals. In menopausal women, the predictive value of uric acid
remained significant even when it was adjusted for post menopausal status.
Subjects who were on diuretics and alcoholics( consuming alcohol more than
twice per week) had higher uric acid levels when compared to others. In
women using diuretics, the risk of cardiovascular mortality for a similar
increase in uric acid level was higher when compared to those not on diuretics.
In men with cardiovascular risk factors and those on diuretics, no significant
association was obtained between uric acid levels and cardiovascular mortality.
Even in persons with no traditional risk factors, high uric acid levels predicted
mortality. These results were similar to that obtained in a previous NHANES
study that was extended into this study.
THE FRAMINGHAM’S STUDY39
The total population included in the study was 6763 . Similar to the
previous study, risk factors were noted and the subjects were followed up for 23
years. The total deaths were 1560 and cardiovascular deaths were 617. The uric
42
Among men, high serum uric acid was associated with decreased mortality.
This study found no significant correlation between serum uric acid levels and
cardiovascular mortality or incidence of cardiovascular events after adjusting
for age, diuretic use , diabetes and other factors. Higher uric acid levels were
significantly associated with diuretic use. But the limitation of this study was
that it studied majority of white people. This result cannot be extrapolated to
other population. The socioeconomic groups were not taken into consideration.
NHANES vs FRAMINGHAM’S STUDY
As mentioned previously, the study population was heterogenous in
NHANES study, while it contained predominantly whites in the Framingham’s
study. The mean age group was higher in the NHANES study and increasing
age was one of the determining factors of cardiovascular mortality. NHANES
showed a significant correlation of uric acid with cardiovascular mortality even
43
STUDIES THAT ASSESSED URIC ACID LEVELS IN ACUTE CORONARY SYNDROMES
Vladimir Trkulja8 et al has performed a meta analysis of nine studies
conducted in patients with acute myocardial infarction and has proved the
association of uric acid levels with cardiovascular mortality. Out of the nine
studies, six were conducted in patients with STEMI who underwent PCI and
three in mixed population of acute myocardial infarction. The outcomes studied
were mortality and occurrence of major adverse cardiac events. Short term (upto
30 days) and medium /long term outcomes were studied. There was a
significant association between higher uric acid levels and major adverse
cardiac events and short and medium/long term mortality.
The limitation of this study was that some studies were retrospective. No
study matched the normouricemic and hyperuricemic subjects with respect to
age, Killip class, or renal function. Age > 65 years, Killip class>II/III and renal
insufficiency were the most important predictors of mortality in acute
myocardial infarction. Uric acid levels significantly correlated with these
factors.
44
MATERIALS AND METHODS
STUDY DESIGNThis is a prospective study conducted on a sample South Indian
population admitted in the department of Cardiology during the period of 2011
to 2012. The study included a standardized questionnaire and examination,
based on which patients were included in the study. A total of 152 subjects
admitted with ST elevation Myocardial Infarction were analysed and among
them, patients with evolved MI, prior history of myocardial infarction, renal
disease, and those on diuretics and aspirin, were excluded. The total sample
population included in the study was 75 patients, aged 24 to 75 years. The
study population included 65 males and 10 females.
INCLUSION CRITERIA
1. Acute ST elevation MI, defined as
Classical anginal pain within the prior 12 hours associated with either
A) STsegment elevation in atleast two contiguous leads, greater than 0.1 mV in
limb leads or greater than 0.2 mV in precordial leads
45
EXCLUSION CRITERIA
1. Patients with chronic kidney disease
2. Evolved MI
3. Patients with contraindications to thrombolysis
4. Prior history of coronary artery disease
5. Chronic alcohol intake/ Binge drinking in the past one week.
6. History of aspirin/ diuretic intake
7. Patients on Anti Tuberculosis Treatment
8. Gout
9. Presence of myeloproliferative diseases
10. Pregnancy
11. Hypothyroidism
12. Patients on calcineurin inhibitors.
METHODS
A detailed history was elicited regarding duration of chest pain, nature of
chest pain, associated symptoms, previous illness and medications, presence of
risk factors like diabetes, hypertension, smoking, alcoholism, family history of
MI , and a detailed clinical examination was done and patients were categorised
into Killip class I to IV. The window period was noted and patients with acute
46
streptokinase 1.5 million units. Any complication occurring during thrombolysis
was made note of. Continuous cardiac monitoring was done for all patients
atleast during the initial three days and prolonged if complications occurred.
On admission, routine investigations like blood sugar , urea, creatinine,
complete blood count were done and serum uric acid level was estimated. Total
cholesterol and triglyceride level was also estimated on the day of admission.
Fasting and post prandial blood sugar was estimated in all patients. Diabetes
was defined as fasting blood sugar >126 mg% or post prandial blood sugar>200
mg% or euglycemia with the use of insulin or oral hypoglycemic agents. Body
mass index was calculated as weight in kg/ height in m2 and TIMI risk score for
STEMI was calculated for all patients on admission (table 4).
Serum uric acid level was reestimated on day three. Echocardiography
was done on the fifth day and ejection fraction was assessed. Patients were
followed up till their discharge or till one week whichever was longer. Any
complications or mortality occurring during this period were also noted.
Adverse cardiac events included arrhythmias (excluding benign premature beats
and Idioventricular rhythm occuring during thrombolysis), sudden cardiac
arrest, shock, cardiac failure, ventricular septal rupture, papillary muscle
dysfunction, free wall rupture, reinfarction and pericarditis. Other complications
like bleeding episodes, cerebrovascular accident and acute kidney injury were
47
STATISTICAL ANALYSIS
Data analysis was done and subjects were divided into two groups: one
group had patients with normal uric acid levels and the other had patients with
hyperuricemia. Serum uric acid levels between the two groups on day one was
compared by Students unpaired ‘t’ test and within the groups on days one and
three was compared by paired ‘t’ test. The continous variables like age,
window period, lipid profile, BMI, TIMI score were compared by unpaired ‘t’
test. The categorical variables like sex, Killip class, diabetes, hypertension,
smoking , lipid profile, complications and mortality were compared between the
two groups by χ2 (Chi-square) test, Odd’s ratio and Z test of proportions
wherever applicable. The statistical package IBM SPSS statistics -20 was
utilized for analysis and interpretations. The P- values less than 0.05 (P<0.05)
48
RESULTS AND OBSERVATIONS
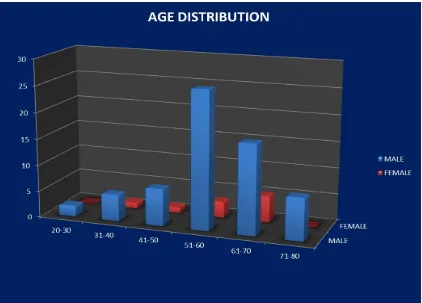
The study population had 75 subjects in the age group of 21 to 80
years. The mean age of the total population was 56.80 years.
AGE DISTRIBUTION IN STUDY POPULATION
TABLE 9
AGE 21-30 31-40 41-50 51-60 61-70 71-80
MALE 2 5 7 26 17 5
FEMALE 0 1 1 3 8 0
SUA IN mg/dL
AGE IN YEARS
21-30 31-40 41-50 51-60 61-70 71-80
3.1-5.0 0 5 2 6 0 0
5.1-7.0 2 1 5 12 10 1
7.1-9.0 0 0 1 11 10 4
>9.0 0 0 0 0 2 3
49
FIGURE 2:The mean age of the total population was 56.80 years. Men had a mean age of 57.55 years and the mean age in women was 66.04 years.
MEAN URIC ACID LEVEL IN DIFFERENT AGE GROUPS (TABLE 10)
AGE 21-30 31-40 41-50 51-60 61-70 71-80 MALE 5.9 4.58 5.8 6.28 7.86 8.24
50
FIGURE 3
[image:57.595.82.516.379.662.2]51
Comparison of Hyperuricemia and Non-Hyperuricemia cases according to age (Table 11)
Variables Hyperuricemia
Non-
Hyperuricemia DifferenceB/W H & NH
‘t’ df Sig. Mean SD Mean SD
Age
(years) 64.2 7.2 50.8 10.9 13.4 6.297 73 P<0.001
Age differed significantly between the two groups(p<0.05). Uric acid levels
were higher in older individuals.
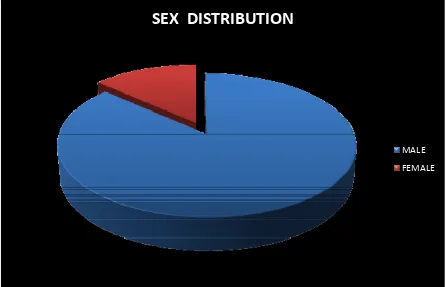
SEX DISTRIBUTION
SEX
DISTRIBUTION
MALE FEMALE
[image:58.595.75.522.424.711.2]52
PREVALENCE OF HYPERURICEMIA IN THE STUDY POPULATION (TABLE 12)
SEX NORMAL URIC ACID HYPERURICEMIA
MALE 32 33
FEMALE 4 6
0% 10% 20% 30% 40% 50% 60% 70% 80% 90% 100%
MALE FEMALE
PREVALENCE
OF
HYPERURICEMIA
IN
STUDY
POPULATION
HYPERURICEMIA NORMAL URIC ACID
FIGURE 6: The prevalence of hyperuricemia was 50.77% in men and 60% in
[image:59.595.81.474.282.552.2]53
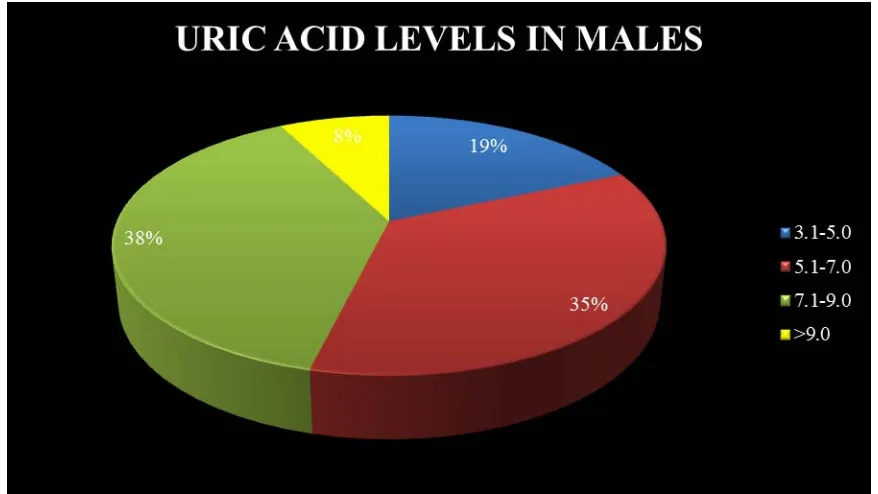
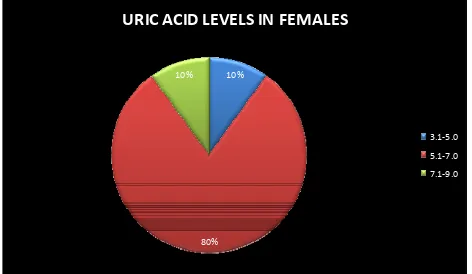
DISTRIBUTION OF URIC ACID LEVELS IN MALES AND FEMALES ( TABLE 13)
SEX
SERUM URIC ACID IN mg/dl
3.1-5.0 5.1-7.0 7.1-9.0 >9.1
MALE 12 23 25 5
[image:60.595.78.517.339.586.2]FEMALE 1 8 1 -
FIGURE 7: Mean uric acid level in the studied population was 6.31mg%.
Men had relatively higher uric acid levels when compared to females.(mean –
54
10%
80% 10%
URIC
ACID
LEVELS
IN
FEMALES
3.1‐5.0 5.1‐7.0 7.1‐9.0
[image:61.595.73.545.76.350.2]FIGURE 8: The mean uric acid level in females was 5.49 mg%
Table-14. Association between serum uric acid and gender
Genders Acute STEMI Sr uric acid χ2 df Sig.
Hyper Non Hyper Total
Male 33 32 65
0.296 1 P>0.05
Female 6 4 10
Total 39 36 75
The Table 14 shows the association between serum uric acid with genders
of STEMI. The gender did not have any significant association with Sr. Uric
55
[image:62.595.75.573.327.678.2]TYPE OF MI DISTRIBUTION IN STUDY POPULATION
TABLE 15
SEX
TYPE OF MYOCARDIAL INFARCTION
AWMI ASMI IWMI LBBB
MALE 29 14 19 3
FEMALE 1 3 6 0
0 5 10 15 20 25 30
AWMI ASMI IWMI LBBB
NO OF SUBJECTS
TY
P
E
O
F
M
I
DISTRIBUTION OF TYPE OF MI
FEMALE MALE
FIGURE 9: Anterior wall MI was the commonest encountered type in the
56
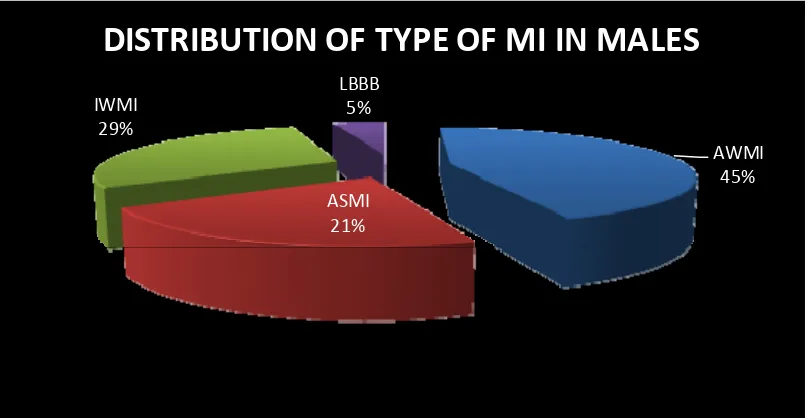
AWMI 45% ASMI
21% IWMI
29%
LBBB 5%
[image:63.595.97.502.75.284.2]DISTRIBUTION
OF
TYPE
OF
MI
IN
MALES
FIGURE 10: Majority of the males suffered anterior wall infarction.
AWMI 10%
ASMI 30% IWMI
60%
LBBB 0%
DISTRIBUTION OF TYPE OF MI IN
FEMALES
FIGURE 11: Inferior wall MI was the commonest presentation among females.
[image:63.595.96.500.383.624.2]57
DISTRIBUTION OF TYPES OF MYOCARDIAL INFARCTION IN DIFFERENT URIC ACID QUARTILES(TABLE 16)
TYPE OF MI
SERUM URIC ACID IN mg/dl
3.1- 5.0 5.1 – 7.0 7.1 – 9.0 >9.0
AWMI 0 10 17 3
ASMI 3 12 2 1
IWMI 11 10 5 0
LBBB 0 0 2 1
58
FIGURE 13: Anterior wall MI and LBBB pattern were associated with higher
uric acid quartiles while inferior wall MI was associated with lower uric acid
[image:65.595.88.510.72.370.2]quartiles.
Table-17. Association between Serum uric acid and Type of STEMI.
Type
Acute STEMI Sr uric acid
χ2 df Sig. Hyper Hyper Non Total
AS 7 10 17
23.247 1 P<0.01
AW 22 8 30
IW 2 13 15
IWPW 2 3 5
IWRVPW 3 0 3
IWRV 0 1 1
LBBB 3 0 3
LWRW 0 1 1
59
Table 17 shows the relation between type of STEMI with Uric acid.
Anterior wall MI was associated with Hyperuricemia and Inferior wall MI was
associated with Non Hyperuricemia (P<0.01).
DISTRIBUTION OF KILLIP CLASS AMONG STUDY POPULATION
(TABLE 18)
KILLIP I II III IV
MALE 35 17 7 6
FEMALE 8 1 1 0
TOTAL 43 16 8 6
KILLIP I 59% KILLIP II
22% KILLIP III
11%
KILLIP IV 8%
[image:66.595.87.511.426.672.2]KILLIP
CLASS
60 0% 10% 20% 30% 40% 50% 60% 70% 80% 90% 100% MALE FEMALE
KILLIP
CLASS
DISTRIBUTION
IN
MALES
AND
FEMALES
[image:67.595.82.515.79.343.2]KILLIP 4 KILLIP 3 KILLIP 2 KILLIP 1
FIGURE 15: 80% of females presented with Killip class 1. Higher Killip classes
occurred commonly in men.
COMPARISON OF URIC ACID LEVELS WITH KILLIP CLASS
(TABLE 19)
KILLIP CLASS
SERUM URIC ACID IN mg/dl
3.1-5.0 5.1-7.0 7.1-9.0 >9.0
KILLIP I 13 25 4 1
KILLIP II 0 5 12 1
KILLIP III 0 0 5 2
61 0% 10% 20% 30% 40% 50% 60% 70% 80% 90% 100% I II III IV KILLIP CLASS
COMPARISON
OF
URIC
ACID
LEVELS
IN
KILLIP
CLASS
I
‐
IV
[image:68.595.92.466.71.364.2]QUARTILE4 QUARTILE3 QUARTIL2 QUARTILE 1
FIGURE:16 : Higher Killip Classes were associated with higher uric acid levels
5.75 7.45 8.2 8.27 0 1 2 3 4 5 6 7 8 9
KILLIP I KILLIP II KILLIP III KILLIP IV
KILLIP CLASS AND MEAN URIC ACID
MEAN URIC ACID
[image:68.595.85.510.454.711.2]62
Table-20. Association between Sr uric acid and Killip class. Killip
class
Acute STEMI Sr uric acid
χ2 Df Sig.
Hyper Non Hyper Total
I 10 33 43
33.625 3 P<0.001
II 16 2 18
III 7 1 8
IV 6 0 6
Total 39 36 75
Table 20 shows the association between serum uric acid and Killip class.
Killip class III and IV were strongly associated with Hyperuricemia. (P<0.001).
CORRELATION BETWEEN TIMI SCORE AND URIC ACID LEVEL
(TABLE 21)
MEAN SUA IN
mg/dl
TIMI RISK SCORE
0 1 2 3 4 5 6 7 8 9 12
IN MEN 4.4 4.75 5.62 6.7 7.11 7.72 7.2 8 8.15 8.7 8.8
IN
63 4.47 4.75 5.62 6.7 7.11 7.72 7.2 8 8.15 8.7 8.8 0 1 2 3 4 5 6 7 8 9 10
0 1 2 3 4 5 6 7 8 9 12
UR IC AC ID IN mg/ d l TIMI SCORE
TIMI
SCORE
VS
URIC
ACID
IN
MEN
[image:70.595.87.468.76.319.2]UA
FIGURE 18: Uric acid levels increased with age in males.
4.2
4.7
5.85 6.2 6.2
6.95 0 1 2 3 4 5 6 7 8
0 1 2 3 4 7
URI C ACI D i n m g/ dl TIMI SCORE
TIMI
SCORE
VS
URIC
ACID
IN
WOMEN
FEMALE
64
Comparison of Hyperuricemia and Non-Hyperuricemia cases based on TIMI score (Table 22)
Variables Hyperuricemia
Non- Hyperuricemia
Difference B/W H
& NH ‘t’ df Sig. Mean SD Mean SD
TIMI 6.5 2.1 1.7 1.4 4.8 11.610 73 P<0.001
TIMI score differed significantly between the two groups(P<0.001).
DISTRIBUTION OF URIC ACID LEVELS IN DIABETICS AND NON-DIABETICS (TABLE 23)
GLYCEMIC STATUS
SERUM URIC ACID IN mg/dl QUARTILE1
3.1-5.0
QUARTILE2 5.1-7.0
QUARTILE3 7.1-9.0
QUARTILE4 >9.0
DIABETICS 3 10 14 2
NON