CORRELATION BETWEEN THE SEX HORMONE BINDING
GLOBULIN LEVEL AND LEVEL OF INSULIN
RESISTANCE IN OBESE PREPUBERTAL CHILDREN
Dissertation Submitted for
MD DEGREE EXAMINATION
BRANCH VII - PEDIATRIC MEDICINE
INSTITUTE OF CHILD HEALTH AND
HOSPITAL FOR CHILDREN MADRAS MEDICAL COLLEGE
THE TAMILNADU Dr.M.G.R. MEDICAL UNIVERSITY CHENNAI.
CERTIFICATE
Certified that this dissertation entitled “CORRELATION BETWEEN
THE SEX HORMONE BINDING GLOBULIN LEVEL ANDLEVEL OF
INSULIN RESISTANCE IN OBESE PREPUBERTAL CHILDREN” is a
bonafide work done by Dr.V.SEENIVASAN, M.D., Post Graduate Student of
Pediatric Medicine, Institute of Child Health and Hospital for Children,
Egmore, Chennai - 600 008 attached to Madras Medical College, during the academic year 2003 - 2006.
Prof. P.G. Sundararaman M.D., DM.,
Lecturer, Department of Endocrinology Institute of Obstetrics and Gynaecology Madras Medical College, Chennai.
Prof.K.R.Ravindran M.D.,DC.H.,
Professor of Pediatrics
Institute of Child Health and Hospital for Children Madras Medical College, Chennai.
Prof.. Mangayarkarasi Senguttuvan M.D.,DCH.,
Director and Superintendent,
Institute of Child Health and Hospital for Children Madras Medical College, Chennai.
Prof. Kalavathi Ponniraivan B.Sc., M.D.,
The Dean,
DECLARATION
I declare that this dissertation entitled "CORRELATION BETWEEN THE SEX HORMONE BINDING GLOBULIN LEVEL AND LEVEL OF
INSULIN RESISTANCE IN OBESE PREPUBERTAL CHILDREN” has
been conducted by me at the Institute of Child Health and Hospital for Children, under the guidance and supervision of my unit chief Prof.K.R.Ravindran M.D., D.C.H., and Dr. P.G. Sundararaman M.D., DM., Lecturer, Department
of Endocrinology, Institute of Obstetrics and Gynaecology, Madras Medical College, Chennai. It is submitted in part of fulfillment of the award of the degree of M.D (Pediatrics) for the September 2006 examination to be held under The Tamil Nadu Dr.M.G.R Medical University, Chennai. This has not been submitted previously by me for the award of any degree or diploma from any other university.
SPECIAL ACKNOWLEDGEMENT
My sincere thanks to Prof. Dr. Kalavathi Ponniraivan, B.Sc., M.D.,
SPECIAL ACKNOWLEDGEMENT
I would like to thank Prof.P.G.Sundararaman MD., DM Lecturer,
ACKNOWLEDGEMENTS
I would like to express my sincere gratitude to
Prof.Dr.Mangayarkarasi SenguttuvanM.D., D.C.H., Professor of Pediatrics,
Director and Superintendent of Institute of Child Health and Hospital for Children for permitting me to undertake this study.
I am extremely thankful to Prof.K.R.Ravindran M.D., D.C.H., .
Professor of Pediatrics and our unit chief for his guidance, invaluable help, encouragement and support throughout the study.
I would also like to thank our unit Assistant Professors,
Dr.C.V.Ravisekar M.D. D.C.H., D.N.B, Dr.S.Lakshmi,M.D. D.C.H., and Dr.K.Kumarasamy M.D.,D.C.H., D.N.B. for their valuable guidance and
support in doing this study.
I extend my sincere thanks to Dr. Kothainayagai, M.D., D.C.H.,
Registrar for her valuable suggestion and guidance in doing this work..
CONTENTS
Sl. No. Title Page
No.
I INTRODUCTION 1
II AIM OF THE STUDY 40
III REVIEW OF LITERATURE 41
IV STUDY JUSTIFICATION 44
V MATERIALS AND METHODS 46
VI RESULTS 49
VII DISCUSSION 55
VIII CONCLUSION 62
BIBLIOGRAPHY 63
INTRODUCTION
Insulin resistance is defined as an impaired ability of plasma
insulin at usual concentrations to adequately promote peripheral glucose
disposal, suppress hepatic glucose output and inhibit very low density
lipoprotein (VLDL) output.
Insulin resistance results in compensatory increase in insulin
secretion. The resulting hyperinsulinemia overcomes the insulin
resistance for sometime and keeps the blood sugar in normal range.
However when relative beta cell insufficiency (insulin secretion
insufficient for the level of hyperglycemia) also sets in, overt diabetes
develops.
Metabolic syndrome also known as Syndrome X is associated
with increased risk of coronary heart disease and stroke. The features of
metabolic syndrome include abdominal obesity, hyperinsulinemia,
dyslipidemia, type 2 diabetes mellitus, and hypertension1. The core
feature is elevated insulin levels which develops early in the course of
It is increasingly being recognized that Indians are an ethnic
group at high risk for insulin resistance. In a 1998 publication, WHO
has predicted that India would experience the largest increase in type 2
diabetes mellitus in the next 25 years and would have the greatest
number of diabetic individuals by the year 20253.
According to a large body of epidemiological data from many
parts of world, the seeds of insulin resistance are sown during prenatal
life itself. Low birth weight and more so intra uterine growth
retardation followed by rapid catch-up growth and relative postnatal
obesity have been shown to be associated with insulin resistance4,5.
According to Barker et al, low birth weight acts as a surrogate marker
for poor gestational environment and there is inverse relationship
between birth weight and insulin resistance later in life.
In addition to insulin resistance, tracking of other cardiovascular
risk factors such as obesity, physical inactivity, hyperlipidemia, and
hypertension is seen from childhood through adolescence to adulthood.
Therefore the steps for the prevention of insulin resistance and other
cardiovascular risk factors should ideally be initiated during childhood.
Clinical features of insulin resistance syndrome
The clinical phenotype of insulin resistance includes centrally
biased obesity; characteristic skin involvement (acanthosis nigricans,
skin tags, striae, acne, hirsutism, and frontal balding); an allergic
diathesis, especially as manifested by asthma; hypertension; an
atherogenic dyslipidemia increased VLDL with raised triglycerides and
reduced levels of the protective high density lipoprotein (HDL)
cholesterol; early atherosclerosis, tall stature and pseudoacromegaly
(with suppressed growth hormone levels); focal segmental
glomerulosclerosis; hepatic steatosis; and adrenal and ovarian
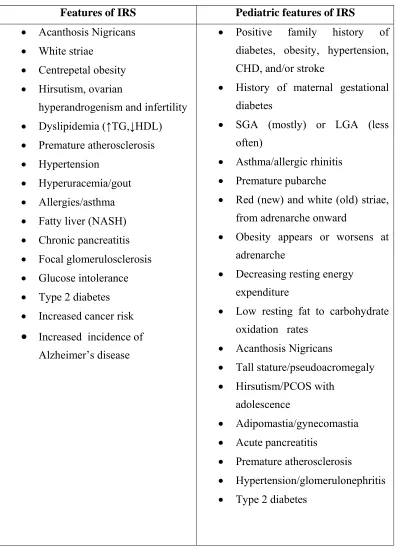
hyperandrogenism (Table-1). Importantly, insulin resistance is not
infrequent in the absence of obesity, whereas even considerably obese
personscan be insulin sensitive.
Obese patients represent heterogeneous subgroups of metabolic
and phenotypical expressions of insulin resistance, whereas individuals
with the same Body Mass Index (BMI) can have varying degrees of
insulin resistance and metabolic compensation. However, most
[image:11.612.116.518.106.652.2]
Table -1
Features of IRS Pediatric features of IRS
• Acanthosis Nigricans • White striae
• Centrepetal obesity
• Hirsutism, ovarian hyperandrogenism and infertility • Dyslipidemia (↑TG,↓HDL) • Premature atherosclerosis • Hypertension
• Hyperuracemia/gout • Allergies/asthma • Fatty liver (NASH) • Chronic pancreatitis • Focal glomerulosclerosis • Glucose intolerance • Type 2 diabetes • Increased cancer risk
• Increased incidence of Alzheimer’s disease
• Positive family history of diabetes, obesity, hypertension, CHD, and/or stroke
• History of maternal gestational diabetes
• SGA (mostly) or LGA (less often)
• Asthma/allergic rhinitis • Premature pubarche
• Red (new) and white (old) striae, from adrenarche onward
• Obesity appears or worsens at adrenarche
• Decreasing resting energy expenditure
• Low resting fat to carbohydrate oxidation rates
• Acanthosis Nigricans
• Tall stature/pseudoacromegaly • Hirsutism/PCOS with
adolescence
• Adipomastia/gynecomastia • Acute pancreatitis
Children with BMI higher than the 85th percentile for age and
gender are classified asoverweight, whereas those that are higher than
the 95th percentile are designated obese6. Adolescents and adults with
BMI of 25 kg/m2 or more are at risk for adiposity-related morbidity,
whereas those with BMI greater than 30 kg/m2 are obese according to
the WHO panel.
PATHOGENESIS
Nature vs. nurture.
The dramatic rise in obesity-associated insulin resistance
syndrome reflects environmentalincreased availability and consumption
of food with high carbohydrateand fat contents together with decreased
physical activities.Genetic predispositions to obesity favor selection of
metabolically advantageous (energy thrifty) traits resulting in an
enhanced ability to store excess calories in tissues as fat and to spare
protein breakdown for gluconeogenesis, favoring survival in times of
hunger. Genotypic factors influence the ability to use food energy
efficiently through mechanisms of intra abdominal fat distribution,
resting metabolic rate, changes in energyexpenditure, body composition
to overfeeding, feeding behavior (including food preferences), adipose
Genes involved in insulin resistance
The pathogenesis of insulin resistance is multifactorial. Thus,
several molecular pathways in energy homeostasis, lipid metabolism,
insulin receptor signaling pathway, cytokines, hormone-bindingproteins
including those that are serine protease inhibitors(SERPINS), and other
protease regulators are responsible for the development of insulin
resistance, obesity, or lipodystrophy. In the energy homeostasis
pathway, uncoupling proteins, leptin-proopiomelanocortin (POMC),
ghrelin-neuropeptide Y (NPY), and sympathetic nervous system
regulation pathways are important. In the insulin-signaling pathway,
mutations in insulin receptors, development of insulin receptor
auto-antibodies, and defects in plasma cell membrane glycoprotein-1
and glucose transporter 4 (GLUT4) moleculesare reported. In the lipid
homeostasis pathway, adipocyte-derived hormones, leptin, adiponectin,
resistin, peroxisomal proliferator-activated receptor-γ (PPAR- γ ) and
PPAR-α are variously involved, as are lipoprotein lipase and genes
responsible for adipose tissue formation. Increased availability of free
fatty acids (FFAs) to muscle provokes insulin resistance. Proteases
contributing to the development of diabetes are representedby CAPN 10
Acquired insulin resistance
Insulin receptor antibodies, Cushing’s syndrome, glucocorticoid
steroid therapy, acromegaly, hyperparathyroidism, and exogenous
obesity can all produce insulin resistance. In practice, however,
steroid-induced insulin resistance in a person who happens to be genetically
prone to insulin resistance is the most commonly encountered,
especially when the obese child also has insulin resistance-associated
asthma. GH therapy can provoke transient insulin resistance. In the
small for gestational age (SGA) disorderswithout catch-up growth, such
as the Russell-Silver syndrome, insulin resistance may develop even
before GH is given.
Birth weight and length.
An increased incidence of adulthood diseases, such as
cardiovascular diseases, type 2 diabetes, and hypertension, is noticed in
small for gestational (SGA) babies. Insulin resistance is particularly
apparent when an SGA newborn undergoes rapid postnatal weightgain.
The Early Bird Study suggested that insulin resistance at 5yrs was
related not to birth weight, but, rather, to weight after catch-up growth,
especially in girls4. Such growth patternsfollowing fetal growth restraint
smoking, restrictions in the maternal diet, maternal insulin resistance,
and gestational diabetes (Fig-1). Alternatively, if an inherited insulin
resistance state was manifested in utero, then diminished fetal growth
with SGA might be anticipated, because insulinis a powerful prenatal
growth hormone(Fig-2). Curiously, large for gestational age children are
also at risk of insulin resistance as well. A U-shaped relation between
birth weight and fasting insulin, BMI and fat mass has been
established41,42.
Gestational diabetes per se significantly increases the subsequent
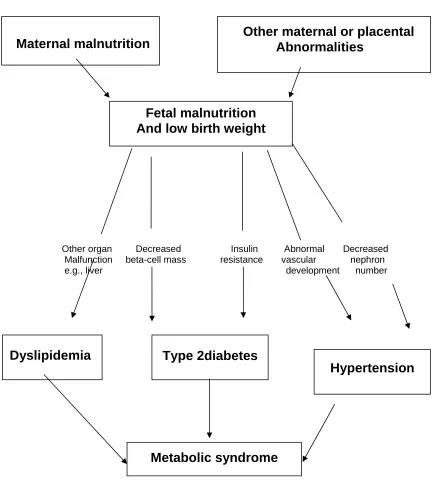
FIG-1
THRIFTY PHENOTYPE HYPOTHESIS
Other organ Decreased Insulin Abnormal Decreased Malfunction beta-cell mass resistance vascular nephron e.g., liver development number
Schematic representation of the thrifty phenotype hypothesis,
showing the vital role of fetal nutrition in the development of the
metabolic syndrome.
Hypertension Fetal malnutrition
And low birth weight
Dyslipidemia
Type 2diabetes
Maternal malnutrition Other maternal or placental Abnormalities
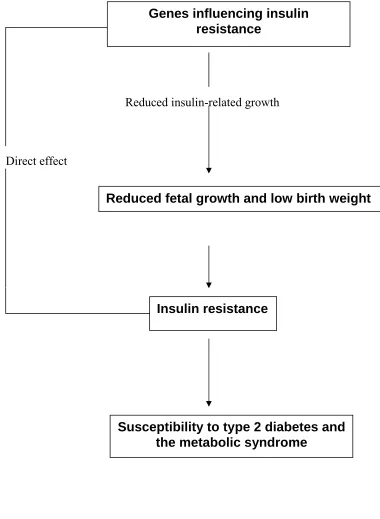
[image:16.612.106.541.129.618.2]FIG .2.
THE FETAL INSULIN HYPOTHESIS
Reduced insulin-related growth
Direct effect
Genes influencing insulin resistance
Reduced fetal growth and low birth weight
Insulin resistance
Insulin resistance, leptin resistance, ghrelin, and satiety
The insulin/leptin-arcuate nucleus of the hypothalamus axis
regulates energy homeostasis through control of appetite and energy
expenditure. Both hormones rise in direct proportion to adipose mass;
they cross the blood-brain barrier and have receptors in the arcuate
nucleus. Leptin acts on POMC (pro opio melanocortin) expression and
α-MSH (melanocyte stimulating hormone) release. α-MSH in turn,
interacts with MC3/4R (melanocortin 4 receptor) to reducefood intake
and increase energy expenditure by activating the sympathetic nervous
system. Leptin down-regulates anabolic NPY(neuro peptide Y),
agouti-related peptide (AGRP), orexins, and melanin-concentratinghormone in
the hypothalamus. The central melanocortin systemis a key mediator of
the catabolic effects of insulin in thebrain. Gastric secretion of ghrelin is
increased by fasting and increases pituitary GH release, thereby
stimulating lipolysis to provide energy substrates. Ghrelin stimulates
NPY-AGRP to antagonize α-MSH. The resultant lack of anorexic
pressure on MC4Rs results in increased feeding behavior and energy
efficiency (with reduced fat oxidation) to store energy as fat.
Conversely, in the fed state, insulin and leptin levels are increased,
whichincreases the synthesis and processing of hypothalamic POMCto
colocalized neuromodulator cocaine/amphetamine-regulated transcript,
acts at the MC4R to decrease appetite. Insulin and leptin also directly
inhibit NPY-AGRP, further limiting feeding and providing for
unantagonized MC4R occupancy. Therefore, ghrelin,insulin, and leptin
represent afferent hormonal links betweenperipheral energy metabolism
and central feeding behavior and tie together the gut, pancreas,
adipocyte, hypothalamus, andpituitary to form a coordinated growth and
energy regulatorysystem11,12.
Natural history of the clinical insulin resistance syndrome
The natural history of insulin resistance syndrome begins in
childhood, from the interplay of genetic and environmental factors.
Althoughit is generally unclear whether a primarily genetically encoded
state of insulin resistance and/or satiety disorder appears first, insulin
resistance results in hyperinsulinism and precocious development of
atherosclerosis and type 2 diabetes13. The modern day diet from early
childhood replete with large amounts of saturated fats and excess
carbohydrates is probably important to the development of
hyperinsulinemia and obesity. Dietary carbohydrates (and fats) induce
hyperinsulinism, a reduction in fatty acid (FA) oxidation, and
hypertryglyceridemia. Diets rich in saturated FAs add a strong
insulinotropic effect. In children, obesity and insulin resistance precede
seen as a compensatory mechanism for the preexisting, genetically
programmed insulin resistance which represents a mechanism for
protection against the development of impaired glucose tolerance and
diabetes.
Insulin hyper secretion (especially portal) leads to increasedfree
fatty acid synthesis, especially in the liver and adipose tissue. A
compensatory increase in glucose oxidation and increased malonyl
coenzyme A signaling in the face of abundant fatty acids directs
diversion away from ß-oxidation to compensatory increases in
long-chain fatty acids and triglycerides synthesis in the liver. Normally
appetite can be suppressed by both leptin and insulin; however, diets
high in fat stimulate appetite directly. The liver, in turn, becomes
insensitive to compensatory leptin signaling to increase ß-oxidation,
which is blocked in insulin resistance state, because of high levels of
malonyl CoA. Elevated levels of malonyl CoA block fatty acid ß-
oxidation, leading to triglyceride accumulation in muscleand liver, with
impaired serine phosphorylation of insulin receptor substrate-1,
decreased GLUT4 translocation, and thereby decreased glucose
oxidation. In the pancreatic islets, these events lead to activation of
caspases and increased ceramide levels inducing apoptosis of ß-cells.
Type 2 diabetes thus results when thereis insufficient insulin secretion
to counter preexisting insulin resistance.
FIG.3
CLINICAL FEATURES OF IRS WITH NATURAL HISTORY
Infancy
FH of obesity & type 2 diabetes
SGA & LGA Childhood
Gestational diabetes
Acanthosis nigricans Adolescence
Premature adrenarche
Obesity, Pseudo acromegaly
Striae, Skin tags,Amenorrhea Adulthood
Tall stature, Pseudo acromegaly
Fatty liver, Focal glomerulosclerosis
Hirsutism, ovarian hyperandrogenism, PCOS
Increased carotid wall thickness,Stroke, CHD
FIG. 4
LABORATORY FEATURES OF INSULIN RESISTANCE WITH
NATURAL HISTORY
Infancy
Hyperinsulinism & insulin resistance
↓ IGFBP-1, ↓ SHBG ↑Free testosterone childhood
↓CBG ↑Free cotrtisol
↑ VLDL, ↑TG, ↓HDL
↑ PAI-1 ↑CRP, ↑FIBRINOGEN Adolescence
Adhesion molecules and uric acid
Decreased first insulin response
Increased decompensated insulin resistance Adulthood
Postprandial hyperglycemia
Fasting hyperglycemia
Loss of first phase insulin response to predict development of
diabetes
Children affected by insulin resistance are usually
hyperinsulinemic individuals in whom carbohydrates can induce a
delayed, but excessive, rise in insulin secretion14. This may cause an
excessive fall in glucose levels 3–4 h later, of sufficient severity to
provoke symptoms of hypoglycemia (late reactive hypoglycemia). As
the ability to secrete insulin declines, postprandial glucose intolerance
appears, followed by fasting hyperglycemia and diabetes.
Hyperinsulinism and insulin resistance are not benign, even without
diabetes
The majority of persons with insulin resistance will not develop
type 2 diabetes. Insuin resistant individuals who can compensate by
hyperinsulinemia may escape diabetes, but are still prone to other
complications, such as early atherosclerosis, progression of obesity
(especially central type), acanthosis nigricans, increased skin tags,
hypertension, dyslipidemia, hypercoagulation, polycystic ovarian
syndrome, fatty liver infiltration, focal segmental glomerulosclerosis,
and an increased cancer rate as well15. Thus insulin resistant syndrome is
HYPERINSULINISM AND INSULIN RESISTANCE
ASSOCIATED PATHOLOGIES
Adipose Tissue
It is widely believed that obesity itself, especially increased
visceral fat accumulation, can lead to insulin resistance16. Genetically
induced insulin resistance can be the primary mechanism underling and
evoking the progression of obesity. In contrast, non-obese lean
individuals can develop insulin resistance also. It has been shown that
lean sisters andbrothers of patients with obesity complicated by insulin
resistance and polycystic ovarian syndromecan have insulin resistance,
confirming that insulin resistance can be a primary mechanism.
Visceral fat
Visceral fat is a potent modulator of insulin action on hepatic
glucose production17.Central distribution of body fat (waist/hip ratio,
>0.90 in females and >1.0 in males) is associatedwith an increased risk
of stroke, CHD, diabetes, and early mortality and is a more sensitive
indicator of impending morbidity than absolute fat mass. Waist
circumference correlates with cardiovascularmorbidity as well as BMI.
Leptin levels are higher in subcutaneous fat and show greater
Visceral fat tissue, throughits portal drainage, is an important source of
free fatty acids that increase hepatic lipogenesis and decrease glucose
oxidation.In comparison with subcutaneous fat,visceral fat has more
glucocorticoid receptors and higher local concentrations of
glucocorticoids.Omental adipose tissue contains significantly more
11ß-hydroxysteroid dehydrogenase type 1 (11ßHSD1) activity than
subcutaneous adipose tissue19, promoting increased cortisol production
from conversionof inactive cortisone. Growth Hormone (and/or IGF-I)
was suggested recently to inhibit 11ßHSD1, whereas in obesity, GH
levels are decreased, leading to higher 11ßHSD1 activity20. 11ßHSD1
activity correlates with insulin resistance21. A local increase in
glucocorticoid hormone action in visceral fat may contribute to the
pathogenesis of key features of the metabolic syndrome. Increased
abdominal striae and biochemically increased urinaryfree cortisol levels
in obesity are observed.
Patients with Cushing’s syndrome have high levels of serum
cortisol, and the patient with insulin resistance syndrome has low to
normal levels,though both have increased levels of urinary free cortisol.
The explanation lies in the decreased levels of corticosteroid-binding
globulin (CBG) found in insulin resistance syndrome, where circulating
conversion of cortisone tothe metabolically active cortisol. The clinical
distinctionbetween patients with Cushing’s and IRS is that the formeris
invariably growth retarded, in contrast to the child with insulin
resistance syndrome in whom linear growth is excessive.
Fatty liver or hepatic steatosis.
Hepatic steatosis is another complication of insulin resistance
that may progress over years with inflammation and fibrosis
(nonalcoholic steatohepatitis). In adult patients with diabetes and
obesity, 100% have mild steatosis, 50% have steatohepatitis, and 19%
have cirrhosis22 .The disease is usually silent over many years. Serum
levels of alanine aminotransferase, aspartate aminotransferase, alkaline
phosphatase, and γ-glutamyltransferase are elevated and have been
proposed as surrogate markers ofhepatic fat accumulation23 . The ratio
of aspartate aminotransferaseto alanine aminotransferase is usually less
than 1, but this ratio increases as fibrosisadvances.
Hypertension
Hyperinsulinemia can increase blood pressure by several
mechanisms: via its effect to increase renal sodium absorption, via
induced sensitivity to adrenergic stimuli and antagonized nitric oxide
vasorelaxation24.
Insulin resistance as an initiator of atherosclerosis.
Studies of adults have shown that there is an association between
insulin resistance and atherosclerosis. Increased thickness of the arterial
carotid wall and an atherogenic dyslipidemic profile compounded by
low SHBG levels are factors for increased riskof atherosclerosis.
Importantly, hyperinsulinemia is an independent cardiovascular
risk factor25.The most predictive childhood risk factor was increased
BMI. Coronaryartery calcifications were also associated with increased
blood pressure and decreased HDL cholesterol levels measured during
childhood26. Fatty streaks can be found in the aorta in children older
than 3 yr of age and in coronary arteries by adolescence27. The
Pathobiological Determinants of Atherosclerosis in Youth study
confirmed the origin of atherosclerosis in childhood, showed that
progression toward clinically significant lesions may occur in young
adulthood, and demonstrated that the progression of atherosclerosis is
strongly influenced by CHD risk factors28.
The thickness of the carotid wall, a validated surrogate markerfor
of cholesterol, serum levels of cholesterol and triglycerides, BMI,
smoking, hypertension, and fasting glucose29.
Endothelial dysfunction is an early event preceding the formation
of plaques, representing an early disease process of atherosclerosis that
begins in childhood and is associated with insulin resistance and
hyperinsulinemia30.
Low hormone-binding proteins and SERPINS.
Sex Hormone Binding Globulin(SHBG) has been found to be
negatively correlated with BMI and fasting insulin levels. Decreased
SHBG increases testosteronebioavailability, leading to the development
of hyperandrogenism, even when serum levels of testosterone are
normal.
SHBG is a ß-globulin produced by liver. SHBG is also referred to
as testosterone-binding globulin (TeBG) or sex steroid binding protein
(SBP). SHBG is present in plasma as 100-kDa heterodimer of variable
glycosylated subunits31. In normal men about 50% of circulating
FIG. 5
0 100 200 300 400 500 600
Testosterone(m g/ml)
YOUNG ADULT
OBESE ELDERLY
DISTRIBUTION OF TESTOSTERONE BINDING PROTEINS
SHBG-Te Albumin-Te CBG-Te Free-Te
DISTRIBUTIN OF TESTOSTERONE IN BLOOD PLASMA32
The free fraction represents 1% to 4% of the total testosterone. When the level of SHBG
is reduced , as in obesity, the total testosterone is low, but bioavailanble and free
testosterone levels are generally normal.
Sex hormone binding globulin level is 10 to 50 nmol/L, for men,
45 to 90 nmol/L for children, and 30 to 90 nmol/L for women. Aging
TABLE-2
CONDITIONS WITH ABNORMAL SEX HORMONE BINDING
GLOBULIN CONCENTRATIONS
INCREASED DECREASED
• Aging • Hyperinsulinemia
• Androgen deficiency • Obesity
• Estrogen treatment • Androgen treatment
• Thyrotoxicosis • Hypothyroidism
• Alcoholic cirrhosis • Hypercortisolism
• Hepatitis • Nephrotic syndrome
• Growth hormone
deficiency
• Acromegaly
• Familial
IGFBP-1 is often strikingly depressed in IRS, producing an
excessive of free IGF-I. This can lead to the development of
levels of IGFBP-1 are associated with the severity of IR, whereas
IGFBP-3 correlatesdirectly with the degree of hyperinsulinism.
The low levels of CBG found in IRS lead to disproportionately
free and active circulating cortisol. That can lead to clinical and
metabolic overlap between Cushing’s syndrome and IR. Increased
conversion of inactive cortisone to active cortisol by 11ßHSD1 in
visceral fat compounds the effect. CBGsecretion has been shown to be
negatively regulated by bothinsulin and IL-633.
Thyroid binding globulin levels in insulin resistance are often
depressed, leading to confusion as to the presence of hypothyroidism.
Obese patients are thus often unnecessarily treated for hypothyroidism
that they do not have.
Cortisol Binding Globulin (CBG), thyroid binding globulin, and
plasminogen activator inhibitor-1 (PAI-1) belong to a family of
SERPINS (serine protease inhibitors). These binding proteins (serine
protease inhibitors) are substrates for elastase that is expressed at the
surface of neutrophils. Increased peripheral white blood cell count and
neutrophils are usually found in both obesity and insulin resistance,
cleavage. This mechanism is likely to contribute to decreased serum
bindingglobulins levels in obesity and insulin resistance.
Inflammation, asthma, eczema, and impaired immunity.
Insulin resistance syndrome and type 2diabetes have increased
markers of inflammation,such as C-reactive protein (CRP), erythrocyte
sedimentation rates, and TNF-α levels. BMI correlates with levels of
CRP34, and adiposity has beenreported to be the major determinant of
CRP levels in children. Leptin has been shown to up-regulate the
production of proinflammatorycytokines, including TNF-α and IL-6, to
increase phagocytosis by macrophages, and to increase T helper cell
type 1 (Th1) levelsand suppression of Th2 cytokine production
Significant association between asthma and obesity has been
noted, especially during puberty. One of the possible mechanismsis that
obesity represents a proinflammatory state, and leptin levels influence
Th1 cytokine responses. BMI correlated with the prevalence of asthma
in both boys and girls. It was noted that girls whobecame obese between
ages 6–11 yr were 7 times more likely to develop new asthmatic
Hypoventilation and sleep apnea.
Excess body fat leads to a decline in the expiratory reserve
volume, vital capacity, total lung capacity, and functional residual
volume, probably due to the excess body mass, though others implicate
excessive leptin levels36.
Acanthosis Nigricans (AN)
AN is a skin lesion that is widely used as a clinical surrogateof
laboratory-documented insulin resistance/hyperinsulinemia, denoting a
subgroup with a high risk for type 2 diabetes. The common sites of
involvement include axillae, posterior region of the neck, antecubital
fossae,and groins. Less commonly, it involves the other flexural areas,
umbilicus, submammary region, knuckles, elbows, and, in extreme
cases, the entire skin. The severity of AN correlates well withthe degree
of insulin responses to insulin resistance. AN usually precede insulin
resistance documentable by oral or intravenous glucose tolerance test.
However, AN also persists into the decompensated phase of insulin
resistance where insulin levels maybe normal or low.
High levels of insulin acting on both insulin and IGF-1 receptors
present on keratinocytes and elevated levels of TNF-α and IFN-γ
Hyperandrogenism and reproductive abnormalities
Insulin resistance can present with overt virilization or hirsutism,
menstrual irregularity, persistent acne, scalp hair loss, hyperhydrosis,
infertility, or precocious adrenarche in childhood. Menstrualirregularity
and evidence of hyperandrogenism are associated with the polycystic
ovarian disease.Hyperinsulinemia potentiates ovarian hyperandrogenism
by enhancing pituitary LH secretion, potentiating ovarian
17-hydroxylase and 17,20-lyase activities, and suppressing blood SHBG
and CBGlevels and inhibiting both estradiol- and T4-stimulatedSHBG
production37.
Pseudoacromegaly
Linear and acral growth is usually accelerated in insulin resistance
and may present as pseudoacromegaly. Hyperinsulinemia promotes
lineargrowth by activating skeletal IGF-I receptors, whereas low levels
of IGFBPs can promote IGF-I action by allowing it to be freely and
metabolically available. Ghrelin is known to stimulate GH secretion,and
in obesity ghrelin levels are decreased. Direct action of leptin on bone
growth can predispose to pseudoacromegaly38. Pseudoacromegaly is
seen in the face of low plasma GH levels secretion so typical forobesity.
Leptin decreases GHRH receptor gene transcription, thereby reducing
Others
Additional complications include focal (IgA type) segmental
glomerulosclerosis, uric acid elevation, cholelilthiasis, pseudotumor
cerebri, Blount’s disease, slipped capital femoral epiphysis, and
psychological problems.
MEASURING INSULIN ACTION IN VIVO
Insulin resistance is defined as an impaired ability of plasma
insulin at usualconcentrations to adequately promote peripheral glucose
disposal, suppress hepatic glucose, and inhibit very low density
lipoprotein (VLDL) output, but it can be inferred on strong clinical
evidenceand confirmed by insulin and glucose measurements made by
fasting insulin/glucose screening, oral glucose tolerance tests (OGTT),
the minimal model frequently sampled iv glucose tolerance test
(FSIVGTT), and insulin/glucose clamp studies. Fasting levels of insulin
greater than 15 µU/ml, or insulinpeak (post-OGTT) levels of more than
150 µU/ml and/or more than 75 µU/ml at 120 min of OGTT are
hyperinsulinemiclevels, which infer insulin resistance2,39.
In normal individuals ingestion of a meal increases glucose and
other secretogogues, including glucagons-like peptide 1(GLP1), which
acts to renormalize the plasma glucose level by suppressing glucose
production and increasing glucose utilization. Thus this ‘closed loop’
feed back system regulates plasma glucose concentration. In states of
insulin resistance, the elevated insulin levels will be less able to
normalize the glucose , therefore resulting in secondary stimulus to the
β-cells and hyperinsulinemia. However, β-cell over secretion could also
account for postprandial hyperinsulinism. Because of the closed-loop
relationship between insulin secretion and insulin action it is
problematic to infer the existence of insulin resistance directly from a
‘closed loop' procedure like oral glucose tolerance test (OGTT).
Hyperinsulinemic-euglycemic clamp technique
This technique uses an external feedback control to ‘open the
loop’ between insulin secretion and sensitivity. By maintaining
euglycemia endogenous insulin secretion by pancreas is effectively
‘clamped’40.
Procedure: After over night fasting venous catheters are inserted in
right and left arms and 3 samples of blood to measure the basal insulin
and glucose are taken at 5 min interval. The insulin infusion was started
at a rate of 1mU/kg/min and continued for 3 hours. The starting time is
plasma glucose level is measured at every 5 minutes and glucose
infusion is adjusted to maintain euglycemia at 5.6mmol/L. Insulin levels
are measured usually after 2 hours of study at 140, 160, and 180min.
Usually it takes at least 2 hours to attain steady state of euglycemia. The
rate of glucose infusion is considered a reflection of insulin sensitivity.
The glucose clamp-derived index of insulin sensitivity
(SIclamp)=M/(G*∆I)
M- The steady state of glucose infusion (mg/min)
G- The steady state blood glucose concentration (mg/dl)
∆I- The difference between basal and steady state plasma insulin
concentration (microunits/ml)
SIclamp is usually expressed per kg body weight, per unit of surface area,
or per unit fat free mass.
Modified minimal frequently sampled intravenous glucose tolerance test:
In the normal 24-h day the insulin-sensitive tissues are never
exposed to steady-state conditions. After a meal, glucose and insulin
levels are changing, the rate of glucose uptake lags in time behind the
time courses of glucose and insulin. It may be preferable to measure
rate of glucose disposition. One approach to such a measurement is the
frequently sampled intravenous glucose tolerance test with ‘minimal
model’. Minimal model is a computer model that simply represents the
plasma dynamics in a compact and accurate package41.
Procedure : After 12 hours of fasting, 2 vascular accesses obtained by
inserting 2 flexible indwelling intravenous catheters through both
antecubital veins. One is used for insulin administration; the other is
used for glucose administration. Three samples of blood drawn for
measuring fasting insulin and glucose at 10 min interval. Glucose in the
form of 25% dextrose is administered intravenously over one minute
period at a dose of 0.3g/kg. After 20 min insulin is administered in the
dose of 0.03u/kg. In next 3 hour period 30 blood samples are drawn for
estimation of glucose and insulin at frequent intervals. These values are
entered into MINMOAD computer programme (e.g- version 3,Richard
N.Bergeman 1994) to evaluate the following:
• First phase insulin release (AIRglucose): reflects β cell functionality.
• Insulin sensitivity index (Si) : Reflects ability of insulin to
enhance effect of glucose to normalize its own concentration after
injection.
• Disposition index ( DI): Equals Si times AIRglucose. It reflects
Onthe basis of intravenous glucose tolerance testing, insulin release
consists oftwo phases14. In individuals with type 2 diabetes, the second
phase response is diminished, and the first phase response is almost
absent. However, the first phase response decreases long before the
development of type 2 diabetes. AIR predicts the development of
diabetes at a time when many subjects still have normal glucose
tolerance. TheDI is an excellent method to detect latent ß-celldefects,
though hyperinsulinism documented by a high AIR isa predictor of the
rate of increased fat mass.
Surrogate Measures of Insulin Sensitivity:
Both hyperinsulinemic-euglycemic clamp technique and
frequently sampled intravenous glucose tolerance test are time
consuming, invasive, expensive, labor intensive, requires experienced
personnel, and technically difficult to perform in obese young
individuals. Here arises the need for simple but accurate methods for use
in large populations. Indices of insulin sensitivity derived from fasting
plasma glucose and insulin (HOMA-IR,QUICKI,FGIR, and fasting
insulin) correlate strongly with Si assessed by the frequently sampled
Fasting Insulin:
There is curvilinear relationship between fasting insulin and insulin
sensitivity. If insulin sensitivity is low, fasting insulin will be elevated.
The fasting insulin concentration will not represent an accurate
reflection of insulin sensitivity comparing individuals or groups for
whom β- cell function is not identical. When we compare fasting insulin
between normal individuals and individuals with impaired glucose
tolerance, the latter group is not only insulin resistant, but characterized
by a β-cell defect of at least 50%.
Homeostasis model assessment index (HOMA-IR):
This is based on fasting insulin and fasting glucose values .This is
calculated by following formula
Fasting glucose (mmol/L)×fasting insulin(µmol/ml) HOMA-IR=
22.5
In non diabetic individuals plasma glucose differs little compared
to fasting plasma insulin levels. In non diabetic subjects HOMA-IR
values are proportional to the fasting insulin concentration. HOMA-IR
will not reflect insulin sensitivity accurately in nondiabetic subjects with
Quantitative Insulin Check Index (QUICKI): It is equal to the
inverse of the sum of the logarithms of fasting plasma glucose and
fasting plasma insulin.
QUICKI= 1/ (log fasting insulin(micromol/ml)+log fasting
glucose(mg/dl) )
Despite the logarithmic transformation, QUICKI values exhibit
nonlinear proportionality to fasting plasma insulin and may
underestimate insulin resistance in a population with a latent decrease in
β-cell function.
Fasting Insulin Glucose Ratio (FIGR): The fasting
glucose-to-insulin ratio has also been proposed as a useful estimate of glucose-to-insulin
sensitivity.
Fasting glucose (mg/dl) FIGR=
Fasting insulin (micromol/ml)
Insulin Sensitivity Based Upon the OGTT: There are insulin
sensitivity indices based on oral glucose tolerance test like Stumvoll
index and Matzuda index. It is clear that a correlation between proposed
OGTT-derived indices and clamp-derived insulin sensitivity may exist.
correlations reflect islet cell response rather than insulin sensitivity. As
OGTT-based methods reflect secretion rather than sensitivity,
application of the OGTT methods to subjects with impaired β-cell
secretory capacity(e.g., those with impaired glucose tolerance,type 2
diabetes) would incorrectly underestimate insulin resistance as post load
hyperinsulinemia would be reduced. Another limitation is poor
reproducibility43. This is due to high day-to-day variability in
gastrointestinal function (gastric functioning,absorption and G.I
hormones). It is concluded that variations in OGTT can not be readily
interpreted to reflect changes in insulin sensitivity but rather changes in
gastric emptying, insulin secretion, etc. At this juncture, it may not
possible to support the use of the OGTT for assessing insulin resistance.
TREATMENTS
In children, insulin resistant is usually well compensated by
hyperinsulinemia,but there may be progressive failure of compensation
through puberty with rising glucose and triglyceride levels. Even
compensated hyperinsulinemia canlead to numerous complications from
fatty liver and atherosclerosis to increased cancer risk. It is thus
increasingly obvious that this sequence of events will be most easily
interrupted at theearliest phase of life i.e., during childhood. The child
involvement in an exerciseprogram, such as walking or swimming for
30–40 min mostdays of the week, because exercise provokes glucose
entry into muscle without the involvement of insulin. Calorie and
especially carbohydraterestriction is the key to reduce weight. However,
where there is also an increased level of triglycerides, restriction of
animal fats should be imposed. Fibrates may be required, especially
when trigglycerides levels exceed 500 mg/dl, at which point acute
pancreatitis and gall bladder disease become real risks. In this regard,
behavioral therapy and metformin have been proven safe and effective
in improving insulin sensitivity in pediatric patients44. Laparoscopic
surgery as well has been shown to be effective in decreasing weight,
dyslipidemia, and insulin resistance in adults.
Family-based behavioral interventions for obese children are safe
and useful treatments for pediatric obesity. These interventions have
been associated with reductions in total cholesterol, increases in HDL
cholesterol, reductions in insulin resistance, and return of ovulatory
cycles45.
Metformin is the drug of choice for insulin resistance syndrome.
Metformin has various mechanisms of action in insulin resistance. It
enhances insulin binding to insulin receptor with augmented
effective even in cases of insulin receptor mutations. It increases
peripheral utilization of glucose through potentiating the
phosphoinositol 3-kinase after engagement of the insulin receptor,
increasingtranslocation of the glucose transporters GLUT1 and GLUT4
isoformsto cell membrane in different tissues; increases the activity of
adenosine monophosphate kinase in muscle and liver. It increases
IGFBP-1; decreases endothelin-1, a marker of vasculopathy; and
decreases hepatic glucose output. Metformin down-regulates TNF-α
expression and uncoupling protein-2 mRNA concentrations in liver,
thus decreasing hepatic lipid biosynthesis. Metformin is safe for the
treatment of insulin resistance syndrome in pediatric patients47.
The PPAR-γ (thiazolidenediones) agonists are a group of
ligand-activated transcription factors that govern energy metabolism, cell
proliferation, and inflammation48. PPAR-γ agonists are effective at
insulin sensitization,but are less useful in supporting weight loss.
Lipid-lowering agents
Fibrates lower triglyceride levels, as mediated through thePPAR-γ
transcription factor, mainly in liver, where it has animportant role in FA
oxidation, gluconeogenesis, and amino acidmetabolism. Pretreatment of
inflammation such as vascular cell adhesion molecule-1 expression,
CRP, fibrinogen, PAI-1, and IL-6. Statins inhibit
3-hydroxy-3-methylglutaryl-CoA reductase, the rate-limiting enzyme synthesis of
cholesterol. To compensate for decreased synthesis and to maintain
cholesterol homeostasis, hepatocytes increase the expression of LDL
receptors, whichincreases the uptake of plasma LDL, the main carrier of
extracellularcholesterol, resulting in lower plasma LDL concentrations.
Decreasedplasma LDL levels reduce the progression of atherosclerosis
and may even lead to the regression of preexisting atherosclerotic
lesions. Statins have important immunomodulatory effects as well and
are able to decrease the recruitment of monocytes and T cells into the
arterial wall and inhibit T cell activationand proliferation49.
Low doses of aspirin inactivate the enzyme cyclooxygenase, which
catalyzes the conversion of arachidonic acid to prostaglandins G2 and
H2. These prostaglandins are precursors of thromboxane, a potent
platelet proaggregant and vasoconstrictor. Low doses of enteric coated
aspirin is preferred. Aspirin may have a placein dyslipidemic children
Surgery
Restrictive surgical procedures based on an adjustable silicone
band placement around a stomach fundal pouch can create a functional
partition of the stomach. Whereas restrictive procedures are effective in
reducing intake of solid foods, high consumption of more liquid high
calorie foods may prevent weight loss50. Intestinal bypass surgery in
children should probably only be used only in casesof potentially
life-threatening complications such as sleepapnea.
AIM OF THE STUDY
To correlate the level of sex hormone binding globulin with level
of insulin resistance and (or) hyperinsulinemia in obese prepubertal
REVIEW OF LITERATURE
David E.Laaksonen et al51 assessed the association of low levels
of testosterone and sex hormone binding globulin level with
development of metabolic syndrome and diabetes in men. They
followed 702 middle-aged Finnish men participating in a population –
based cohort study. After 11 years of follow-up, 147 men had developed
the metabolic syndrome and 57 men developed diabetes. Men with total
testosterone, calculated free testosterone and SHBG levels in the lower
fourth had several fold increased risk of developing the metabolic
syndrome and diabetes. They concluded that low total testosterone and
SHBG levels independently predict development of the metabolic
syndrome and diabetes in middle aged men.
V.Jeya Gopal et al52 tried to assess the biological variability of
total testosterone and SHBG in polycystic ovarian syndrome and to
determine the use of SHBG as a surrogate marker of insulin resistance in
PCOS. The PCOS group had higher testosterone, lower SHBG and
greater HOMA-IR than controls. In contrast to HOMA – IR, the intra
individual variation in SHBG was lower in PCOS group. This study
showed that for patients with PCOS, SHBG is an integrated marker of
insulin resistance that may be of use to identity insulin resistant
Involving diabetic and non diabetic obese population, in a
case-contrtol study, V Jeya Gopal et al53 demonstrated inverse relationship
between SHBG concentration and HOMA-IR in the group with type 2
diabetes and in control subjects. In type 2 diabetic group, SHBG
concentrations were lower than those in control subjects. The intra
individual variation of SHBG for the group with type 2 diabetes was
similar to that seen in the control group. In contrast, the mean intra
individual variation of serum insulin and HOMA-IR was significantly
greater in the group with type 2 diabetes than in the control subjects.
Although SHBG levels differed significantly between those with or
without diabetes, the absolute mean difference was small; indicating that
measurement of SHBG can not be used as a simple test for insulin
resistance in diabetics. They concluded that a much larger study is
required to investigate whether diagnostic cut off values for low SHBG
concentrations and insulin resistance in type 2diabetes can be
established. Without these parameters, the utility of a low SHBG
concentration as a reflection of insulin resistance in type 2 diabetes will
be for serial monitoring of insulin resistance in individuals on treatment
after the presence of insulin resistance has been established by
Thus a relationship between hyperinsulinemia and decreased
serum sex hormone binding globulin has been described in adults. Felix
Gascon et al54 evaluated usefulness of SHBG as an index of
hypertsulinemia and/or insulin resistance in obese children (aged 6-9
yrs) of both sexes. They carried out a cross-sectional study of cases and
controls. The obese group presented significantly elevated levels of
insulin, and insulin / glucose ratio compared with control group. SHBG
and testosterone levels were significantly lower than those in the
non-obese group. Fasting insulin, BMI and testosterone were inversely
correlated with SHBG concentration. Multivariate analysis revealed
insulin was the only independent predicting factor for serum SHBG
concentration in obese group. They concluded that there is strong
relationship between insulin and SHBG. Their data supported the role of
insulin in the regulation of serum SHBG level.
PJ Galloway et al55 assessed the validity of SHBG as a potential
marker for hyperinsulinemia / insulin resistance in prepubertal obese
children. 25 obese children were studied; 14 Children were found to be
hyperinsulinemic. The SHBG concentrations were below the sex related
reference range in the hyperinsulinemic group. They concluded that a
subnormal SHBG concentration in a prepubertal child is strongly
predictive of hyperinsulinemia. By measuring the circulating SHBG
concentration, it might be possible to identity those at risk of metabolic
STUDY JUSTIFICATION
Traditionally, hyperinsulinemic – euglycemic clamp technique
and modified minimal model frequently sampled intravenous glucose
tolerance test (FSIVGTT) are used to document the insulin sensitivity or
resistance accurately. Both the procedures are time consuming, invasive,
expensive, labour intensive, require experienced personnel and are
technically difficult to perform in obese young people.
Simple indices based on fasting insulin and glucose concentration
have been developed. Homeostasis model assessment for insulin
resistance (HOMA-IR), Quantitative insulin sensitivity check index
(QUICKI), and fasting glucose-to-insulin ratio (FGIR), are
epidemiologically useful insulin sensitivity indices. These indexes
derived from fasting samples appear to be a valid tool for estimating
insulin sensitivity on obese children adolescents42.
There are certain limitations in using these fasting indices. In
patients with impaired glucose tolerance and overt DM, the utility of
these indices decrease especially that of HOMA-IR56. In overt type 2
DM; large amounts of proinsulin relative to insulin are secreted. Routine
insulin assays will yield falsely high values of insulin and thus make
fasting indices less useful. After therapeutic intervention, on serial
insulin resistance. Even slight exertion or consumption of single toffee
which are quiet unavoidable in young children at times can dramatically
alter values fasting insulin indices.
Hence there is a need for a surrogate marker of insulin resistance,
which is reproducible, stable and easily measured. It would be
invaluable for both research and clinical practice, particularly for
following insulin-sensitizing therapy such as metformin and
thiazolidinediones.
There is evidence that insulin is an important modulator of SHBG
concentration. It is potent inhibitor of SHBG production and also
reduces the stimulatory effect of 17 B-estradiol and thyroxine on SHBG
production.
Reduced serum SHBG levels have been described in different
insulin resistance states with hyperinsulinemia such as polycystic ovary
syndrome52.
Some studies have proved that low SHBG concentration is an
independent risk factor for non-insulin-dependent diabetes mellitus57.
In insulin resistant states unlike insulin and glucose
concentrations, SHBG concentrations are stable and will not undergo
short-term fluctuations.
MATERIALS AND METHODS
Study Design:
Descriptive study.
Study period :
Aug 2004 to March 2006
Study place:
Pediatric Endocrine Division, Institute of Child Health & Hospital
for Children, Chennai – 8.
Inclusion Criteria:
Prepubertal obese children (Tanner stage I) aged move than 5
years with Body Mass Index (BMI) falling above 95th percentile.
Exclusion Criteria:
Secondary causes of obesity (e.g., Genetic syndrome Cushing
syndrome, hypothyroidism, etc) Children on long term drug therapy
composition (e.g.,, amphetamine, methylphenidate, growth hormone,
etc).
Sample Size
Based on two previous European studies conducted on children,
for an α error of 0.05 and the power of study being 0.8 with 95%
confidence interval, calculated sample size is 45 that was approximated
to 50. The anticipated mean difference in SHBG is 15nmol/L. The
anticipated standard deviation is 20nmol/L.
Maneuver
The subjects who were included in the study were admitted in
General pediatric medical ward. After 12 hours of fast and bed rest, the
following biochemical parameters were measured.
1) Fasting plasma glucose
2) Fasting insulin
3) Sex hormone binding globulin
Plasma glucose was determined by glucose oxidase – peroxidase
method in a automated analyzer. Plasma insulin levels were measured
by ELISA immunoassay. Sex hormone binding globulin levels were
The HOMA-IR, QUICKI, and FGIR were derived as estimates of
insulin resistance. The HOMA index was calculated as fasting insulin
concentration (μu/ ml) x fasting glucose concentration (mmol/L) / 22.5.
The QUICKI was calculated as1/ [log fasting insulin concentration (μu/
ml) + log glucose concentration (mg/dL)]. FGIR is calculated as fasting
glucose (mg/dl)/fasting insulin (μu/ ml).
Pearson correlation coefficient was calculated between SHBG and
insulin resistant indices. Simple linear regression was constructed taking
insulin resistant index as dependent variable and SHBG as independent
RESULTS
50 obese prepubertal children were included in the study based
on statistically calculated sample size. Though there was skewed
distribution of fasting insulin level, none of them was overtly diabetic.
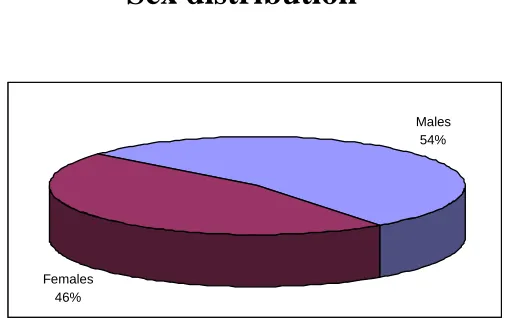
FIG.6
Sex distribution
Of the total of 50 children studied, there were 27 males and 23
females.
Males 54%
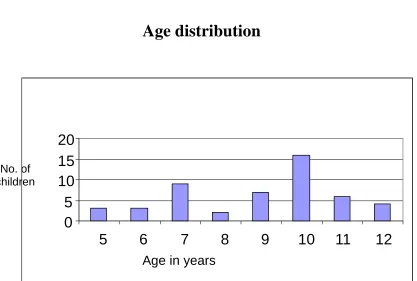
[image:56.612.187.441.277.436.2]FIG.7
Age distribution
Number of cases registered in our obesity clinic increases along
with increasing age. This diagram reflects inclusion criteria of the
study whereby older children with signs of pubertal progression are
excluded.
0
5
10
15
20
5
6
7
8
9
10
11
12
Age in years No. of
[image:57.612.111.528.95.376.2]FIG. 8
CORRELATION BETWEEN SHBG & HOMO - IR
y = -0.1069x + 6.4796
R2= 0.4889
r = -0.699214 p<0.01
There is significant negative correlation between HOMA-IR
values and Sex Hormone Binding Globulin levels exhibiting
non-linear relationship at hyperinsulinemic levels
.
-5 0 5 10 15 20
0 20 40 60 80
FIG. 9
CORRELATION BETWEEN SHBG & FGIR
y = 0.3627x - 1.3856
R2= 0.6491
r =0.805667 p<0.01
There is significant positive correlation between Fasting
Glucose-Insulin Ratio and Sex Hormone Binding Globulin level.
0
10
20
30
40
50
0
20
40
60
80
FIG. 10
CORRELATION BETWEEN SHBG & QUICKI
y = 0.0022x + 0.268
R2= 0.8515
r = 0.922768 p<0.01
There is positive healthy correlation between QUICKI values and
Sex Hormone Binding Globulins.
0.0 0.1 0.2 0.3 0.4 0.5
0 20 40 60 80
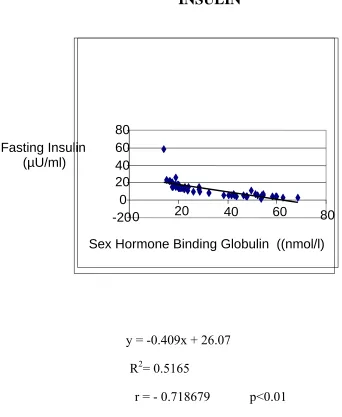
FIG.11
CORRELATION BETWEEN SHBG & FASTING
INSULIN
y = -0.409x + 26.07
R2= 0.5165
r = - 0.718679 p<0.01
There is significant negative correlation between fasting insulin
levels and Sex Hormone Binding Globulin levels which is nearly
equivalent to the correlation established between HOMA-IR and SHBG.
-20 0 20 40 60 80
0 20 40 60 80
Fasting Insulin (µU/ml)
[image:61.612.103.445.160.577.2]DISCUSSION
The plasma SHBG concentration, originally considered to be
under the direct regulation of sex hormone levels, is now considered to
be under multi factorial regulation. Indeed, the basal production of
SHBG seems to be steroid independent and more related to general
metabolic factors and nutritional status58,59. In this sense some hormones
such as growth hormone, insulin like growth factor (IGF)-I and insulin
may play a more active role in the regulation of SHBG levels60.
Recently, there has been increased interest in the role played by insulin
in this multi regulation. It is now known that insulin has an inhibitory
effect on synthesis of SHBG.
By using cultured HepG2 cells, it has been found that insulin is
potent inhibitor of basal production of SHBG. This action may by a
direct mechanism or by indirectly increasing free fraction of IGF1. Any
way, the relationship between insulin and SHBG is widespread
phenomenon in adults61 and is present even in neonates62. Therefore,
evidence suggests that it is a more physiological process than was
originally thought63. Thus SHBG level could be a general marker for
hyperinsulinemic insulin resistance. This would explain the observation
that a low serum SHBG level is a strong predictor for development of
Though numerous adult studies have already established negative
correlation between insulin resistance and sex hormone binding globulin
level, prepubertal period is ideal time to test the relationship. During
pubertal progression, there are dynamic changes in the level of insulin
resistance. Insulin resistance increased immediately at the onset of
puberty (T2) but returns to near prepubertal level by the end of puberty
(T5). Its peak occurs at T3 in both sexes64. Girls are more insulin
resistant than boys at all pubertal stages.
More over SHBG level is also influenced by sex hormones.
Androgens decrease SHBG level: estrogen increase SHBG level.
Pregnancy, oral contraception and liver disease adversely affect the
normal physiological levels of SHBG. Because of absence of sex
hormone influence on SHBG, insulin alone has greatest impact on its
secretion in prepubertal period. More over prepubertal children aged
more than 5 years are more prone to develop simple obesity. Hence
prepubertal period offers excellent opportunity to study correlation
between SHBG and insulin resistant status among all age groups.
David E.Laaksonon51 et al showed that after adjustment for age,
men with concentration of SHBG in the lower fourth were 1.7 – 2.8
times more likely to develop the metabolic syndrome than other men
showed that after adjusting for age, men with SHBG concentration in
lower fourth had increased risk of incidence of diabetes by 1.7 to 4.3
fold.
Vijay JeyaGopal et al52 established an inverse relationship
between SHBG concentration and HOMA-IR in the adult population of
type 2 diabetes (r = -0.32, P – 0.001) and in control subjects (r = - 0.28,
P – 0.003).
Vijay JeyaGopal et al53, in their study of 12 polycystic ovarian
cases showed higher HOMA-IR in the PCOS group than in controls and
established inverse relationship between SHBG concentration and both
serum insulin (r = -0.24, P – 0.001) and HOMA – IR (r = -0.21,
P= 0.001).
Very few studies have been conducted so far in children
correlating SHBG level and Insulin resistance. Felix Gascon et al54 in 61
obese children, showed the negative correlation between SHBG level
and insulin (r = -0.4512, P - < 0.001). There was positive correlation
between FGIR and SHBG (r = 0.4573, P < 0.001).
It is increasingly being recognized that Indians and other South
Asians are an ethnic group at high risk for insulin resistance65. This is
Euglycemic – hyperinsulinemic clamp studies, the gold standard
for insulin resistance experiments have shown South Asian men have
shown to have lower glucose disposal rates per kg lean body mass as
compared to Caucasian American66. For a similar BMI, Indian had
higher truncal fat than Caucasian. International Diabetic Epidemiology
group estimated that DM prevalence in Indians start increasing at BMI
of 15 – 20 Kg/m2 compared with greater than 25kg/m2 in Chinese,
Japanese and European Population. Thus Indians are at high risk for
type 2 DM and metabolic syndrome. So there is a need to validate every
conclusion of obesity research in Indian scenario.
Our effort is probably first in India to study the correlation
between Insulin resistance and sex hormone binding globulin level in
children. Our aim is restricted to find correlation between SHBG and
insulin resistant indices only. If healthy correlation is found, it may be
useful in our obesity clinic to serially follow the obese children without
subjecting them into repeated fasting to determine insulin resistant
status.
To fix cut off value for SHBG to determine insulin resistance, a
study involving large sample size with cases and controls may be