CLINICAL PROFILE OF LEAN BODY WEIGHT TYPE2
DIABETES MELLITUS PATIENTS IN COMPARISON
WITH NORMAL WEIGHT AND OBESE TYPE2
DIABETES MELLITUS PATIENTS
Submitted to
The Tamil Nadu Dr. M.G.R. Medical University
M.D. DEGREE EXAMINATION BRANCH – I (GENERAL MEDICINE)
THE TAMIL NADU DR. M.G.R. MEDICAL
UNIVERSITY
BONAFIDE CERTIFICATE
This is to certify that “CLINICAL PROFILE OF LEAN
BODY WEIGHT TYPE 2 DIABETES MELLITUS PATIENTS IN COMPARISON WITH NORMAL WEIGHT AND OBESE TYPE 2 DIABETES MELLITUS PATIENTS” is a bonafide work done by Dr. S.M. SHAVANA, post graduate student, Department of
General Medicine, K.A.P. VISWANATHAM GOVERNMENT
MEDICAL COLLEGE, TRICHY-1 under my guidance and supervision
in partial fulfillment of regulations of The Tamilnadu Dr. M.G.R.
Medical University for the award of M.D. Degree Branch I, (General
Medicine) during the academic period from May 2008 to April 2011.
Prof. Dr. A. KARTHICKEYAN, M.D., DEAN
K.A.P.V. Government Medical College Trichy -1
Prof. Dr.C.ASOK KUMAR M.D.,
Associate Professor, Unit-II, Dept of Medicine,
K.A.P.V. Government Medical College Trichy -1
Prof. Dr. S.PANNEER SELVAM, M.D.,
Professor & Head of the Department, Dept of Medicine,
DECLARATION
I Dr. S.M. SHAVANA solemnly declare that the dissertation
titled, “CLINICAL PROFILE OF LEAN BODY WEIGHT TYPE
2 DIABETES MELLITUS PATIENTS IN COMPARISON WITH NORMAL WEIGHT AND OBESE TYPE 2 DIABETES MELLITUS PATIENTS” is a bonafide work done by me at Annal Gandhi Memorial hospital affiliated to K.A.P.V. Government Medical
College, Trichy-1 under the guidance and supervision of
Prof. Dr. S. PANNEER SELVAM, M.D., HOD/Prof of medicine and
Unit Chief, Prof. Dr. C. ASOK KUMAR, M.D., The dissertation is
submitted to The Tamilnadu Dr.M.G.R.Medical University, towards
the partial fulfillment of requirement for the award of M.D degree
(Branch-I)in General Medicine.
Place : Trichirappalli Dr. S.M. SHAVANA
ACKNOWLEDGEMENT
I express my sincere gratitude to the
Dean Dr. A. K. KARTHIKEYAN, M.D., for allowing me to utilize the clinical
materials for this study.
I am extremely grateful to Prof. Dr.S. PANNEER SELVAM M.D.,
Prof & Head of the Department of The Medicine for his constant
guidance and encouragement.
I whole heartedly express my sincere thanks to my beloved Unit
Chief Prof. Dr. C. ASOK KUMAR, M.D., Associate Professor of
Medicine for his encouragement and valuable guidance.
I thank Assistant professors Dr. A. SETHURAMAN, M.D.,
D. Diab., and Dr. A. JOSEPH PANNEERSELVAM D.N.B (General
Medicine) D.Diab., for their guidance and valuable support throughout
my work.
I thank my unit Assistant Professors Dr. S. MANOHARAN M.D.,
Dr. C. MANOKARAN, M.D., Dr. P. JAISHANKAR, M.D., DM
(Cardio)., sincerely for their valuable support.
I whole heartedly express my sincere thanks to Prof. Dr. SELVA
allowing me to use the Laboratory for the measurement of Biochemical
parameters necessary for the study.
I also extend my thanks to all the laboratory technicians in the
Biochemistry Department for their valuable support throughout my dissertation
work.
I also thank my parents, Colleagues, friends and staff of our hospital for
their support for this work.
Last but not the least, I sincerely thank all the patients who participated
CONTENTS
SL.
NO. TITLE
PAGE NO.
1. INTRODUCTION 1
2. REVIEW OF LITERATURE 2
3. AIMS AND OBJECTIVES 28
4. MATERIALS AND METHODS 29
5. RESULTS AND OBSERVATIONS 35
6. DISCUSSION AND ANALYSIS OF RESULTS 49
7. COMPARATIVE ANALYSIS 54
8. SUMMARY 60
9. CONCLUSION 61
APPENDIX
BIBLIOGRAPHY
PROFORMA
MASTER CHART
INTRODUCTION
Diabetes Mellitus is a group of metabolic disorders characterized
by a deficiency of insulin secretion and / or insulin effect, which causes
hyperglycemia, disturbances of carbohydrate, fat and protein metabolism
and a constellation of chronic complications. Diabetes is and will remain
a threat to global health .World wide diabetes probably affects 150
million people and its prevalence is predicted to double by 2015. The
incidence of diabetes is showing an alarming rise in developing countries,
particularly in India3. 60-80% of the diabetics in developed countries are
obese. Whereas in India we find that clinical profile of diabetics is
different1.
Most of the patients attending our diabetic clinic are not obese as
defined by existing parameters such as BMI. It is interesting to note that
most patients fall in normal weight group and some even lean group.
Obesity in type 2 diabetes is less common in Indian population compared
to western population1,4. So, it is worth studying the clinical profile of
lean type 2 diabetes, by comparing with normal and obese population
REVIEW OF LITERATURE
Diabetes Mellitus comprises a group of metabolic disorders that
share the phenotype of hyperglycemia due to absolute or relative
deficiency of insulin. Several distinct types of Diabetes Mellitus exist and
are caused by a complex interaction of genetics, environmental factors
and life style choices. Lack of insulin affects the metabolism of
carbohydrates, protein and fat and causes a significant disturbance of
water and electrolyte homeostasis. Though acute metabolic
decompensation is fatal, long standing metabolic derangement is
frequently associated with permanent and preventable functional and
structural changes in the cells of the body, with those of the vascular
system being particularly susceptible5,6. These changes lead to the
development of well defined clinical entities the so called complications
of diabetes which characteristically affect the eye, kidney and the nervous
system.
Classification2
Although all forms of DM are characterised by hyperglycemia the
pathogenic mechanisms by which hyperglycemia arises differ widely.
a genetic defect leading to defective insulin secretion, whereas other
forms share insulin resistance as their underlying etiology.
ETIOLOGIC CLASSIFICATION OF DIABETES MELLITUS32
I. Type 1 diabetes
A. Immune mediated
B. Idiopathic
II. Type 2 diabetes
III. Other specific types
A. Genetic defects of β - cell function
B. Genetic defects in insulin action
C. Diseases of the exocrine pancreas
D. Endocrinopathies
E. Drug - or chemical induced
F. Infections
G. Uncommon forms of immune-mediated diabetes
Other types of Diabetes Mellitus2
Other etiologies of Diabetes Mellitus include specific genetic
defects in insulin secretion or action, metabolic abnormalities that impair
insulin secretion, and a host of conditions that impair glucose tolerance.
Maturity onset diabetes of the young (MODY)2 is a subtype of Diabetes
Mellitus characterised by autosomal dominant inheritance, early onset of
hyperglycemia and impairment in insulin secretion. Mutations in the
insulin receptor cause a group of rare disorders characterised by severe
insulin resistance. Diabetes Mellitus can result from pancreatic exocrine
disease- pancreatitis, fibrocalculous pancreatopathy, haemochromatosis
,etc when the majority of pancreatic islets (>80%) are destroyed.
Endocrinopathies such as Acromegaly and Cushing's disease also,
present with Diabetes Mellitus.Rarely viral infections such as rubella,
coxsackie and cytomegalo viruses have been implicated in pancreatic
islet cell destruction.Drugs and Chemicals such as Glucocorticoids,
immunosuppressives, chemotherapeutic agents, B-blockers, thiazides,
pentamidine,vacor also play a role in the causation.
Gestational diabetes mellitus
Insulin resistance related to the metabolic changes of late
or impaired glucose tolerance.These women have a substantial risk of
developing Type 2 diabetes in later life.
Lean body type 2 diabetes mellitus patients have severe basal
hyperglycemia with low circulatory levels of insulin while C-peptide
levels are similar to those of patients with classic type 2 Diabetes
mellitus. Studies on hepatic glucokinase levels & hepatic microsomal
enzymes (mixed function oxidase & cytochrome P 450) using antipyrine
& lidocaine as in vivo probes revealed hyperactivity with increased futile
cycles of CHO metabolism in lean body type 2 patients. These hepatic
metabolic features are likely to be responsible for excess insulin
utilization & extraction during first pass in the liver leading to low
peripheral circulating levels. Homocysteine levels are also low suggesting
efficient metabolic status12,13.
Auto immune destruction11 of beta cells is not the cause of
hypoinsulinemia as levels of ICA-512 / IA2 (islet cell antibody)and
anti-GAD (anti glutamic acid decarboxylase) antibodies are similar to those in
patients with classical type 2 diabetes mellitus & much lower than those
in type1 diabetes mellitus. In this way, it differs from the latent auto
immune diabetes in aduls (LADA) which present at a later age.
Proteinuria found in uncontrolled metabolic states often reverses
suggesting endothelial cell dysfunction.
Lean body type 2 diabetes mellitus is not mere anthropometric
variant of classical type 2 diabetes mellitus but constitute an independent
variant of type 2 diabetes mellitus7,8,14 with inherent peculiarities in
insulin kinetics in the hepatic bed along with altered profile & behaviour
of key enzymes related to CHO metabolism. These peculiarities are
reflected in the peripheral circulation as states of hypoinsulinemia,
hyperglycemia, dyslipidemia12,16 without low HDL C, raised TGL &
fewer other markers for atherosclerosis which make these diabetics less
prone to develop macro vascular disease14-17, while peripheral neuropathy
and consequences of hyperglycemia like infections & proteinuria
dominate the clinical picture.
Epidemiology
Diabetes remains a threat to global health. World wide the
prevalence of Diabetes is estimated to increase from 4% in 1995 to 5.4%
by the year 202519. India has the dubious distinction of having the largest
number of diabetics in the world. The prevalence 'of Diabetes in India
Study (PODIS) showed that type 2 Diabetes Mellitus was found in 7.06%
is the leading cause of end stage renal disease, non traumatic lower
extremity amputations and adult blindness in U.S. The increasing
prevalence of Diabetes Mellitus in developed countries is largely
attributed to increasing obesity and reduced activity levels. The
prevalence of Type 2 DM and its harbinger, IGT is highest in certain
pacific islands, intermediate in countries such as India1 and United States,
relatively less in Russia and China. This variability is likely due to
genetic, behavioral and environmental factors. The pattern and profile are
very different in India compared to the west1.
Criteria for the Diagnosis of Diabetes Mellitus20
o Symptoms of Diabetes plus random blood glucose
concentration > 11.1 mmol/L (200 mg/dl)(a) (or)
o Fasting plasma glucose > 7.0 mmol/L (126 mg/dl)(b) (or)
o Two hour plasma glucose > 11.1 mmol/L (200 mg/dl) during an oral glucose tolerance test.(c)
o HbA1C>/=6.5%(d)
a) Random is defined as without regard to time since the last
meal.
c) The test should be performed using a glucose load containing
the equivalent of 75 gm anhydrous – glucose dissolved in
water: not recommended for routine clinical use.
d) The test should be performed in a laboratory that is NGSP
certified and standardized to the DCCT assay.
[image:16.595.88.545.378.671.2]Source: Adapted from American Diabetes Association, 2010.
Table 2
Diagnostic Criteria for Pre-Diabetes and Diabetes20
Test IFG IGT Diabetes Gestational
Diabetes*
FPG 100-125 Not defined ≥ 126 mg/dl ≥ 95 mg/dl
RPG Not defined Not defined ≥ 200 mg/dl Not defined
75-g OGTT 2-hour plasma glucose
Not defined 140-199
mg/dl ≥ 200 mg/dl Not defined
100-g OGTT Not defined Not defined Not defined
1-hour: ≥ 180 mg/dl
2-hour: ≥ 155 mg/dl
3-hour: ≥ 140 mg/dl
AIC Not
defined**
Not
defined** ≥ 6.5% Not defined
PATHOGENESIS5,6 Type 1 Diabetes Mellitus
Type 1 Diabetes Mellitus develops as a result of the synergistic
effects of genetic, environmental and immunologic factors5,6 that
ultimately destroy the pancreatic beta cells.
1. Genetic Factors
Account for one third of the susceptibility to Type 1 Diabetes, the
inheritance of which is polygenic. Over 20 different regions of the human
genome show some linkage with type 1 diabetes, but most interest has
focused on the human leucocyte antigen (HLA), on the short arm of
chromosome 6. The HLA haplotypes DR3 and / or DR4 alleles are
associated with increased susceptibility to type 1 diabetes.
2. Environmental factors
Although genetic susceptibility be a prerequisite for the
development of type 1 diabetes, the concordance rate between
monozygotic twins is less than 40%. Environmental factors have an
important role in promoting clinical expression of the disease.
The hygiene hypothesis
Lack of exposure to pathogenic organisms in early childhood
3. Viruses
Several viruses have been implicated, including mumps5,6,
Coxsackie B4, retroviruses, rubella (in utero) Cytomegalovirus and
Epstein–Barr virus.
4. Diet
Bovine serum albumin (BSA), a major constituent of cow's milk,
has been implicated in triggering type 1 diabetes. It has been shown that
children who are given cow's milk early in infancy are more likely to
develop type 1diabetes than who are breast fed.
5. Stress
Stress may accelerate the development of type 1diabetes, by
increasing counter regulatory hormones and possibly by modulating
immune activity.
6. Immunological factors
Type 2 diabetes is a slow T cell mediated autoimmune disease.
Many studies have produced evidence that destruction of the insulin
Pathogenesis of Type 1 Diabetes
Normal islet cells
? Viral infection in pancreatic beta cells
Secretion of interferon α – by pancreatic beta cells
Hyper expression of class 1 MHC Antigen within islets
Insulitis
Selective destruction of beta cells
(glucagon secretion preserved)
Type 2 Diabetes Mellitus
Type 2 Diabetes mellitus commonly occurs in subjects who are
obese and insulin resistant, but these two factors alone are insufficient to
cause diabetes unless accompanied by impaired beta cell function.
1. Genetics
Genetic factors are more important in the etiology of type 2 DM
than type 1 diabetes, as shown by studies in monozygotic twins where
concordance rates of type 2 diabetes approaches 100%.
2. Environmental Factors
The majority of cases of type 2 diabetes are multifactorial in
nature, with interaction of environmental and genetic factors.
a) Life style: Overeating, fastfood eating habits especially when
combined with obesity and underactivity.
b) Malnutrition in utero: It is proposed that, (but not yet proven),
malnutrition in utero may programme beta cell development and
metabolic functions at a critical period, so predisposing to type 2 diabetes
c) Age: Age is an important risk factor for type 2 diabetes. Type 2
Diabetes is principally a disease of the middle aged and elderly, affecting
10% of the population over the age of 65.
d) Pregnancy: During normal pregnancy, insulin sensitivity isreduced
through the action of placental hormones and this affects glucose
tolerance.
Pathogenesis of Type 2 Diabetes Mellitus5,6
i) Insulin resistance
ii) Pancreatic Beta cell failure
1. Insulin Resistance
Increased hepatic production of glucose and resistance to the action
of insulin in muscle are invariable in both obese and non obese patients
with type 2 diabetes. Insulin resistance may be due to
a) an abnormal insulin molecule
b) an excessive amount of circulating antagonists or
c) Target tissue defects
The last is the most common cause of insulin resistance in type 2
2. Pancreatic Beta Cell Failure5,6
In type 2 DM, there is only moderate reduction in the total mass of
pancreatic islet tissue which is consistent with a measurable fall inplasma
insulin concentration. Some pathological changes are typical of type 2
diabetes, most conspicuous of which is deposition of amyloid. While beta
cell numbers are reduced by 20-30% in type 2 diabetes, alpha cell mass is
unchanged and glucagon secretion is increased, which may contribute to
the hyperglycemia5,6.
Some people with type 2 diabetes, most of whom are not
overweight, have advanced pancreatic beta cell failure at the time of
PATHOGENIC PROCESS OF DIABETES MELLITUS
Hyperglycemia
Pre-diabetes Diabetes mellitus
Type of diabetes Normal glucose tolerance Impaired fasting glucose or Impaired glucose tolerance Not insulin requiring Insulin required for control Insulin required for survival Type 1 Type 2 Others GDM Time (years)
FPG 100mg/dl 100-125% 126 mg/dl
2-h PPG 140 mg/dl 140-199mg% 200 mg%
SPECTRUM OF GLUCOSE HOMEOSTASIS AND DIABETES
MELLITUS
In most types of DM, the individual traverses from normal glucose
tolerance to impaired glucose tolerance to overt Diabetes. In some types,
COMPLICATIONS OF DM
Acute Complications
Diabetic ketoacidosis (DKA) and Hyperglycemic hyperosmolar
state (HHS) are acute complications2 of diabetes. DKA is seen primarily
in individuals with type 1 Diabetes Mellitus, and HHS is seen in
individuals with type 2 Diabetes Mellitus. Both disorders are associated
with absolute or relative insulin deficiency, volume depletion and altered
mental status. Both are potentially serious if not promptly diagnosed and
treated. Side effects of intensive treatment include severe hypoglycemia
and Lactic acidosis21.
Chronic complications
Chronic complications2 of DM affect many organ systems and are
responsible for majority of morbidity and mortality.
Chronic complications of Diabetes Mellitus2
Microvascular Macrovascular Others
Eye disease:
Retinopathy
Coronary artery disease
Gastrointestinal
Macular oedema Peripheral vascular
disease Genito urinary Cerebrovascular disease Dermatological Neuropathy Cataract
Sensory and Motor Glaucoma
Autonomic Peiodontal disease
The risk of complications of both type 1 and type 2 increases as a
function of the duration of hyperglycemia. They usually become apparent
in the second decade of hyperglycemia.
Mechanism of complications5,6
Three major theories have been proposed to explain the emergence
of complications.
1. Increased intracellular glucose leads to the formation of advanced
glycosylation end products (AGEs) via non enzymatic
glycosylation of cellular proteins. AGEs have been shown to cross
link proteins, accelerate atherosclerosis, promote glomerular
dysfunction, reduce nitric oxide synthesis, induce endothelial
dysfunction and alter the extracellular matrix composition and
structure.
2. Hyperglycemia increases glucose metabolism via the sorbitol
pathway. Increased intracellular glucose is converted to sorbitol by
the enzyme aldose reductase. Increased sorbitol concentrations
affect several aspects of cellular physiology and may lead to
cellular dysfunction.
3. Hyperglycemia increases the formation of diacylglycerol leading to
related complications. Finally oxidative stress and free radical
generation may also promote the development of complications.
Diabetic Retinopathy
Diabetic retinopathy is the most common cause of blindness in
adults. Hyperglycemia increases retinal blood flow and metabolism and
has direct effects on retinal endothelial cells and pericytes, loss of which
impairs vascular auto regulation. The resulting uncontrolled blood flow
increases production of vasoactive substances and endothelial cell
proliferation resulting in capillary closure. This causes chronic retinal
hypoxia and stimulates production of growth factors, including vascular
endothelial growth factor (VEGF) to stimulate endothelial cell growth
(causing new vessel formation) and increased vascular permeability
(causing exudative damage).
Diabetic Nephropathy
Diabetic Nephropathy is the leading cause of end stage renal
disease (ESRD) in many countries.
Mechanism of chronic hyperglycemia to ESRD involves
1. interaction of soluble factors (AT II, AGEs, Endothelin)
2. hemodynamic alterations in renal microcirculation.
Diabetic neuropathy
"A descriptive term meaning a demonstrable disorder, either
clinically evident or subclinical that occurs in the setting of diabetes
mellitus without other causes for peripheral neuropathy. The neuropathic
disorder includes manifestations in the somatic and/or autonomic parts of
the peripheral nervous system.
Aetiopathogenesis of Diabetic Neuropathy
Hypotheses concerning the multiple etiologies of diabetic
neuropathy include a metabolic insult to nerve fibers22, neurovascular
insufficiency, autoimmune damage, and neurohormonal growth factor
deficiency. Several different factors have been implicated in this
pathogenic process. Hyperglycemic activation of the polyol pathway
leading to accumulation of sorbitol and potential changes in the NAD:
NADH ratio may cause direct neuronal damage and/ordecreased nerve
blood flow (Greene et al, 1983). Activation of protein kinase C induces
vasoconstriction and reduces neuronal blood flow (Veves et al, 2001).
Increased oxidative stress, with increased free radical production causes
vascular endothelial damage and reduces nitric oxide bioavailability
neurons. In a subpopulation of individuals with neuropathy, immune
mechanisms may also be involved. Reduction in neurotrophic growth
factors, deficiency of essential fatty acids, and formation of advanced
glycosylation end products (localized in endoneurial blood vessels
(Brownlee, 1992) also result in reduced endoneurial blood flow and nerve
hypoxia with altered nerve function. The result of this multifactorial
process may be activation of polyADP ribosylation and depletion of ATP,
resulting in cell necrosis and activation of genes involved in neuronal
damage.
Diabetic autonomic neuropathy
A subtype of the peripheral polyneuropathies that accompany
diabetes, Diabetic autonomic neuropathy (DAN) can involve the entire
autonomic nervous system (ANS) the vasomotor, visceromotor, and
ensory fibers of which innervate every organ. Diabetic autonomic
neuropathy may be either clinically evident or subclinical. It is
manifested by dysfunction of one or more organ systems
(e.g.,cardiovascular, gastrointestinal, genitourinary, or ocular).
Indeed,because the vagus nerve (the longest of the ANS nerves)accounts
for roughly 75% of all parasympathetic activity and, Diabetic autonomic
autonomic dysfunction may be common. They may frequently be due to
other causes rather than to true autonomic neuropathy. Subclinical
autonomic dysfunction can however, occur within a year of diagnosis in
type 2 diabetes patients (Pfeifer et al, 1984). Cardiovascular autonomic
neuropathy (CAN) is the most clinically important and well-studied form
of Diabetic autonomic neuropathy as it is associated with various adverse
outcomes.
Macrovascular Complications2
1. Cardiovascular Morbidity and Mortality
Framingham Heart study revealed a marked increase in congestive
heart failure, coronary artery disease, myocardial infarction (MI),
Peripheral arterial disease and sudden death (risk increases from one to
five fold) in DM. American Heart Association recently designated
Diabetes mellitus as a major risk factor for cardiovascular disease (same
category as smoking, hypertension and hyperlipedemia).
The absence of chest pain (silent myocardial ischemia) is common in
individuals with diabetes and a thorough cardiac evaluation is indicated.
Coronary artery disease is more likely to involve multiple vessels in
2. Hypertension
Hypertension in diabetes mellitus can accelerate other
complications of DM, particularly cardiovascular disease23, and
nephropathy. Blood pressure goal in individual with diabetes is < 130 /80
mm Hg. It is often difficult to control hypertension with a single agent
especially in type 2 DM.
3. Dyslipidemia
Individuals with diabetes may have severe forms of dyslipidemia.
Because of additive cardiovascular risk of hyperglycemia and
hyperlipidemia, lipid abnormalities should be aggressively detected and
treated23,24. Most common pattern of dyslipidemia is hypertriglyceridemia
and reduced HDL cholesterol levels.
Target lipid values10,20 in diabetic individual without cardiovascular
disease should be,
¯ LDL < 100 mg/dl
¯ HDL (>40 mg/dl) in men
¯ HDL (>50 mg/dl) in women
¯ Triglycerides < 150 ml/dl
4) Lower extremity complications2
Diabetes is the leading cause of non traumatic lower extremity
amputations. Foot ulcers and infections are also a major source of
morbidity in individuals with DM.
5) Infections2
Individuals with DM have a greater frequency and severity of
infection. The reasons for this include incompletely defined abnormalities
in cell mediated immunity and phagocytic function associated with
hyperglycemia, as well as diminished vascularisation. Cardiac and other
fungal infections, emphysematous infections of the gall bladder and
urinary tract, pneumonia and skin and soft tissue infections are all more
common in diabetic population. However gram negative organisms,
M.tuberculosis and S. Aureus are also more frequent pathogens.
Diabetic skin complications2
1. Diabetic dermopathy – begins as an erythematous area and evolves
into an area of circular hyperpigmentation.
2. Necrobiosis Lipoidica – Diabeticorum – usually begins in the
that gradually enlarge, darken and develop irregular margins with
atrophic centers and central ulceration.
3. Acanthosis nigricans – Hyperpigmented velvety plaques seen on the
neck, axilla, or extensor surfaces, is sometimes a feature of severe insulin
resistance.
4. Granuloma Annulare – erythematous plaques on the extremities or
trunk.
5.Scleredema – Area of skin thickening on the back or neck at the site of
previous superficial infections.
6. Lipoatrophy and Lipohypertrophy
CLINICAL PROFILE OF LEAN TYPE 2 DIABETES
Articles review
1. Clinical profile of lean type 2 diabetes – study conducted at Madras
Diabetes Research Foundation14, India with 347 lean, 6274 normal
and 3252 obese type 2 diabetes patients in 2002 observed.
a. 60% are non obese and lean type 2 DM constituted 3.5%.
b. Increased prevalence of retinopathy, nephropathy and
neuropathy in lean type 2 DM patients.
2. Clinical profile of type 2 diabetes mellitus and body mass index25 –
is there any correlation?. Study conducted with 500 patients at
Manipal, Kasthurba Medical College by Prabhu Mukhyaprana in
2004 observed,
a. Majority (65%) belonged to normal weight diabetes
group, and 7.1% were lean diabetics.
b. Most of the lean diabetics were males (65%) with less
positive family history.
c. There was linear increase in number of patients having
abnormal WHR with increase in BMI.
d. Microvascular complications were found in similar
e. Lean diabetics are less prone to develop macro vascular
complications like HT and IHD.
f. Lean diabetics have more severe hyperglycemia and poor
metabolic control.
g. Analysis of lipid profile showed, all the parameters were
lower in lean diabetics compared to other groups i.e.
normal and obese patients.
3. Clinical profile of lean body weight type 2 DM patients in
comparison with obese and non obese type 2 diabetes patients:
Study conducted at Jamnagar, M.P. Shah Medical College by
Gohel DR, Deszi VK26, in 2002-2003 observed very similar results
as previous studies. In addition,
i) Increased incidence of higher fasting plasma glucose
(239+42.5) in lean diabetics.
ii) Peripheral neuropathy (52%) and infections (42%) were the
commonest presenting clinical features in lean patients26.
4. Increased prevalence of Retinopathy, nephropathy and neuropathy
in lean diabetics; Mohan et al.
5. Studies by Banerji et al and Dass et al had showed slight increase
6. Japanese study by Ikeda et al showed no major differences in lipid
profile in lean diabetics irrespective of glycemic status.
One observation from the National Institute of Diabetes and
Digestive kidney diseases, Phoenix, that “NIDDM in the presence of low
BMI is more strongly familial than that at a higher BMI,” warrants
further study into the possible genetic mechanisms that modulate the
AIM OF THE STUDY
1. To Study and compare the clinical profile of Lean Body weight
Type 2 Diabetes Mellitus patients with obese and Normal weight
Type 2 DM patients, by age, sex, family history and
Anthropometry.
2. To compare the "presenting complications" of the lean with normal
weight / obese type 2 Diabetes patients.
3. To compare the Biochemical profile of the lean type 2 Diabetes
MATERIALS AND METHODS
Type of the study : Cross sectional
Period of study : January 2010 – September 2010
Place of study : Annal Gandhi Memorial Government Hospital,
Trichy.
No.of Patients : 100
Materials : Type 2 Diabetes Mellitus patients
The hundred patients were divided into three groups based on BMI.
Body Mass Index (BMI)
Group A: BMI < 18.5 Kg/m2 (Lean Body Weight Type 2DM)
Group B: BMI, between 18.5 and 24.9 Kg/m2 (Normal Weight Type 2
DM).
Group C: BMI > 30Kg/m2 (Obese Type 2 DM)
A careful detailed history were taken from each person, i.e. Age of
onset, duration, any positive family history, dietary pattern, presenting
complaints – at the time of diagnosis etc. Detailed examination was done
for all the hundred patients to find out various complications, if any.
Biochemically, Blood glucose (Both fasting and post prandial), Blood
Selection of cases
Cases included in the study were selected as per the records
available with them. Duration of disease, Body Mass Index, Waist Hip
Ratio, current Blood Glucose, Urea, Serum Creatinine and Lipid profile
were taken into consideration.
Exclusion Criteria for cases
1. Presence of history of pulmonary tuberculosis.
2. Presence of other chronic illnesses that could affect body
weight like chronic liver disease and chronic kidney disease.
3. Type 2 Diabetes patients with Age of onset less than 30
years.
4. History wise, particularly in lean patients those who were
normal or obese at the time of presentation, but lost body
weight significantly after the detection of type2 Diabetes
mellitus.
5. Patients with history of Cancer /HIV.
6. Over weight patients with BMI between 25-30.
Selection of Controls
Methods
1. Height (in meter), Weight (in kg) measured in all patients.
BMI (Body Mass Index) calculated based on the formula,
BMI (kg/m2) = Weight (kg)/Height (in m2) (Quetelet)
2. Waist hip Ratio (W/H Ratio)
o 'Waist Circumference' measured at midpoint between the costal margin and anterior superioriliac spine. Hip
measurement taken as maximum diameter at the greater
trochanter.
o Waist / Hip Ratio (WHR) was calculated in each case.
o Waist Hip ratio was considered abnormal if > 0.9 for males and > 0.8 for females.
Patients were clinically screened for microvascular and
macrovascular complications.
ë Patients were considered as hypertensives if blood pressure was >
130/80 mm Hg.
ë Patients were considered as having ischemic heart disease based on
ischemic changes in the ECG or by demonstrating regional wall
motion abnormalities in the echocardiogram for selected patients.
objective evidence in the form of loss of ankle jerk or glove and
stocking type of anaesthesia.
ë Nephropathy was diagnosed based on blood urea and serum
creatinine values and Ultrasound abdomen and urine microalbumin
in selected patients.
ë Fasting, postprandial glucose, fasting lipid profile and other
relevant investigations were done in each case.
Definitions and Cut Off values for the study28
1. Body Mass Index (BMI)
18.5-24.9 (kg/m2) – taken as normal value
<18.5 (kg/m2) – lean body weight
>30 (kg/m2) – obese body weight
2. Waist Hip Ratio
WHR - >0.85– was taken as abnormal value in females.
>0.9 in males as abnormal value.
3. Fasting 'Hyperglycemia'
Fasting Hyperglycemia means if Blood glucose value >126 mg%
4. Post prandial Hyperglycemia
Postprandial blood sugar measured at 2 hours after the meals. Post
prandial hyperglycemia means if value > 200 mg%
5. Lipid Profile
Lipid profile taken after 8 hours overnight fasting.
Range of Normal Values
¯ Free cholesterol < 200 mg/dl
¯ LDL < 100 mg/dl
¯ HDL (>40 mg/dl) in men
¯ HDL (>50 mg/dl) in women
¯ Triglycerides < 150 ml/dl
¯ ADA recommends an LDL level of <70 mg/dl in those with cardiovascular disease.
Others
Blood is drawn from each patient under recommended ideal
conditions to determine the fasting and postprandial Blood sugar, urea,
serum creatinine and Lipid profile.
Statistical Analysis
Statistical Analysis of data was done by using the software –
Statistical Packages for Social Sciences (SPSS version 13.0) developed
RESULTS AND OBSERVATIONS
TABLE - 1
CHARACTERISTICS OF THE STUDY POPULATION
S. No CHARACTERISTICS RANGE MEAN S.D.
1. AGE 35-65 56.1 8.877
2. BMI 16-35 2.13 0.0719
3. WAIST HIPRATIO
MALES 0.78-1.0
FEMALES 0.78-1.0
TOTAL 1.64 0.04842
4. FASTING BLOOD SUGAR 90-360 1.93 0.06397
5. POSTPRANDIAL BLOOD
SUGAR 190-500 2.39 0.06948
6. TOTAL CHOLESTEROL 150-290 1.49 0.05024
7. TGL 40-350 1.48 0.05021
8. HDL 25-90 1.43 0.04976
9. LDL 60-210 1.76 0.04292
10. VLDL 10-140 32.46 2.095
11. BP:
SYSTOLIC 100-170 127.18 2.078
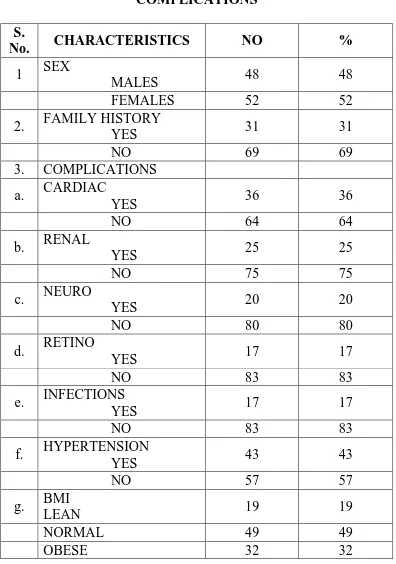
TABLE – 2
COMPLICATIONS
S.
No. CHARACTERISTICS NO %
1 SEX
MALES 48 48
FEMALES 52 52
2. FAMILY HISTORY
YES 31 31
NO 69 69
3. COMPLICATIONS
a. CARDIAC
YES 36 36
NO 64 64
b. RENAL
YES 25 25
NO 75 75
c. NEURO
YES 20 20
NO 80 80
d. RETINO
YES 17 17
NO 83 83
e. INFECTIONS
YES 17 17
NO 83 83
f. HYPERTENSION
YES 43 43
NO 57 57
g. BMI
LEAN 19 19
NORMAL 49 49
TABLE – 3
AGE AND BMI
LEAN NORMAL OBESE
AGE GROUP
No. % No % No %
< 40 Yrs - - 4 44.4 5 55.6
41- 50Yrs
2 14.3 8 57.1 4 28.6
51- 60Yrs
12 24.5 24 48.9 13 26.5
> 60Yrs 5 17.8 13 46.4 10 35.7
TOTAL 19 49 32
AGE & BMI 9 14 51 23 3 0 10 20 30 40 50 60 70 80 90 100
<40 41-50 51-60 61-70 >70
Age P e rc e n ta ge
SEX AND BMI
TYPE
LEAN NORMAL OBSES
SEX
NO % NO % NO %
MALE 8 16.6 22 45.8 18 37.5
FEMALE 11 21.2 27 51.9 14 26.9
TOTAL 19 49 32
SEX AND BMI
8 11
22 27
18
14
0 10 20 30 40 50 60 70 80 90 100
T
y
pe
Lean Normal Obese
Sex
FAMILY HISTORY AND BMI
LEAN NORMAL OBSE
FAMILY HISTORY
NO % NO % NO %
YES 3 9.6 11 35.4 17 54.8
NO 16 23.1 38 55.1 15 21.7
TOTAL 19 49 32
Statistically significant at 0.01 level.
FAMILY HISTORY AND BMI 3 11 17 16 38 15 0 5 10 15 20 25 30 35 40
Lean Normal Obese
WAIST HIP RATIO AND BMI
LEAN NORMAL OBESE
WHR
NO % NO % NO %
NORMAL 11 30.5 22 61.1 3 8.3
ABNORMAL 8 12.5 27 42.2 29 45.3
TOTAL 19 49 32
There is statistically significant relationship between WHR and BMI.
WAIST HIP RATIO AND BMI 11 8 22 27 3 29 0 5 10 15 20 25 30 W a is t H ip R a tio
Lean Normal Obese
WHR
FASTING BLOOD SUGAR AND BMI
LEAN NORMAL OBESE
FASTING BLOOD
SUGAR NO % NO % NO %
NORMAL 4 16.7 9 37.5 11 45.8
ABNORMAL 15 19.7 40 52.6 21 27.6
TOTAL 19 49 32
There is statistically significant relationship between Fasting blood sugar
and BMI.
FASTING BLOOD SUGAR AND BMI 4 5 10 9 32 8 11 17 4 0 5 10 15 20 25 30 35 F as ti ng Bl ood S u g ar
Leam Normal Obese
BMI
POST PRANDIAL BLOOD SUGAR AND BMI
LEAN NORMAL OBESE
PP BLOOD SUGAR
NO % NO % NO %
NORMAL 1 8.3 6 50.0 5 41.6
ABNORMAL 18 20.5 43 48.9 27 30.7
TOTAL 19 49 32
POST PRANDIAL BLOOD SUGAR AND BMI
1 6 5
18
43 27
0 10 20 30 40 50
Lean Normal Obese
BMI
Post parandial blood sugar
LIPID PROFILE AND BMI
LEAN NORMAL OBESE
TOTAL CHOLESTEROL
NO % NO % NO %
NORMAL 16 31.4 25 49.0 10 19.6
ABNORMAL 3 6.1 24 48.9 22 44.9
TOTAL 19 49 32
There is statistically significant relationship between total cholesterol and
BMI.
LIPID PROFILE AND BMI
16
3
25 24
10 22
0 5 10 15 20 25
To
ta
l
C
ho
leste
rol
Lean Normal Obese
BMI
TGL AND BMI
LEAN NORMAL OBESE
TGL
NO % NO % NO %
NORMAL 16 32.0 27 54.0 20 40.0
ABNORMAL 3 6.0 22 44.0 12 24.0
TOTAL 19 49 32
There is statistically significant relationship between TGL and BMI.
TGL AND BMI
16
3
22
20
12
0 5 10 15 20 25
T
GL
Lean Normal Obese
BMI
HDL AND BMI
LEAN NORMAL OBESE
HDL
NO % NO % NO %
NORMAL 12 26.1 22 47.8 12 26.1
ABNORMAL 7 12.9 27 50.0 20 37.0
TOTAL 19 49 32
There is statistically significant relationship between HDL and BMI.
HDL AND BMI
14
7
22 27
12 20
0 5 10 15 20 25 30
HDL
Lean Normal Obese
BMI
LDL AND BMI
LEAN NORMAL OBESE
LDL
NO % NO % NO %
NORMAL 12 50.0 8 33.3 4 16.7
ABNORMAL 7 9.2 41 53.9 28 36.8
TOTAL 19 49 32
There is statistically significant relationship between LDL andBMI.
LDL AND BMI
12
7
8 41
4 28
0 5 10 15 20 25 30 35 40 45
L
DL
Lean Normal Obese
BMI
COMPLICATIONS AND BMI
COMPLICATIONS
CARDIAC RENAL HYPERTENSION
YES NO YES NO YES NO
BMI
NO % NO % NO % NO % NO % NO %
L 3 8.3 16 25.0 6 24.0 13 17.3 2 4.6 17 29.8
N 18 50.0 31 48.4 11 44.0 38 50.7 19 44.2 30 52.6
O 15 41.7 17 26.6 8 32.0 24 32.0 22 51.2 10 17.5
BMI AND CARIDO VASCULAR COMPLICATION
3
18
15 16
31
17
0 5 10 15 20 25 30 35
Lean Normal Obese
BMI
C
a
rd
iac
BMI AND RENAL COMPLICATION
6
11
8 13
38
24
0 5 10 15 20 25 30 35 40
Lean Normal Obese
BMI
Re
n
al
BMI AND HYPERTENSION
2
19 22
17
30 10
0 5 10 15 20 25 30 35
Lean Normal Obese
B
MI
Hypertension
COMPLICATIONS AND BMI
COMPLICATIONS
NEUROPATHY RETINOPATHY NFECTIONS
YES NO YES NO YES NO
BMI
NO % NO % NO % NO % NO % NO %
L 10 45.5 9 11.3 6 35.2 13 15.6 9 52.9 10 13.7
N 6 27.2 43 53.8 7 41.1 42 50.6 5 29.4 44 60.2
O 4 18.1 28 35.0 4 23.5 28 33.7 3 17.6 29 39.7
BMI AND NEUROPATHY 10 9 6 43 4 28 0 5 10 15 20 25 30 35 40 45 N e u ro
Lean Normal Obese
BM I
BMI AND INFECTIONS
9 10
5 44
3 29
0 5 10 15 20 25 30 35 40 45
In
fec
ti
ons
Lean Normal Obese
BMI
BMI AND RETINOPATHY 7 12 6 43 4 28 0 5 10 15 20 25 30 35 40 45 R e ti nop at hy
Lean Normal Obese
BMI
DISCUSSION
and
analysis
of
DISCUSSION AND ANALYSIS OF RESULTS
"Diabetes Mellitus" is an age old affliction of man and is the most
common metabolic disorder all over the world. The incidence of Diabetes
is showing alarming rise in developing countries, particularly. In India.
India3 is known as the Diabetic capital of the world. Most of the diabetics
in developed countries are obese.
However in India we have a significant number of diabetics who
are either normal weight or even under weight4. Even though obesity is
considered as part of Syndrome X in the pathogenesis of type 2 diabetes,
in our study, out of 100 patients only32 patients were obese. Our study
included hundred patients. Among 100 patients, 48 are males and 52 are
females. In our study majority of patients, that is 49 patients (49%)
belong to normal weight, 32 patients (32%) belong to obese and 19
patients (19%) belong to lean body weight.
1. Age
In our study, we found there is no particular age group for lean
diabetics. But 24.5% of lean diabetics belong to 51-60 years of age,
2. Sex
There is statistically significant relationship exist in our study
between sex and BMI. Slightly higher incidence of female in lean body
weight (21.2%) and in normal body weight (51.9%) was observed. In
obese there is male preponderance (37.5%)
3. Family History
Family history of diabetes is present only in 9.6% of lean diabetics,
in comparison to 35.4% in normal and 54.8% in obese diabetics. So there
is lesser incidence of family history among the lean diabetics.
4. Waist Hip Ratio and BMI
There is a linear increase in number of patients having abnormal.
Waist Hip ratio with increase in BMI. Among 100 patients studied, 64
patients have abnormal Waist Hip ratio. Among that it is 12.5% in lean,
42.2% in normal and 45.3% in obese type 2 diabetics. Eventhough 19%
(19) of diabetics patients are lean based on BMI, 8 among them have
abnormal Waist hip ratio. So, Waist hip ratio is a better indicator than
5. Complication
Microvascular complications
Among the microvascular complications neuropathy (45.5%),
Retinopathy (35.2%) are common in lean diabetics in our study which
are statistically significant. Only 24% of lean diabetics had nephropathy,
which is not statistically significant. In normal weight group, incidence of
neuropathy, retinopathy and nephropathy are 27.2%, 41.1% and 44%
respectively. In obese patients, incidence of neuropathy, retinopathy and
nephropathy are 18.1%, 23.5% and 32%respectively.
Macrovascular Complications
Lean diabetics are less prone to develop macrovascular
complications – like hypertension and Ischemic Heart Disease. Incidence
of hypertension is 4.6% in lean patients as compared to 44.2% in normal
and 51.2%% in obese diabetics. Like wise cardiac complications are low
in lean diabetics (8.3%)as compared to 50% in normal and 41.7%in obese
diabetics.
Infections
In our study, 52.9% of lean patients with type 2 diabetes presented
patients. Values are statistically significant- p value < 0.001.Majority of
the lean diabetics in our study group presented with infections.
Glycemic Control
Lean diabetics have more severe hyperglycemia with poor
metabolic control. Lean persons have higher fasting blood sugar levels
than obese and normal weight type 2 diabetes patients. Similarly post
prandial values were also high in lean type 2 DM patients. This has been
explained by probable low beta cell reserve among lean diabetics. So,
Lean diabetics are insulinopenic and highly insulin sensitive.
Lipid Profile
Regarding lipid profile of lean type 2 diabetes patients, all the
parameters were lower in lean diabetics compared to all other groups.
Moreover, lean diabetics have slightly higher HDL value as compared to
normal and obese diabetics, which is statistically significant. Also free
cholesterol value in lean diabetics are not as high as compared to obese
patients. So, lean diabetics have favorable lipid profile as compared to
normal and obese diabetics.
In contrast to the previous studies, in our study the triglyceride
Our study has limitations, as it was hospital based in the tertiary
care setting. Incidence of complications might be higher compared to
general population or primary care setting. We did not do HbA1C, insulin
level assay, C peptide levels and GAD antibodies in our lean diabetics
due to financial constraints. In conclusion, type 2 diabetic patients need
not always be obese. Majority (49%) belong to normal weight and
significant number (19%) of patients are even lean in our study. Thus,
lean body type 2 DM patients appear to be a distinct variety and a great
deal of emphasis is to be given on its clinical/biochemical profile and
COMPARATIVE ANALYSIS
Our study includes 100 patients with type 2 diabetes. Among them
normal weight (49%), obese patients (32%) and lean type 2diabetics
(19%) were identified.
But the study
i) Conducted at Manipal by Prabhu Mukhyaprana and Sudha
Vidyasagar included 500 type 2 diabetic patients between
July 2000 and January 2001.
ii) The study conducted by Gohel Dr. Desai VK at M.P. Shah
Medical College, Jamnagar, published in JAPI, Dec 2003
included 75 patients with Type 2 Diabetes Mellitus.
1. Percentage of Lean Body Weight Type 2 DM Population
In our study, Lean Type 2 DM was observed in 19%, as compared
to 49% of normal and 32% of obese patients. Study conducted (by
Mukhyaprana et al) lean were 7.4% and majority (65%) were of normal
weight. Incidence of lean body weight – Diabetes in various Indian
studies ranges from 1.6% as in Ramachandran et al. study to as high as
28% as in Tripathi et al.
2. Age Group
In our study there is no statistically significant relationship between
age and BMI observed.
i) But study conducted by Prabhu et al, mean age of onset of
diabetes in lean were 60.34 + 13.5 years.
ii) In Gohel DR. et al study it was between 30-40 years.
3. Sex
In our study, lean type 2 Diabetes patients were slightly higher in
female sex (21.2%) which was statistically significant.
i) Study conducted by Prabhu Mukhyaprana M et al observed
most lean type 2 DM were males (65% of total lean) type 2
DM which was statistically not significant.
4. Family History
Positive family history was present only in 9.6% of patients with
lean body weight type 2 DM as compared to 35.4% in normal weightand
54.8% in obese patients with type 2 DM which were
statisticallysignificant.
i) Study conducted by Prabhu Mukhyaprana et al observed
body weight diabetics, results were similar to studies by –
Banerji et al and Kannan et al studies.
ii) Study conducted by Gohel DR et al observed low incidence
of positive family history (20%) in lean as compared to 40%
in normal and 44% in obese patients.
5. BMI and WHR – Are they related?
In our study 12.5% of lean diabetes had abnormal Waist Hip Ratio
as compared to 42.2%% in normal and 45.3% in obese patients. Waist
Hip Ratio had a statistically significant ('p' – 0.001). Relationship with
BMI. Previous study conducted at Manipal observed 48% of lean
diabetics had abnormal Waist Hip Ratio, stating that significant number
of lean diabetics (48%) had abnormal Waist Hip Ratio. The Waist Hip
Ratio may thus be a more sensitive indicator of obesity in Indians25,27.
7. Glycemic Status
In our study, significant proportion of lean persons had higher
fasting blood sugar levels than obese patients with Type 2 Diabetes,
which was statistically significant (p = -0.112) as compared to normal and
i) Results were similar to studies done by Kannan et al and
Italian Study by Pointoroly et al. This has been explained
based on low – beta cell reserve in these patients.
ii) Similar results were also observed in study conducted by
Prabhu Mukyaprana et al. Fasting blood sugar was
177.08+105.1.
iii) Postprandial blood sugar values in Lean type 2 DM patients
were higher, even though statistically not significant.
8. Lipid Profile
Analysis of lipid profile in our study showed interesting results.
Type 2 lean diabetics, had lower incidence of dyslipidemia as compared
to all other groups, even though only HDL relationship with BMI was
statistically significant. In our study HDL values were slightly higher in
lean Diabetics, as compared to normal and obese patients which was
statistically significant (p 0.012). Also free cholesterol value in lean
diabetics were high as compared to normal weight and obese patients.
Triglyceride values in lean diabetics were not very high as compared to
normal and obese diabetics. Previous studies by Banerji et al and Das et
Japanese study by Ikeda et al showed no major differences in lipid profile
in lean diabetics, irrespective of glycemic status.
9. Complications
In our study, increased incidence of microvascular complications
like neuropathy, retinopathy were observed in lean diabetics which is
statistically significant. 47.3% of lean patients had neuropathy as a
presenting feature as compared to 31.5% in normal and 21.1% in obese
patients with a 'p' value of 0.010 (significant). Retinopathy also increased
in lean type 2 Diabetics with 35.2% in lean, 41.1%in normal and 23.5%
in obese patients though it is not statistically significant. In our study
nephropathy was observed only in 24% of lean patients as compared to
44%in normal and 32% of obese type 2 diabetics, which is not
statistically significant. Study conducted at Manipal showed
microvascular complications were similar in all the 3 groups.
Macrovascular complications like HT, IHD were less in lean17 diabetics
as compared to other groups. In our study, the incidence of hypertension
was 4.6% in lean as compared to 44.2% in Normal and 51.2 % in Obese.
Incidence of IHD was low in the lean as compared to normal and Obese.
study. In Manipal study the incidence of IHD was only 2.7% among lean
and HT in 16.7% of lean diabetics.
Infections
In our study 52.9% of lean patients with type 2 diabetes presented
with infections as compared to 29.4% in normal and 17.6%in obese
patients. Values were specifically significant also. (‘p’ value = < 0.001).
Mohan et al14 reported increased prevalence of retinopathy, neuropathy
and nephropathy in lean diabetics. Peripheral neuropathy was the
commonest presenting complication among lean diabetics in a study by
Das et al. Peripheral neuropathy and infections were the commonest
presenting clinical features in lean diabetics observed in study conducted
SUMMARY
ª Total Number of patients studied – 100. Out of 100 patients, 48 were males and remaining 52 were females.
ª Number of lean type 2 DM Patients were 19. Among them 44% were Males and 56% were Females.
ª Number of normal weight type 2 diabetics were 49. Among them 45% were males and 55% were females.
ª Number of obese type 2 diabetics patients were 32. Among them 56% were males and 44% were females.
ª Most of diabetics in our population (52%) had normal body weight. Lean type 2 Diabetics form a significant number (19%).
ª Low incidence of positive family history in lean type 2 diabetics (9.6%) was observed.
ª Peripheral neuropathy (47.3%), Retinopathy (35.2%) and infections (52.9%%) were the major presenting clinical
complications in lean diabetics.
ª Most risk factors of atherosclerosis and CAD are less prevalent in lean type 2 diabetes (Normal HDL, and total cholesterol on lower
CONCLUSION
a. Majority of type 2 diabetes patients in our population are having
normal weight (49%) and lean body weight contributes to 19%
b. Lean diabetics have more severe hyperglycemia and poor
metabolic control. They are more prone for microvascular
complications like neuropathy and retinopathy.
c. Early treatment with insulin in lean type 2 diabetics is mandatory
to achieve good glycemic control and to prevent future
BIBLIOGRAPHY
1. Malnutrition and Diabetes in the Tropics. Report of the
International workshop on types of diabetes peculiar to the tropics.
Diabetes Care 1996; 19:1014-7.
2. Alberti KGMM, Zimmet PZ. Definition, diagnosis and
classification of diabetes mellitus and its complications. Part 1:
Diagnosis and classification of diabetes mellitus provisional report
of a WHO consultation. Diabet Med 1998;15:539-53.
3. Zimmet P et al: Global and Societal implications of the Diabetes
epidemic. Nature 414 : 782, 2009.
4. Das S. Low body weight NIDDM : An independent entity. In : Das
AK (ed) Medicine Update, Assoc Phys India, Mumbai, 1998;
595-602.
5. Weir GC, Leahy JL. Pathogenesis of non insulin dependent (Type
II) diabetes mellitus. In : Joslin's Diabetes Mellitus 13th edition.
Lea & Febiger : Philadelphia, PA, 1994Kanan K. Lean Type II
diabetes mellitus – a distinct entity. In : Kapur A (ed.) Proceedings
of the second Novo – Nordisk diabetes update. Health Care
6. Weir GC, Leahy JL. Pathogenesis of non insulin dependent (Type
II) diabetes mellitus. In : Joslin's Diabetes Mellitus 13th edition.
Lea & Febiger : Philadelphia, PA, 1994;242-3.
7. Kanan K. Lean Type II diabetes mellitus – a distinct entity. In :
Kapur A (ed.) Proceedings of the second Novo – Nordisk diabetes
update. Health Care Communication, Bombay, 1993' 147-151.
8. Nigam A. Clinical and epidemiological characteristics of NIDDM
patients with low body weight. Diabetes 1997;46(1):97A.
9. Das S, Tripathy BB, Samal KC, et al. Plasma lipids and lipoprotein
cholesterol in undernourished diabetic subjects and adults with
protein energy malnutrition. Diabetes Care 1984;7:579-86.
10. Das S, Lipid profiles – standards and interpretations. In : Kapur A
(ed) Proceedings of the Novo – Nordisk Diabetes update 1995.
Health Care Communication, Bombay 1995;107-15.
11. Bhatia E, Mohan V. Autoimmune Status and beta cell In. Low
Body Weight Type 2 Diabetes Mellitus, (Ed), Sidhartha Das,
Association of Physicians of India, Mumbai, 1999, 70-5.
12. Das S, Samal K.C, Baliarsinha A.K., Tripathy B.B., Lean
(Underweight) NIDDM pecularities and differences in metabolic
13. Das S, Reynolds T, Patnaik A, Rais N, Fink LM, Fonseca VA,
Plasama homocysteine concentrations in Type 2 diabetics in India:
relationship body weight. J Diabetes Complications.
1999:13(4):200-3.
14. Mohan V, Vijayaprabha R, Rema M, Premalatha G, Poongothai S,
Deepa et al Madras Diabetes Research Foundation, India. Clinical
profile of lean NIDDM in south India. Diabetes Res Clin Pract
1998 Aug ; 41(2):149-50.
15. Tripathy B B and Kar B C Observations and clinical patterns of
diabetes mellitus in India : Diabetes 1965; 14:404-12.
16. Das S. Introduction, Low body weight Type 2 Diabetes mellitus.
Technical series of Indian College of Physicians.
17. Das S. Diabetes, coronary artery disease and under nutrition, with
reference to plasma lipids and lipoprotein cholesterol. In. Ahuja
MMS, Rastogi SS, Singh RB (eds). Recent Advances in Nutriology
Vol.1. International College of Nutrition, Moradabad 1989 : 216 –
25.
18. Siddharth Das Low body weight Type 2 Diabetes Mellitus. Int J.
Diab. Dev Countries 2003 Vol 23.