Copyright © 1997, American Society for Microbiology
The Antiretrovirus Drug 3
9
-Azido-3
9
-Deoxythymidine Increases
the Retrovirus Mutation Rate
JOHN G. JULIAS,1,2THEODORE KIM,2GREGORY ARNOLD,2,3ANDVINAY K. PATHAK1,2*
Department of Biochemistry,1Mary Babb Randolph Cancer Center,2and Department of Biology,3
West Virginia University, Morgantown, West Virginia 26506
Received 8 November 1996/Accepted 21 February 1997
It was previously observed that the nucleoside analog 5-azacytidine increased the spleen necrosis virus (SNV) mutation rate 13-fold in one cycle of retrovirus replication (V. K. Pathak and H. M. Temin, J. Virol. 66:3093–3100, 1992). Based on this observation, we hypothesized that nucleoside analogs used as antiviral drugs may also increase retrovirus mutation rates. We sought to determine if 3*-azido-3*-deoxythymidine (AZT), the primary treatment for human immunodeficiency virus type 1 (HIV-1) infection, increases the retrovirus mutation rate. Two assays were used to determine the effects of AZT on retrovirus mutation rates. The strategy of the first assay involved measuring the in vivo rate of inactivation of the lacZ gene in one replication cycle of SNV- and murine leukemia virus-based retroviral vectors. We observed 7- and 10-fold increases in the SNV mutant frequency following treatment of target cells with 0.1 and 0.5mM AZT, respec-tively. The murine leukemia virus mutant frequency increased two- and threefold following treatment of target cells with 0.5 and 1.0mM AZT, respectively. The second assay used an SNV-based shuttle vector containing the
lacZagene. Proviruses were recovered as plasmids in Escherichia coli, and the rate of inactivation of lacZawas measured. The results indicated that treatment of target cells increased the overall mutation rate two- to threefold. DNA sequence analysis of mutant proviruses indicated that AZT increased both the deletion and substitution rates. These results suggest that AZT treatment of HIV-1 infection may increase the degree of viral variation and alter virus evolution or pathogenesis.
Retrovirus populations demonstrate high levels of variation (3, 49). Genetic variation in retrovirus populations depends on the mutation and recombination rates per replication cycle, the replication rate (replication cycles/time), and the selective forces that act on the population (4–6, 17, 32, 33, 39–41). Recent studies of human immunodeficiency virus type 1
(HIV-1) dynamics in vivo suggest that approximately 104to 105
mutations arise at each nucleotide position every day in an HIV-1-infected patient (5, 16, 54). The enormous degree of variation present in each HIV-1-infected individual has frus-trated efforts to develop vaccines (8).
HIV-1 variation is associated with a number of clinically
significant observations. Drug resistance to 39-azido-39
-deoxy-thymidine (AZT), (2) 29-deoxy-39thiacytidine (3TC), 29,39
-dideoxycytidine, and 29,39-dideoxyinosine monotherapy or
combination therapy is associated with specific mutations in the virally encoded reverse transcriptase (RT) (9, 15, 28, 47, 48, 50). Accumulation of the specific mutations results in the out-growth of drug-resistant virus refractory to the effects of the antiviral drugs (27). Once drug-resistant HIV-1 arises in the patient, virus loads can increase in the presence of the drug, causing an increased risk of clinical progression to AIDS (18). Resistance to drugs targeting other viral enzymes such as pro-tease is also conferred by specific mutations in HIV-1 (7, 43). Additionally, HIV-1 cell tropism is associated with variation in the virus envelope, since specific mutations in the V3 loop of the envelope protein can confer the ability to infect T cells or macrophages (36). Thus, variation in HIV-1 populations plays a critical role in the course of the disease and treatment.
One important source of mutations in retrovirus genomes is
the error-prone polymerization by RT (1, 19, 32, 33, 39–41, 44, 45, 49). RT lacks exonucleolytic proofreading; consequently, the fidelity of RT is low because the accuracy of polymerization depends solely on the discrimination of incoming nucleotides. Two host cell polymerases could also introduce mutations in retrovirus genomes. First, the host cell DNA polymerases that replicate the provirus through each cell division may introduce
mutations in the virus genomes, but their error rate is 105- to
106-fold lower than that for RT, and so their contributions to
retrovirus mutation rates are negligible (13, 23). Second, the host cell RNA polymerase II, which transcribes the provirus, may generate mutations in the retrovirus genomic RNA. Al-though evidence exists for proofreading during transcription by RNA polymerase in prokaryotes (29), the error rate of the eukaryotic RNA polymerase II has not been measured, and its contribution to the retrovirus mutation rate remains unknown. The in vivo forward mutation rate for a single replication cycle was first determined for spleen necrosis virus (SNV) (40, 41). Subsequently, the in vivo forward mutation rates have been measured for the bovine leukemia virus (32), HIV-1 (33), and Moloney murine leukemia virus (MLV) (39). In these studies, the retrovirus mutation rates for a single replication
cycle have ranged from 0.483105to 3.431025/bp/replication
cycle.
Previously, it was shown that the nucleoside analog 5-azacy-tidine increased the retrovirus mutation rate 13-fold in a single cycle of retrovirus replication (42). The results suggested that 5-azacytidine increased retrovirus mutation rates through in-corporation into RNA or DNA; alternatively, secondary effects on nucleotide pools may have increased the error rate. Based on these observations, we hypothesized that nucleoside ana-logs used as antiviral drugs may increase retrovirus mutation rates by disturbing nucleotide pools. We sought to determine the effects of the dideoxynucleoside analog AZT, the primary antiviral drug used for treatment of HIV-1 infection, on
ret-* Corresponding author. Mailing address: Department of Biochem-istry, Mary Babb Randolph Cancer Center, West Virginia University, Morgantown, WV 26506. Phone: (304) 293-5949. Fax: (304) 293-4667. E-mail: VPATHAK@WVUMBRCC1.hsc.wvu.edu.
4254
on November 9, 2019 by guest
http://jvi.asm.org/
rovirus mutation rates in a single retrovirus replication cycle. Two different assays were used to examine the effects of AZT on in vivo retrovirus mutation frequencies. These assays used SNV- or MLV-based retrovirus vectors encoding two
muta-tional target genes (lacZ and lacZa) and a drug resistance gene
for selection of infected cells. Following infection, selected cells were analyzed for mutant phenotypes. The rates of inac-tivation of either of the mutational target genes were deter-mined as an indicator of the retrovirus mutation rate in a single cycle of retrovirus replication. These experiments demonstrate that the antiretroviral drug AZT increases the retrovirus mu-tation rates of SNV and MLV.
MATERIALS AND METHODS
Plasmid construction.Standard molecular cloning procedures were used for construction of retrovirus vectors (46). SNV-based retrovirus vector pLW-1 was derived from pWH450 (gift from W.-S. Hu). pWH450 contains the long terminal repeats (LTRs), E site, primer binding site, and polypurine tract from SNV. An internal ribosomal entry site (IRES), present upstream of the hygromycin phos-photransferase B gene (hygro), allows the expression of hygro (14). pWH450 was digested with SmaI and then treated with calf intestinal phosphatase. The lacZ gene was inserted into this site as a blunt-ended 3.5-kb NotI-HindIII fragment from plasmid pSVb(Clontech). MLV-based retrovirus vector pGA-1 was de-rived from pWH390 (gift from W.-S. Hu). pWH390 was generated by digesting pLAEN, an MLV-based retrovirus vector, with EcoRI, resulting in the deletion of the adenosine deaminase gene (gift from A. D. Miller). pWH390 contains the LTRs,csite, primer binding site, and polypurine tract from MLV. Additionally, an IRES is present upstream of the neomycin phosphotransferase gene (neo) from Tn5 (20). pWH390 was digested with EcoRI and treated with Klenow enzyme and calf intestinal phosphatase. The lacZ gene was inserted as a blunt-ended 3.5-kb NotI fragment from pSVb(Clontech). SNV-based retrovirus vector plasmid BK-2 was derived from vector VP254. Both of these vectors have been previously described (22, 42). Briefly, BK-2 contains the SNV cis-acting ele-ments. The promoter in the LTR expresses the hygro gene. The neo gene is present and is expressed only in bacterial cells from a prokaryotic promoter. The pBR origin of replication allows BK-2 to replicate as a plasmid in bacteria. lacZa
is present in the 39LTR and is expressed only in bacterial cells. A detailed description of all cloning steps is available upon request.
Cells, transfections, and infections.D17 and C3A2 cells (obtained from the American Type Culture Collection) were maintained in Dulbecco’s modified Eagle’s medium (ICN) supplemented with 6% bovine calf serum (HyClone Laboratories), penicillin (50 U/ml; Gibco), and streptomycin (50mg/ml; Gibco). D17 is a dog osteosarcoma cell line that can be infected with SNV. C3A2 and DSDh are D17-derived reticuloendotheliosis virus-based helper lines that can be used to package SNV (17, 53). Hygromycin B (Calbiochem) was present in the media at a final concentration of 120mg/ml (0.23 mM) for DSDh, C3A2, and D17 cells. DSDh and C3A2-derived helper cells were propagated in the presence of polyclonal anti-SNV antibodies. The antibodies were generated at the Uni-versity of Wisconsin by infecting young chickens with reticuloendotheliosis virus. These antibodies have been used previously to suppress SNV reinfection (17, 22, 40–42). PG13 and PA317 cells (American Type Culture Collection) are MLV-based helper cell lines. PG13 and PA317 cells were maintained in Dulbecco’s modified Eagle’s medium supplemented with 10% bovine calf serum, penicillin (50 U/ml), and streptomycin (50mg/ml). G418 was present at final concentrations of 600mg/ml (0.79 mM) and 400mg/ml (0.53 mM) in the media for PG13 and PA317 cells, respectively.
Helper cell clones producing LW-1, GA-1, and BK-2 viruses were derived by infecting fresh helper cells at a low multiplicities of infection (,0.00005). There-fore, the probability of obtaining cell clones with more than one provirus was less than 0.0005.
Cells were transfected by the previously described dimethyl sulfoxide-Poly-brene method (21). D17 cells were plated at densities of 2 3105cells on 60-mm-diameter plates or 106cells on 100-mm-diameter plates and subsequently infected with viruses. Twenty-four hours later, cells plated on 60-mm-diameter dishes were infected with 0.2 ml of virus and cells plated on 100-mm-diameter dishes were infected with 1 or 2 ml of virus by using Polybrene (50mg/ml [final concentration]) as previously described (17). Infections using LW-1 or GA-1 were performed for 1 h with 1 ml of virus. Infections using BK-2 were performed for 4 h with 2 ml of virus. Transfected or infected cells were subjected to G418 or hygromycin selection 24 h later.
Staining LW-1 or GA-1 cells forb-galactosidase activity.Cells containing LW-1 or GA-1 were stained with 5-bromo-4-chloro-3-indolyl-b -D-galactopyrano-side (X-Gal) 14 days after selection was initiated, using previously described protocols (2). Briefly, following selection of cells containing LW-1 or GA-1, cells were fixed by using 1 ml of 0.05% glutaraldehyde in phosphate-buffered saline for 10 min at room temperature. The cells were rinsed three times with 4 ml of phosphate-buffered saline; the first rinse was for 1 min, the second rinse was for 10 min, and the final rinse was for 1 min. After the final rinse was removed, 1.25
ml of a solution containing 20 mM K3Fe(CN)6(Sigma), 20 mM K4Fe(CN)6 (Sigma), 1.5 mM MgCl2(Fisher), and 1 mg of X-Gal (American Bioinorganics, Inc.) per ml was added to the plates. The plates were then sealed with Parafilm and incubated at 37°C for 24 h. The numbers of blue and white colonies were determined by viewing the cells under a light microscope at a magnification of
340.
Recovery, restriction mapping, and DNA sequencing analysis of proviruses.
Proviruses derived from infection of D17 cells with BK-2 were recovered by using the previously described Lac repressor protein-mediated affinity purification (22, 40). Transformed ElectroMax DH10B bacterial cells (Bethesda Research Lab-oratories/Life Technologies) had either blue, light blue, or white mutant colony phenotypes. Recovered mutant proviruses were analyzed by restriction diges-tions, gel electrophoresis, and DNA sequencing. Plasmid DNA sequencing was performed by using either a Sequenase kit and protocols (United States Bio-chemical) or AutoRead sequencing reactions and A.L.F. Express sequence anal-ysis (Pharmacia).
RESULTS
A rapid in vivo assay to determine the effects of AZT on SNV and MLV mutant frequencies.A rapid in vivo assay was de-veloped to measure the effects of antiretrovirus drugs on SNV and MLV mutant frequencies. The assay used the bacterial
b-galactosidase gene (lacZ) as a reporter of mutations. An
SNV-based retrovirus vector (LW-1) and an MLV-based ret-rovirus vector (GA-1) were constructed (Fig. 1A). Both vectors express the lacZ gene from the LTR promoter and a drug resistance gene from the IRES. The general strategy was to allow LW-1 and GA-1 to undergo one round of retrovirus replication, select for drug-resistant cell clones, and then
de-termine the rate of inactivation of lacZ.b-Galactosidase
activ-ity in infected cells can be easily assayed by staining with X-Gal. In the presence of X-Gal, cells containing phenotypi-cally wild-type LW-1 or GA-1 provirus express a functional
b-galactosidase and stain blue; cells containing LW-1 or GA-1
provirus with inactivating mutations in lacZ fail to stain and appear white.
Experimental protocol used to determine the effects of AZT on retrovirus mutant frequencies.Helper cell clones produc-ing LW-1 were established by first transfectproduc-ing DSDh or C3A2 helper cells with pLW-1 (Fig. 1B). Viruses were harvested from these helper cells and used to infect fresh DSDh or C3A2 helper cells. After hygromycin selection, individual drug-resis-tant cell clones were isolated and expanded in the presence of anti-SNV antibodies to suppress reinfection of the virus-pro-ducing cells. The LW-1 vector was introduced into the helper cells by infection to avoid any mutations that may have oc-curred during transfection. In addition, helper cell clones were stained with X-Gal to verify that the lacZ gene was functionally active (data not shown).
A similar procedure was used to establish helper cell clones producing GA-1 virus. First, PA317 helper cells were trans-fected with pGA-1 (Fig. 1B). Viruses were harvested from the PA317 helper cells and used to infect PG13 helper cells. After selection for G418 resistance, individual cell clones were iso-lated and expanded. PG13 cells package vector RNA with gibbon ape leukemia virus envelope. PG13 cells are derived from mouse fibroblasts which do not express the receptor for the gibbon ape leukemia virus envelope; therefore, these virus-producing cells cannot reinfect themselves (37).
Next, a single cycle of retrovirus replication was carried out by harvesting virus from either the LW-1 or the GA-1 helper cell clones and infecting D17 target cells. The effects of AZT on the retrovirus mutant frequencies were determined by treating virus-producing cells or target cells with AZT and analyzing infected cells for inactivation of lacZ. Pretreatment refers to maintaining the helper cells in medium supplemented with AZT for 24 h before harvesting virus. AZT pretreatment could alter retrovirus mutation rates by affecting the accuracy
on November 9, 2019 by guest
http://jvi.asm.org/
of transcription of the provirus into RNA. Posttreatment refers to maintaining D17 target cells in media supplemented with various concentrations of AZT for 3 h before infection as well as 24 h after infection. Posttreatment with AZT may affect the mutation rate during only reverse transcription. These treat-ment times were used to ensure that AZT was present in the helper cells during transcription of the provirus into RNA in
the pretreated cells and during the process of reverse tran-scription in the posttreated cells. Pre- plus posttreatment refers to maintaining both the helper cells and the target cells in medium supplemented with AZT. After drug selection, D17 cell colonies were stained with X-Gal. The numbers of blue and white colonies were determined 24 h after staining. The forward mutant frequency was calculated as the ratio of white colonies to the total number of colonies.
AZT increases the SNV mutant frequency in a dose-depen-dent manner.To determine whether AZT increases the retro-virus mutant frequency, a rapid in vivo assay was performed. C3A2 and DSDh helper cell clones producing LW-1 viruses were used. Viruses were harvested and used to infect D17
target cells in the presence of 0 to 0.50mM AZT. The infected
D17 cells were selected for hygromycin resistance, and the mutant frequencies were determined. Analysis of one DSDh
helper cell clone (P1C1d) and two C3A2 helper cell clones
(P1C1 and P5C1) is shown in Table 1. In the absence of AZT treatment, a mutant frequency of 0.05 (102 of 2,149) was
ob-served. Posttreatment with 0.01 and 0.05mM AZT resulted in
mutant frequencies of 0.03 (28 of 915) and 0.07 (19 of 256), respectively. These mutant frequencies were similar to the control mutant frequency. In contrast, posttreatment with 0.10
and 0.50mM AZT resulted in significantly higher mutant
fre-quencies of 0.34 (742 of 2,188) and 0.51 (981 of 1,941), respec-tively. These mutant frequencies were 7-fold higher after 0.1
mM AZT treatment and 10-fold higher after 0.5 mM AZT
treatment than the control mutant frequencies (P ,0.0001).
[image:3.612.78.277.67.431.2]These results indicated that the presence of AZT during re-verse transcription increased the SNV mutant frequency in a
FIG. 1. Rapid in vivo assay to determine the effects of AZT on retrovirus mutation rates. (A) SNV-based retrovirus vector LW-1 and MLV-based retro-virus vector GA-1. White boxes, SNV LTRs; black boxes, MLV LTRs. LW-1 contains the LTRs and cis-acting elements from SNV. LW-1 transcribes the E.
coli lacZ gene and the hygro gene from the promoter in the LTR. The hygro gene
[image:3.612.317.554.413.612.2]is expressed from the IRES of encephalomyocarditis virus. GA-1 contains the LTRs and cis-acting elements from MLV. GA-1 transcribes the lacZ gene and the neo gene from the promoter in the LTR. The neo gene is expressed from the IRES. (B) Experimental protocol. Helper cell clones producing LW-1 or GA-1 (DSDh or C3A2 for LW-1 and PG13 for GA-1) were generated by transfecting LW-1 or GA-1 plasmid DNA into helper cells, harvesting viruses, and infecting fresh helper cells. Following drug selection of cells infected with LW-1 or GA-1, individual colonies were isolated and expanded. Pretreatment is defined as main-taining virus-producing helper cells in 0.1mM AZT supplemented medium for 24 h before harvesting virus. Posttreatment is defined as maintaining target cells in medium supplemented with various concentrations of AZT for 3 h before and 24 h following infection. Pre- plus posttreatment refers to performing both treatments in the same experimental groups. Proviral sequences are shown in the helper cell and target cell as boxes connected by a line; the zigzag lines represent host cell DNA. After hygromycin or G418 selection of infected cells, the drug-resistant colonies were stained with X-Gal and analyzed forb -galactosidase-deficient phenotype. The numbers of blue (wild-type) and white (mutant) colo-nies were determined, and the forward mutant frequency was calculated as the ratio of white to total (blue plus white) colonies.
TABLE 1. Effects of AZT posttreatment on inactivation of the lacZ gene in LW-1-infected cells AZT
concn (mM)
LW-1 helper cell clone
No. of total colonies
No. of mutant colonies
Relative virus titera
Mutant frequencyb
Relative mutant frequencyc
0.00 P1C1d 639 18 0.03
P1C1 926 47 0.05
P5C1 584 37 0.06
Total 2,149 102 1 0.05 1
0.01 P1C1d 915 28 0.7 0.03 1
0.05 P1C1d 256 19 0.2 0.07 1
0.10 P1C1d 117 26 0.22
P1C1 1,291 451 0.35
P5C1 780 265 0.34
Total 2,188 742 0.1 0.34 7
0.50 P1C1d 188 64 0.34
P1C1 546 297 0.54
P5C1 1,207 620 0.51
Total 1,941 981 0.01 0.51 10
aVirus titers for each experimental group were determined by serial dilution
and infection. The relative virus titer represents a ratio of the viral titer of the treatment groups to the viral titer of the untreated group. The viral titer of the untreated group was 9.83104CFU/ml (average of three independent experi-ments).
bRatio of mutant colonies to total colonies.
cRatio of the mutant frequency of the treatment group to the mutant
fre-quency of the untreated group. Statistical analysis of Fisher’s least significant difference showed that the mutant frequencies after 0.1 and 0.5mM AZT post-treatments were statistically different from the mutant frequency in the no-AZT treatment control (P,0.0001). The mutant frequencies observed after 0.1 or 0.5
mM AZT posttreatments were also statistically different (P50.01).
dDSDh-derived helper cell clone. All other experiments were performed with
C3A2-derived helper cell clones.
on November 9, 2019 by guest
http://jvi.asm.org/
dose-dependent manner. After 0.01 and 0.05 mM AZT post-treatments, the relative virus titers were reduced to 0.7 and 0.2
in comparison to control virus titers. After 0.10 and 0.50mM
AZT posttreatments, relative virus titers were decreased to 0.10 and 0.01 in comparison to control virus titers. Thus, con-centrations of AZT that reduced the virus titer 90 and 99% substantially increased the mutant frequencies 7-fold and 10-fold, respectively.
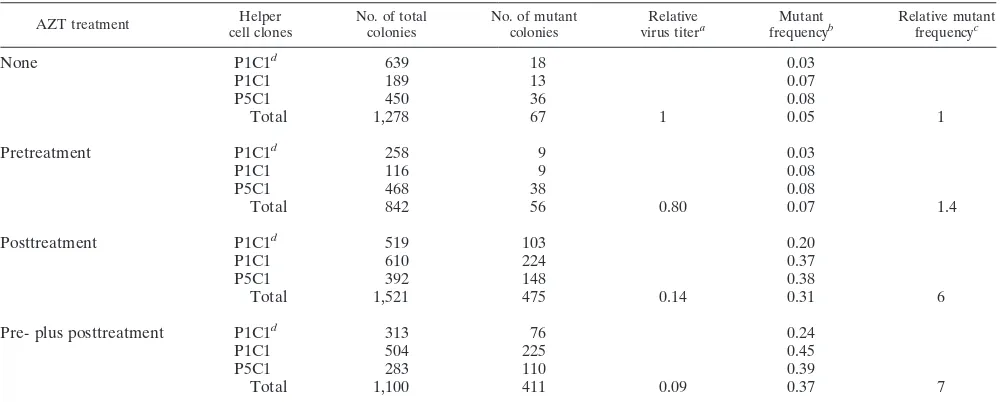
AZT increases the SNV mutant frequency primarily during reverse transcription. To determine the effects of AZT on retrovirus mutant frequencies in different stages of retroviral replication, pretreatments, posttreatments, and pre- plus
post-treatments with 0.10mM AZT were performed. These
exper-iments were performed with 0.1mM AZT because treatment
of target cells with this concentration reduced virus titers 10-fold, ensuring that AZT was entering cells and affecting virus
replication. In addition, 0.1mM AZT is clearly within the range
of clinically achievable AZT concentrations (38). The results are shown in Table 2. Viruses were harvested from the DSDh
helper cell clone (P1C1d) and the C3A2 helper cell clones
(P1C1 and P5C1). Control experiments were again performed to ensure that the control mutant frequencies were reproduc-ible. A mutant frequency of 0.05 (67 of 1,278) was obtained, generating the same mutant frequency as the previous inde-pendent experiment. Pretreatment resulted in an overall mu-tant frequency of 0.07 (56 of 842), which was similar to the
control mutant frequency (P50.30). However, posttreatment
and pre- plus posttreatment resulted in higher mutant frequen-cies of 0.31 (475 of 1,521) and 0.37 (411 of 1,100), respectively
(P , 0.00001). Pretreatment, posttreatment, and pre- plus
posttreatment with AZT resulted in reductions of the virus titer to 0.8, 0.14, and 0.09, respectively, relative to the control virus titers. These results indicated that pretreatment did not have a significant effect on the SNV mutant frequency. How-ever, posttreatment and pre- plus posttreatment with AZT
significantly increased the mutant frequency. Therefore AZT increases the mutant frequency primarily during the treatment of target cells. The large increase in the mutant frequency after posttreatment demonstrated that AZT most likely decreases the accuracy of reverse transcriptase.
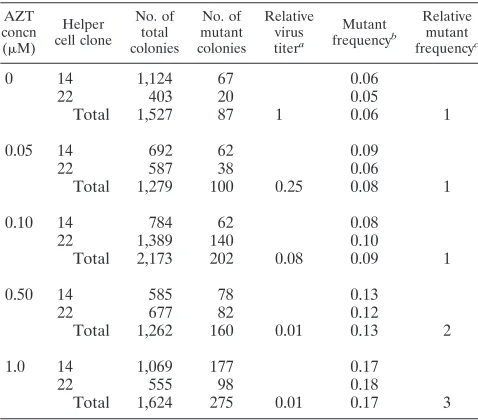
AZT also increases the MLV mutant frequency in a dose-dependent manner.To determine whether AZT increases the mutant frequency of MLV RT, MLV-based PG13 helper cell clones that produce GA-1 virus were used (Fig. 1A). Viruses were harvested from two different PG13 helper cell clones that produce GA-1 virus (clones 14 and 22). The results are pre-sented in Table 3. In the absence of AZT treatment, an overall mutant frequency of 0.06 (87 of 1,527) was observed. Thus, the MLV control mutant frequency was similar to that of SNV.
Posttreatments with 0.05 and 0.10mM AZT resulted in
reduc-tions of virus titers to 0.25 and 0.08 relative to the control virus
titers. Therefore, 0.10mM AZT reduced the virus titers of both
SNV and MLV to approximately 10% of the control virus titers. However, posttreatment of MLV-infected cells with 0.10
mM AZT increased the MLV mutant frequency only 1.5-fold,
to 0.09 (202 of 2,173), in contrast to the 7-fold increase in the mutant frequency observed for SNV. Posttreatments with 0.50
and 1.0 mM AZT resulted in modest two- and threefold
in-creases in the mutant frequencies (P50.001) and a substantial
99% reduction in the virus titers. These results demonstrated that MLV displayed a similar sensitivity to AZT, as reflected by similar decreases in virus titers at the same concentrations of AZT. However, the mutant frequency of MLV did not increase as much as the mutant frequency of SNV at similar levels of virus inhibition.
In addition to infecting D17 cells, we also infected human
thymidine kinase-negative (TK2) cells with GA-1. Human
TK2cells treated with AZT were infected with GA-1, selected
[image:4.612.58.558.81.282.2]with G418, and stained with X-Gal. We observed neither a decrease in virus titer nor an AZT-induced increase in the
TABLE 2. Effects of pretreatment, posttreatment, and pre- plus posttreatment with 0.1mM AZT on lacZ inactivation in LW-1
AZT treatment cell clonesHelper No. of totalcolonies No. of mutantcolonies virus titerRelativea frequencyMutantb Relative mutantfrequencyc
None P1C1d 639 18 0.03
P1C1 189 13 0.07
P5C1 450 36 0.08
Total 1,278 67 1 0.05 1
Pretreatment P1C1d 258 9 0.03
P1C1 116 9 0.08
P5C1 468 38 0.08
Total 842 56 0.80 0.07 1.4
Posttreatment P1C1d 519 103 0.20
P1C1 610 224 0.37
P5C1 392 148 0.38
Total 1,521 475 0.14 0.31 6
Pre- plus posttreatment P1C1d 313 76 0.24
P1C1 504 225 0.45
P5C1 283 110 0.39
Total 1,100 411 0.09 0.37 7
aVirus titers for each experimental group were determined by serial dilution and infection. The relative virus titer represents a ratio of the viral titer of the treatment
group to the viral titer of the untreated group. The viral titer of the untreated group was 2.03105CFU/ml (average of three independent experiments).
bRatio of mutant colonies to total colonies.
cRatio of the mutant frequency of the treatment group to the mutant frequency of the untreated group. Statistical analysis of Fisher’s least significant difference
showed that the mutant frequencies after no treatment and pretreatment were not statistically different (P50.30). After posttreatment and pre- plus posttreatment, statistically different mutant frequencies were observed in comparison to the no-treatment control (P,0.00001) but not between posttreatment and pre- plus posttreatment (P50.22).
dDSDh-derived helper cell clone. All other experiments were performed with C3A2-derived helper cell clones.
on November 9, 2019 by guest
http://jvi.asm.org/
GA-1 mutant frequency. This result indicated that phosphor-ylation of AZT is required for the virus inhibition as well as the increase in the mutant frequency (data not shown).
An in vivo assay using an SNV-based shuttle vector allows characterization of AZT-induced mutant proviruses.Since the lacZ gene is 3,474 bp in length, DNA sequence analysis of the lacZ-inactivating mutations would be time-consuming and la-borious. To facilitate DNA sequencing of AZT-induced muta-tions, we used the previously described (22) SNV-based shuttle vector BK-2 (Fig. 2A). BK-2 contains all of the SNV cis-acting sequences needed for virus replication. In addition, BK-2
ex-presses hygro from the 59LTR promoter, contains neo that is
expressed only in Escherichia coli from a prokaryotic promoter in the vector, has a pBR322 origin of replication for
propaga-tion of proviral plasmids in E. coli, and has lacZainserted in
the U3 region of the 39 LTR to serve as a mutational target.
During reverse transcription, the lacZain the 39LTR is
du-plicated and is present in both LTRs of the resulting provirus.
Since lacZa is only 280 bp in length, it is relatively easy to
characterize lacZa-inactivating mutations by DNA sequencing.
The protocol used to generate pools of BK-2-infected cells and to recover proviral plasmids is outlined in Fig. 2B. The BK-2 DNA was transfected into the C3A2 helper cells, and pools of hygromycin-resistant helper cells were selected; vi-ruses were harvested and used to infect fresh C3A2 cells. Again, hygromycin-resistant cells were selected, and individual cell clones were isolated and expanded in the presence of anti-SNV antibodies to suppress reinfection of the virus-pro-ducing cells. The BK-2 retrovirus vector was introduced into the C3A2 cells by infection to avoid any mutations that could occur during transfection. Viruses were harvested from the expanded C3A2 helper cell clones and used to generate pools
of infected D17 target cells. To determine the effects of AZT on retrovirus mutation rates in different stages of replication, pretreatments, posttreatments, and pre- plus posttreatments
with 0.10mM AZT were performed.
Genomic DNAs were isolated from infected D17 cells and digested with BamHI (Fig. 2). The proviral DNA was purified by using the Lac repressor protein-mediated affinity purifica-tion as previously described (22, 40). The purified proviral DNA was ligated and transformed into E. coli by electropora-tion. The resulting transformants were grown on agar plates containing kanamycin (a neomycin analog),
isopropylthioga-lactopyranoside, and X-Gal. Mutations in the lacZawere
iden-tified by the white or light blue colony phenotype. The ratio of mutant colonies to total colonies recovered provided the in vivo forward mutant frequency.
[image:5.612.58.297.90.300.2]AZT increases the mutation rate of SNV-based shuttle vec-tor BK-2.To determine whether AZT also increases the rate of
FIG. 2. An in vivo recovery assay to facilitate DNA sequence analysis of AZT-induced mutations. (A) The SNV-based vector BK-2 contains the LTRs, the cis-acting elements from SNV, hygro, neo, pBR322 bacterial origin of repli-cation (ori), and E. coli lacZa. The black square and solid black arrow represent a bacterial promoter that expresses neo in E. coli and the direction of transcrip-tion. The thick zigzag lines represent host chromosomal DNA adjacent to the integrated provirus, and Bam represents a BamHI restriction site. lacZais inserted at the 59end of the U3 region of the 39LTR. The proviral plasmids recovered after BamHI digestion (arrow below provirus) contain one lacZafrom the 39LTR. (B) Outline of the experimental approach for determining the effects of AZT on retrovirus mutation rates. Genomic DNA of infected D17 target cells was purified and digested with restriction enzyme BamHI. Proviral plasmids were recovered by using Lac repressor protein-mediated affinity purification. The forward mutation rate was calculated by dividing the number of white plus light blue colonies by the total number of recovered colonies.
TABLE 3. Effects of AZT posttreatment on inactivation of the lacZ gene in GA-1-infected cells
AZT concn (mM)
Helper cell clone
No. of total colonies
No. of mutant colonies
Relative virus titera
Mutant frequencyb
Relative mutant frequencyc
0 14 1,124 67 0.06
22 403 20 0.05
Total 1,527 87 1 0.06 1
0.05 14 692 62 0.09
22 587 38 0.06
Total 1,279 100 0.25 0.08 1
0.10 14 784 62 0.08
22 1,389 140 0.10
Total 2,173 202 0.08 0.09 1
0.50 14 585 78 0.13
22 677 82 0.12
Total 1,262 160 0.01 0.13 2
1.0 14 1,069 177 0.17
22 555 98 0.18
Total 1,624 275 0.01 0.17 3
aVirus titers for each experimental group were determined by serial dilution
and infection. The relative virus titer represents a ratio of the viral titer of the treatment groups to the viral titer of the untreated group. The viral titer of the untreated group was 1.53105CFU/ml (average of two independent experi-ments).
bRatio of mutant colonies to total colonies.
cRatio of the mutant frequency of the treatment group to the mutant
fre-quency of the untreated group. Statistical analysis using a contrast to test for a linear response to the concentration of AZT demonstrated that the increase in mutant frequency with increasing AZT concentration is significant (P50.001).
on November 9, 2019 by guest
http://jvi.asm.org/
[image:5.612.318.550.274.600.2]inactivation of the lacZareporter gene, the in vivo BK-2 mu-tant frequencies were determined (Table 4). Viruses were har-vested from two C3A2-derived helper cell clones (P7C3 and P1C2) and used to infect D17 cells. Pretreatments, posttreat-ments, and pre- plus posttreatments with AZT were per-formed. If replication-competent viruses were present in the helper cell supernatants, the BK-2 vector may have undergone multiple rounds of replication by reinfection of the helper cells. Therefore, supernatants from the pools of infected cells were tested to rule of the presence of replication-competent SNV. No replication-competent viruses were detected, indicating that BK-2 underwent a single cycle of retrovirus replication
(data not shown). Each treatment group contained at least 73
105 independent target cell colonies (data not shown).
Genomic DNAs from each pool of D17 target cells were di-gested with BamHI, and proviruses were recovered as plas-mids. The phenotypes of the bacterial colonies were deter-mined in the presence of X-Gal. From the control group (no AZT treatment), a total of 21,059 proviruses were recovered after BamHI digestion (reported previously in reference 22); 63 of these colonies had a white or light blue mutant colony
phenotype, providing a mutant frequency of 2.9931023(1 of
334). A total of 10,897 colonies were recovered following
pre-treatment; 37 of these colonies displayed a mutant phenotype,
resulting in a similar mutant frequency of 3.403 1023 (1 of
295). This result indicated that pretreatment did not
signifi-cantly increase the BK-2 mutant frequency (P50.34). A total
of 7,691 colonies were recovered after posttreatment; 44 of these colonies displayed a mutant phenotype, providing a
higher mutant frequency of 5.7231023(1 of 175). This
rep-resented approximately a twofold increase in the mutant
fre-quency (P50.002). A total of 6,495 colonies were recovered
after pre- plus posttreatment; 58 of these displayed a mutant
phenotype, providing the highest mutant frequency, 8.93 3
1023(1 of 112). This result indicated that pre- plus
posttreat-ment increased the retrovirus mutant frequency approximately
threefold (P50.0004). These results are consistent with those
presented in Table 2 and indicate that AZT increases the
retrovirus mutant frequencies of the lacZareporter gene
dur-ing reverse transcription.
Characterization of mutant proviruses recovered after AZT treatment. To determine the types of mutations induced by
AZT, DNA sequence analysis of the lacZa genes of several
mutant proviruses was performed. The results are presented in Table 5. A total of 37 of 63 mutants from the control group, 21 of 37 mutants after pretreatment, 22 of 44 mutants after
post-TABLE 4. Recovery of BK-2 proviral plasmids after 0.1mM AZT treatments
Helper clone
No treatment Pretreatment Posttreatment Pre- plus posttreatment
No. of mutants/total no. recovereda
Mutant frequencyb
(1023)
No. of mutants/total no. recovered
Mutant frequency
(1023)
No. of mutants/total no. recovered
Mutant frequency
(1023)
No. of mutants/total no. recovered
Mutant frequency
(1023)
P1C2 27/8,843 3.05 22/6,101 3.61 22/3,959 5.56 30/3,250 9.23
P7C3 36/12,216 2.95 15/4,796 3.13 22/3,732 5.89 28/3,245 8.63
Total 63/21,059 2.99 37/10,897 3.40 44/7,691 5.72 58/6,495 8.93
aNumber of white or light blue mutant colonies divided by the total number of colonies recovered (mutant plus wild type).
bNumber of mutant colonies divided by the total number of colonies. Statistical analysis of Fisher’s least significant difference showed that the mutant frequencies
[image:6.612.58.556.83.161.2]after no treatment and pretreatment were not statistically different (P50.34). In comparison to the no-treatment group, statistically different mutant frequencies were observed after posttreatment (P50.002) or pre- plus posttreatment (P50.0004). The mutant frequencies after posttreatment and pre- plus posttreatment were also significantly different (P50.005). Mutant frequencies after pretreatment were statistically different from the mutant frequencies following posttreatment (P50.003) and pre- plus posttreatment (P50.0005).
TABLE 5. In vivo mutation rates for SNV-based shuttle vector BK-2 following AZT treatments
Mutation class
Controla Pretreatment Posttreatment Pre- plus posttreatment
No. of independent
mutants/no. of mutants sequencedb
Mutation rate (1026)c
No. of independent
mutants/no. of mutants sequenced
Mutation rate (1026)
No. independent
mutants/no. of mutants sequenced
Mutation rate (1026)
No. independent
mutants/no. of mutants sequenced
Mutation rate (1026)
Substitutions 12/20 14.3 12/12 17.2 11/12 27.6 10/21 46.1
Frameshifts 8/9 2.6 1/1 0.6 2/4 3.7 4/6 5.3
Simple deletions 3/3 0.9 6/6 3.5 2/4 3.7 5/6 5.3
Deletions with insertions 1/2 0.6 1/2 1.2 1/1 0.9 3/3 2.7
Duplications 1/1 0.3 0 0 0
Hypermutations 2/2 0.6 0 1/1d 0.9 0
Total 27/37 19.3 20/21 22.5 17/22 36.8 22/36 59.4
aThe data represent a subset of the data previously described (22).
bThe first number indicates the number of different mutants identified. If the same mutant was identified more than once in a pool, it was treated as one independent
mutant. The second number indicates the total number of mutants sequenced.
cNumber of mutations/base pair/replication cycle. Mutation rates were calculated as follows:
no. of mutations identified3total no. of mutants6T
mutants sequenced total no. of colonies
Total number of mutants and total number of colonies recovered are listed in Table 4. For substitutions, T5113 target nucleotides of the lacZa(1). For frameshifts, simple deletions, deletions with insertions, duplications, and hypermutants, T5280 target nucleotides (lacZaand promoter region).
dThe mutation rate within the hypermutated region was approximately 1021/bp (4 substitutions/41 nucleotides for hypermutant PO73:19, 21 substitutions/180 target nucleotides for P1C2B:73, and 8 substitutions/76 nucleotides for P7C3B:8).
on November 9, 2019 by guest
http://jvi.asm.org/
[image:6.612.61.557.501.633.2]treatment, and 36 of 58 mutants after pre- plus posttreatment were analyzed. Most of the previously described types of mu-tations, including transition and transversion substitutions, frameshifts, simple deletions, deletions with insertions, dupli-cations, and A-to-G hypermutations, were identified.
The rates of mutations for the variety of mutation types were calculated, and the overall rates of mutations were determined. The results suggested that pretreatment with AZT did not
affect the mutation rate (22.531026mutations/bp/cycle versus
19.33 1026 mutations/bp/cycle). In contrast, posttreatments
and pre- plus posttreatments increased the mutation rates. Posttreatment with AZT increased the mutation rate
approx-imately twofold (36.8 3 1026 mutations/bp/cycle divided by
19.331026mutations/bp/cycle). Pre- plus posttreatment with
AZT increased the mutation rate approximately threefold
(59.431026mutations/bp/cycle divided by 19.3 31026
mu-tations/bp/cycle). These results showed that the mutation rate
of the lacZa reporter gene was increased when AZT was
present during reverse transcription.
The mutation rates of different types of mutations appeared to increase after AZT treatment. After pre- plus posttreatment with AZT, the rate of substitutions was approximately
three-fold higher (46.131026mutations/bp/cycle divided by 14.33
1026mutations/bp/cycle; P,0.0001, chi square) and the rate
of simple deletions was approximately sixfold higher (5.3 3
1026mutations/bp/cycle divided by 0.93 1026mutations/bp/
cycle; P,0.05, chi square). Posttreatment alone appeared to
increase the rates of substitutions approximately twofold
(27.631026mutations/bp/cycle divided by 14.3 31026
mu-tations/bp/cycle), and simple deletions appeared to increase
the rate of substitutions approximately fourfold (3.7 3 1026
mutations/bp/cycle divided by 0.931026mutations/bp/cycle).
Taken together, these results suggested that the presence of AZT during reverse transcription primarily increased the rates of these two types of mutations. No consistent increase in the mutation rates of frameshift mutations, deletions with inser-tions, hypermutainser-tions, and duplications were observed after AZT treatment.
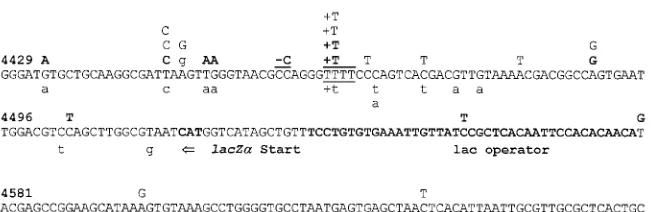
Analysis of substitution mutations, frameshift mutations, and hypermutations.The locations of substitution mutations, frameshift mutations, and hypermutations are shown with the
lacZasequence in Fig. 3. The majority (27 of 33) of the
stitution mutations were transitions. C-to-T and G-to-A sub-stitution mutations were the predominant subsub-stitutions
identi-fied in both the control and the AZT-treated groups. These two types of transitions represented 67% (8 of 12) of the substitutions following pretreatment, 54% (6 of 11) of the substitutions following posttreatment, and 60% (6 of 10) of the substitutions following pre- plus posttreatment. The ratio of transition substitutions to transversion substitutions was not altered by AZT treatment. Transition substitutions comprised 67% (8 of 12), 91% (10 of 11), and 80% (8 of 10) of the substitution mutations following pretreatments, posttreat-ments, and pre- plus posttreatposttreat-ments, respectively. Thus, the ratio of transition to transversion substitutions was similar to the ratios previously observed in the absence of AZT when
lacZawas used as a reporter of mutations (80%) (22, 40, 42).
The nucleotides adjacent to substitution mutations were ana-lyzed to see if dislocation mutagenesis during plus- or minus-strand DNA synthesis could account for the increase in the substitution frequency. Overall, 12 of 33 substitution mutations may have occurred by dislocation mutagenesis. The propor-tions of substitupropor-tions that may have occurred by dislocation mutagenesis were similar following pretreatment (4 of 12) and pre- plus posttreatment (3 of 10) but higher following post-treatment (6 of 11). Therefore, the apparent AZT-induced increase in the rate of substitutions did not result in any change in the type of substitutions or the mechanism by which the substitutions occurred.
At least four independent frameshift mutations were iden-tified in the pre- plus posttreatment group (Fig. 3). One post-treatment mutant exhibited multiple A-to-G substitutions, constituting an A-to-G hypermutation. The hypermutant PO73:19 had a region of 41 bp in which 4 of 11 (36%) adenines were mutated to guanines. This A-to-G hypermutation was similar to two other hypermutations described previously (22).
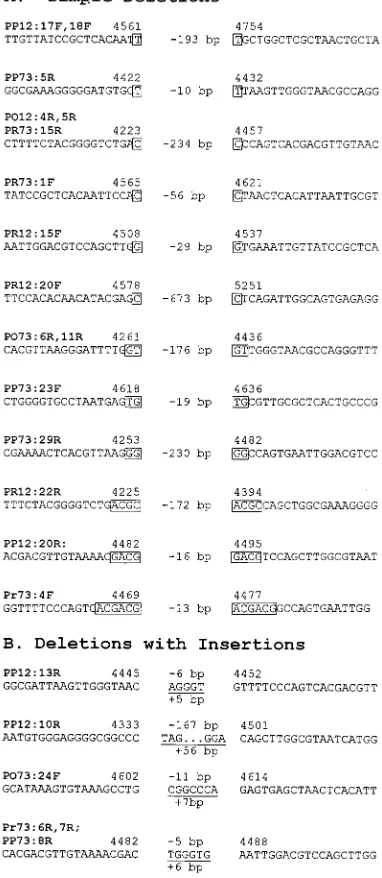
[image:7.612.145.473.103.209.2]Deletions and deletions with insertions.Analysis of proviral clones recovered after AZT pretreatments, posttreatments, and pre- plus posttreatments revealed 13 independent simple deletions and 5 independent deletions with insertions (Fig. 4). All 13 simple deletions contained short direct repeats at the deletion junctions ranging in size from 1 to 6 bp (Fig. 4A). Interestingly, a comparison of the average size of the direct repeats identified from the AZT-treated groups and the pre-viously described untreated groups suggested that the AZT-induced simple deletions involved shorter direct repeats. The average size of the direct repeats identified from the untreated groups was 4.1 bp (10 simple deletions) (22, 41). In contrast,
FIG. 3. Plus-strand nucleotide sequence of lacZaand locations of substitutions, frameshifts, and A-to-G hypermutant mutations identified by DNA sequencing. Mutations identified in the pre- plus posttreatment group are shown as boldface uppercase letters above the sequence; mutations identified as the posttreatment group are shown as lightface uppercase letters above the sequence; mutations identified in the pretreatment group are shown as lightface lowercase letters below the sequence. The number above each line refers to the nucleotide number beginning at the start of the 59LTR. The runs of identical nucleotides in which frameshift mutations occurred are underlined. Lowercase g nucleotides shown above the sequence represent four A-to-G substitutions identified in one hypermutant provirus.
on November 9, 2019 by guest
http://jvi.asm.org/
the average size of the direct repeats identified from the AZT-treated groups was 2.1 bp (13 simple deletions). Therefore, AZT pre- plus post-treatment increased the rate of simple deletions which was associated with a decrease in the size of
the direct repeats at the deletion junctions (P,0.05, t test).
This result suggested that AZT treatment reduced the proces-sivity of RT.
Five independent deletions with insertions containing short insertions at the site of the deletions were identified (Fig. 4B). No differences were noted with the size of the deletion or insertion between mutants recovered with or without AZT treatment.
DISCUSSION
AZT increases the retrovirus mutation rate. Our experi-ments clearly indicate that the antiretrovirus drug AZT in-creases the mutation rates of type C retroviruses. The mutation rates were measured for SNV and MLV during a single cycle of retrovirus replication using two different mutation reporter genes. AZT affected the SNV mutation rate to a much greater
extent than the MLV mutation rate, since 0.5 mM AZT
in-creased the SNV mutation rate 10-fold, whereas 1.0mM AZT
increased the MLV mutation rate only 3-fold. The same re-porter gene (lacZ) and target cells (D17) were used in the two studies, and the observed difference between the MLV and
SNV mutation rates following 0.5mM AZT posttreatment was
statistically significant (P 5 0.01, t test). The difference in
sensitivities to the mutagenic effects of AZT may be related to the differences in intrinsic mutation rates of the two RTs (51). However, in our experiments, we observed similar rates of inactivation of the lacZ gene in GA-1 and LW-1, suggesting that the mutation rates of the two RTs are similar. Recently, it was observed that AZT treatment increased the emergence of host range mutants in a replicating feline immunodeficiency virus population (26). The studies did not directly measure mutation rates in a single replication cycle. Nevertheless, these two studies strongly suggest that AZT is likely to increase the mutation rates of most retroviruses.
Possible mechanisms for AZT-induced increase in the ret-rovirus mutation rates.Several potential mechanisms may be responsible for AZT-induced increase in the retrovirus muta-tion rates. One attractive hypothesis is that the increase in the retrovirus mutation rate results from the effect of AZT on target cell nucleotide pools. AZT has been shown to affect the balance of nucleotide pools by competing with thymidine for the host cell enzyme TK (10, 11). Ultimately, nucleotide pools change due to the complex mechanisms regulating the reduc-tion of ribonucleotides to deoxyribonucleotides by ribonucle-otide reductase (10). The pool imbalances result in increased levels of dCTP and decreased levels of dTTP and dGTP in the AZT-treated cells. It has been demonstrated that nucleotide pool imbalances can increase the mutation rates of eukaryotic polymerases in vivo (24, 25, 30, 35). Thus, nucleotide pool imbalances may also affect the in vivo mutation rates of RTs. In addition, in vitro mutation assays have shown that nucleotide pool imbalances can significantly increase the rates of G-to-A hypermutations (34). MLV RT may be less sensitive to nucle-otide pool changes, which may explain the lower increase in the MLV mutation rate. Clearly, additional experiments are needed to determine whether AZT affects the retrovirus mu-tation rates by altering nucleotide pools. Another possible mechanism may involve incorporation of AZT into the plus-strand DNA; discontinuous plus-plus-strand DNA synthesis may result in viral DNAs with proper ends that can integrate into the target cell DNA. Subsequently, host cell DNA repair mechanisms may carry out error-prone DNA repair and in-crease the virus mutation rate. It should be noted that the same target cells were used in the SNV and MLV studies. Finally, AZT may bind noncatalytically to RT and cause a conforma-tional change that affects enzyme fidelity. If so, then AZT can bind noncatalytically to RTs as structurally diverse as those from SNV, MLV, and feline immunodeficiency virus.
Possible effects of AZT on the processivity of RT. AZT clearly increased the BK-2 mutation rate. When AZT pre- plus post-treatment was performed, the rate of substitutions was
increased approximately threefold (P , 0.0001, chi square),
and the rate of simple deletions was increased by
[image:8.612.83.274.78.517.2]approxi-mately sixfold (P,0.05, chi square). The increase in the rate
FIG. 4. Sequence analysis of deletions and deletions with insertions. Clone numbers are shown above the sequence in boldface. (A) Simple deletions. Short direct repeats at the deletion junctions are shown in boxes. The numbers of nucleotides deleted are indicated between the deletion junctions preceded by a minus sign. (B) Deletions with insertions. The numbers of nucleotides deleted are indicated between deletion junctions preceded by a minus sign. Inserted nucleotides are underlined, and the lengths of insertion are shown below the sequence.
on November 9, 2019 by guest
http://jvi.asm.org/
of simple deletions suggests the hypothesis that the presence of AZT during reverse transcription increases the rate of tem-plate switching and decreases the processivity of RT, perhaps indirectly through alterations in nucleotide pools. (Processivity is defined here as a rate of dissociation of RT-primer complex from the template and does not imply a dissociation of the RT from the primer-template complex.)
AZT treatment of HIV-1 infection may increase variation in virus populations.It is not clear how AZT treatment will affect the HIV-1 mutation rate or variation in HIV-1 populations. First, since the MLV mutation rate was affected to a lesser extent than the SNV mutation rate, the HIV-1 mutation rate may be affected to a lesser or greater extent than the SNV mutation rate. Second, if the hypothesis that nucleotide pool imbalances affect the RT mutation rate is correct, then the extent to which AZT affects the nucleotide pools of HIV-1 target cells will be a critical factor in determining the AZT effect on HIV-1 RT mutation rates. AZT concentrations used
in this study (0.1 to 1mM) were much lower than the
concen-trations that can be clinically achieved (.6 mM), suggesting
that AZT treatment may have a greater impact on the nucle-otide pools of HIV-1 target cells in patients (38).
It is arguable whether alterations in the mutation rates will affect variation in HIV-1 populations. A model has been pro-posed to ascertain the relative impact of mutation rates and selective forces on the virus population (5). Based on this model, it has been hypothesized that small changes in the selective growth advantage will have a greater impact on the mutant frequencies than large changes in the mutation rates. It was recently suggested that 3TC-resistant mutant isolates of HIV-1 have lower mutation rates and a delayed kinetics of development of drug resistance to other antiretroviral drugs (52). Further studies are needed to determine the role of HIV-1 mutation rates in viral evolution and pathogenesis.
Nucleotide pool imbalances induced by other drugs may also increase the mutation rate of RT. It has been demon-strated that hydroxyurea (HU) can inhibit HIV-1 replication (12, 31). HU inhibits ribonucleotide reductase and alters the nucleotide pools within the cell (30). It is possible that these alterations of the nucleotide pools also increase the mutation rate of the HIV-1 RT. The effects of HU and 3TC on the retrovirus mutation rates are currently being determined.
ACKNOWLEDGMENTS
We thank Gerry Hobbs for statistical analysis of the results. We thank Jeffery Anderson, Robert Bowman, Ella Harvey Bowman, Jea-nine Certo, Krista Delviks, Elias K. Halvas, Wei-Shau Hu, Mithu Molla, Audra Rowan, Evguenia Svarovskaia, and Philip Yin for critical reading of the manuscript. We especially thank Wei-Shau Hu for valuable intellectual input and discussions throughout the project.
This work was supported by Public Health Service grant CA58875 from the National Institutes of Health.
REFERENCES
1. Bebenek, K., J. Abbots, J. D. Roberts, S. H. Wilson, and T. A. Kunkel. 1989. Specificity and mechanism of error-prone replication by human immunode-ficiency virus-1 reverse transcriptase. J. Biol. Chem. 264:16948–16956. 2. Cepko, C. 1992. XGAL staining of cultured cells, p. 9.11.9-9.11.12. In F. M.
Ausubel, R. Brent, R. E. Kingston, D. D. Moore, J. G. Seidman, J. A. Smith, and K. Struhl (ed.), Current protocols in molecular biology. Greene Pub-lishing Associates and Wiley Interscience, New York, N.Y.
3. Coffin, J. M. 1990. Genetic variation in retroviruses, p. 11–33. In E. Kurstak, R. G. Marusyk, F. A. Murphy, and M. H. V. Van Regenmortel (ed.), Applied virology research, virus variability, epidemiology and control. Plenum Press, New York, N.Y.
4. Coffin, J. M. 1990. Retroviridae and their replication, p. 1437–1500. In B. Fields (ed.), Virology, 2nd ed. Raven Press, New York, N.Y.
5. Coffin, J. M. 1995. HIV population dynamics in vivo: implications for genetic variation, pathogenesis, and therapy. Science 267:483–489.
6. Dougherty, J. P., and H. M. Temin. 1988. Determination of the rate of base-pair substitution and insertion mutations in retrovirus replication. J. Vi-rol. 62:2817–2822.
7. El-Farrash, M. A., M. J. Kuroda, T. Kitazaki, T. Masuda, K. Kato, M.
Hatanaka, and S. Harada.1994. Generation and characterization of a hu-man immunodeficiency virus type 1 (HIV-1) mutant resistant to an HIV-1 protease inhibitor. J. Virol. 68:233–239.
8. Essex, M. 1995. Strategies of research for a vaccine against AIDS. Pubbl. Stn. Zool. Napoli II 17:141–149.
9. Fitzgibbon, J. E., R. M. Howell, C. A. Haberzettl, S. J. Sperber, D. J. Gocke,
and D. T. Dubin.1992. Human immunodeficiency virus type 1 pol gene mutations which cause decreased susceptibility to 29-39-dideoxycytidine. An-timicrob. Agents Chemother. 36:153–157.
10. Frick, L. W., D. J. Nelson, M. H. St. Clair, P. A. Furman, and T. A.
Krenitsky.1988. Effects of 39-azido-39-deoxythymidine on the deoxynucle-otide triphosphate pools of cultured human cells. Biochem. Biophys. Res. Commun. 154:124–129.
11. Furman, P. A., J. A. Fyfe, M. H. St. Clair, K. Weinhold, J. L. Rideout, G. A.
Freemen, S. N. Lehrman, D. P. Bolognesi, S. Broder, H. Mitsuya, and D. W. Barry.1986. Phosphorylation of 39-azido-39deoxythymidine and selective interaction of the 59-triphosphate with human immunodeficiency virus re-verse transcriptase. Proc. Natl. Acad. Sci. USA 83:8333–8337.
12. Gao, W.-Y., A. Cara, R. C. Gallo, and F. Lori. 1993. Low levels of de-oxynucleotides in peripheral blood lymphocytes: a strategy to inhibit human immunodeficiency virus type 1 replication. Proc. Natl. Acad. Sci. USA 90: 8925–8928.
13. Glickman, B. W., V. A. Saddi, and J. Curry. 1994. Spontaneous mutations in mammalian cells. Mutat. Res. 304:19–32.
14. Gritz, L., and J. Davies. 1979. Plasmid encoded hygromycin-b resistance: the sequence of hygromycin b phosphotransferase and its expression. Gene
25:179–188.
15. Gu, Z., Q. Gao, X. Li, M. Parniak, and M. A. Wainberg. 1992. Novel mutation in the human immunodeficiency virus type 1 reverse transcriptase gene that encodes cross-resistance to 29,39-dideoxyinosine and 29,39 -dideoxy-cytidine. J. Virol. 66:7128–7135.
16. Ho, D. D., A. U. Neumann, A. S. Perelson, W. Chen, J. M. Leonard, and M.
Markowitz.1995. Rapid turnover of plasma virions and CD4 lymphocytes in HIV-1 infection. Nature 373:123–126.
17. Hu, W.-S., and H. M. Temin. 1990. Genetic consequences of packaging two RNA genomes in one retroviral particle: pseudodiploidy and a high rate of genetic recombination. Proc. Natl. Acad. Sci. USA 87:1556–1560. 18. Japour, A. J., S. Welles, R. T. D’Aquilla, V. A. Johnson, D. D. Richman, R. W.
Coombs, P. S. Reichelderfer, J. O. Kahn, C. S. Crumpacker, and D. R. Kuritzkes.1995. Prevalence and clinical significance of zidovudine resistance mutations in human immunodeficiency virus isolated from patients after long-term zidovudine treatment. J. Infect. Dis. 171:1172–1179.
19. Ji, J., and L. A. Loeb. 1992. Fidelity of HIV-1 reverse transcriptase copying RNA in vitro. Biochemistry 31:954–958.
20. Jorgensen, R. A., S. J. Rothstein, and W. J. Reznikoff. 1979. A restriction enzyme cleavage map of Tn5 and location of a region encoding neomycin resistance. Mol. Gen. Genet. 177:65–72.
21. Kawai, S., and M. Nishizawa. 1984. New procedures for DNA transfection with polycation and dimethyl sulfoxide. Mol. Cell. Biol. 4:1172–1174. 22. Kim, T., R. A. Mudry, Jr., C. A. Rexrode II, and V. K. Pathak. 1996.
Retroviral mutation rates and A-to-G hypermutations during different stages of retroviral replication. J. Virol. 70:7594–7602.
23. Kunkel, T. A., and P. S. Alexander. 1986. The base substitution fidelity of eucaryotic DNA polymerases—mispairing frequencies, site preferences, in-sertion preferences, and base substitution by dislocation. J. Biol. Chem.
261:160–166.
24. Kunz, B. A., and S. E. Kohalmi. 1991. Modulation of mutagenesis by deoxy-ribonucleotide levels. Annu. Rev. Genet. 25:339–359.
25. Kunz, B. A., and S. E. Kohalmi. 1993. Mutational specificity of thymidine depletion in yeast. Mut. Res. 289:73–81.
26. LaCasse, R. A., K. M. Remington, and T. W. North. 1996. The mutation frequency of feline immunodeficiency virus enhanced by 39-azido-39 -deoxy-thymidine. J. Acquired Immune Defic. Syndr. Hum. Retroviruses 12:26–32. 27. Larder, B. A., G. Darby, and D. D. Richman. 1989. HIV with reduced sensitivity to zidovudine (AZT) isolated during prolonged therapy. Science
243:1731–1734.
28. Larder, B. A., and S. D. Kemp. 1989. Multiple mutations in HIV-1 reverse transcriptase confer high-level resistance to zidovudine (AZT). Science 246: 1155–1158.
29. Libby, R. T., and J. A. Gallant. 1994. Phosphorlytic error correction during transcription. Mol. Microbiol. 12:121–129.
30. Loeb, L. A., and T. A. Kunkel. 1982. Fidelity of DNA synthesis. Annu. Rev. Biochem. 51:429–457.
31. Lori, F., A. Malykh, A. Cara, D. Sun, J. N. Weinstein, J. Lisziewicz, and R. C.
Gallo.1994. Hydroxyurea as an inhibitor of human immunodeficiency virus-type 1 replication. Science 266:801–805.
32. Mansky, L. M., and H. M. Temin. 1994. Lower mutation rate of bovine
on November 9, 2019 by guest
http://jvi.asm.org/
leukemia virus relative to that of spleen necrosis virus. J. Virol. 68:494–499. 33. Mansky, L. M., and H. M. Temin. 1995. Lower in vivo mutation rate of human immunodeficiency virus type 1 than that predicted from the fidelity of purified reverse transcriptase. J. Virol. 69:5087–5094.
34. Martinez, M. A., J.-P. Vartanian, and S. Wain-Hobson. 1994. Hyper-mutagenesis of RNA using human immunodeficiency virus type 1 reverse transcriptase and biased dNTP concentrations. Proc. Natl. Acad. Sci. USA
91:11787–11791.
35. Meuth, M. 1989. The molecular basis of mutations induced by deoxyribo-nucleoside triphosphate pool imbalances in mammalian cells. Exp. Cell Res.
181:305–316.
36. Milich, L., B. Margolin, and R. Swanstrom. 1993. V3 Loop of the human immunodeficiency virus type 1 Env protein: interpreting sequence variability. J. Virol. 67:5623–5634.
37. Miller, A. D., J. V. Garcia, N. von Suhr, C. M. Lynch, C. Wilson, and M. V.
Eiden.1991. Construction and properties of retrovirus packaging cell lines based on gibbon ape leukemia virus. J. Virol. 65:2220–2224.
38. Moore, H. H. P., R. H. Raasch, K. L. R. Brouwer, K. Opheim, S. H.
Cheese-man, E. Eyster, S. M. Lemon, and C. M. van der Horst.1995. Pharmacoki-netics and bioavailability of zidovudine and its glucuronidated metabolite in patients with human immunodeficiency virus infection and hepatic disease (AIDS clinical trials group protocol 062). Antimicrob. Agents Chemother.
39:2732–2737.
39. Parthasarathi, S., A. Varela-Echavarria, Y. Ron, B. D. Preston, and J. P.
Dougherty.1995. Genetic rearrangements occurring during a single cycle of murine leukemia virus vector replication: characterization and implications. J. Virol. 69:7991–8000.
40. Pathak, V. K., and H. M. Temin. 1990. Broad spectrum of in vivo forward mutations, hypermutations, and mutational hotspots in a retroviral shuttle vector after a single replication cycle: substitutions, frameshifts, and hyper-mutations. Proc. Natl. Acad. Sci. USA 87:6019–6023.
41. Pathak, V. K., and H. M. Temin. 1990. Broad spectrum of in vivo forward mutations, hypermutations, and mutational hotspots in a retroviral shuttle vector after a single replication cycle: deletions and deletions with insertions. Proc. Natl. Acad. Sci. USA 87:6024–6028.
42. Pathak, V. K., and H. M. Temin. 1992. 5-Azacytidine and RNA secondary structure increase the retrovirus mutation rate. J. Virol. 66:3093–3100. 43. Patick, A., R. Rose, J. Greytok, C. M. Bechtold, M. A. Hermsmeier, P. T.
Chen, J. C. Barrish, R. Zahler, R. J. Colonno, and P.-F. Lin.1995.
Charac-terization of a human immunodeficiency virus type 1 variant with reduced sensitivity to an aminodiol protease inhibitor. J. Virol. 69:2148–2152. 44. Preston, B. D., B. J. Poiesz, and L. A. Loeb. 1988. Fidelity of HIV-1 reverse
transcriptase. Science 242:1168–1171.
45. Roberts, J. D., K. Bebenek, and T. A. Kunkel. 1988. The accuracy of reverse transcriptase from HIV-1. Science 242:1171–1173.
46. Sambrook, J., E. F. Fritsch, and T. Maniatis. 1989. Molecular cloning: a laboratory manual, 2nd ed. Cold Spring Harbor Laboratory Press, Cold Spring Harbor, N.Y.
47. Shirasaka, T., M. F. Kavlick, T. Ueno, W.-Y. Gao, E. Kojima, M. L. Alcaide,
S. Chokekijchai, B. M. Roy, E. Arnold, R. Yarchoan, and H. Mitsuya.1995. Emergence of human immunodeficiency virus type 1 variants with resistance to multiple dideoxynucleosides in patients receiving therapy with dideoxynucleosides. Proc. Natl. Acad. Sci. USA 92:2398–2402.
48. St. Clair, M. H., J. L. Martin, G. Tudor-Williams, M. C. Bach, C. L. Vavro,
D. M. King, P. Kellam, S. D. Kemp, and B. A. Larder.1991. Resistance to ddI and sensitivity to AZT induced by a mutation in the HIV-1 reverse transcriptase. Science 253:1557–1559.
49. Temin, H. M. 1993. Retrovirus variation and reverse transcription: abnormal strand transfers result in retrovirus genetic variation. Proc. Natl. Acad. Sci. USA 90:6900–6903.
50. Tisdale, M., S. D. Kemp, N. R. Parry, and B. A. Larder. 1993. Rapid in vitro selection of human immunodeficiency virus type 1 resistant to 39-thiacytidine inhibitors due to a mutation in the YMDD region of reverse transcriptase. Proc. Natl. Acad. Sci. USA 90:5653–5656.
51. Varela-Echavarria, A., N. Garvey, B. D. Preston, and J. P. Dougherty. 1992. Comparison of Moloney murine leukemia virus mutation rate with the fi-delity of its reverse transcriptase in vitro. J. Biol. Chem. 267:24681–24688. 52. Wainberg, M. A., W. C. Drosopoulos, H. Salomon, M. Hsu, G. Borkow, M. A.
Parniak, Z. Gu, Q. Song, J. Manne, S. Islam, G. Castriota, and V. R. Prasad.
1996. Enhanced fidelity of 3TC-selected mutant HIV-1 reverse transcriptase. Science 271:1282–1285.
53. Watanabe, S., and H. M. Temin. 1983. Construction of a helper cell line for reticuloendotheliosis virus cloning vectors. Mol. Cell. Biol. 3:2241–2249. 54. Wei, X., S. K. Ghosh, M. E. Taylor, V. A. Johnson, E. A. Emini, P. Deutsch,
J. D. Lifson, S. Bonhoeffer, M. A. Nowak, B. H. Hahn, M. S. Sag, and G. M. Shaw.1995. Viral dynamics in human immunodeficiency virus type 1 infec-tion. Nature 373:117–122.