Network Analysis of the Chronic Hepatitis C Virome Defines
Hypervariable Region 1 Evolutionary Phenotypes in the Context of
Humoral Immune Responses
Brendan A. Palmer,aDaniel Schmidt-Martin,aZoya Dimitrova,bPavel Skums,bOrla Crosbie,cElizabeth Kenny-Walsh,c Liam J. Fanninga
Molecular Virology Diagnostic & Research Laboratory, Department of Medicine, University College Cork, Cork, Irelanda; Division of Viral Hepatitis, Centers for Disease Control and Prevention, Atlanta, Georgia, USAb; Department of Hepatology, Cork University Hospital, Cork, Irelandc
ABSTRACT
Hypervariable region 1 (HVR1) of hepatitis C virus (HCV) comprises the first 27 N-terminal amino acid residues of E2. It is clas-sically seen as the most heterogeneous region of the HCV genome. In this study, we assessed HVR1 evolution by using ultradeep pyrosequencing for a cohort of treatment-naive, chronically infected patients over a short, 16-week period. Organization of the sequence set into connected components that represented single nucleotide substitution events revealed a network dominated by highly connected, centrally positioned master sequences. HVR1 phenotypes were observed to be under strong purifying (station-ary) and strong positive (antigenic drift) selection pressures, which were coincident with advancing patient age and cirrhosis of the liver. It followed that stationary viromes were dominated by a single HVR1 variant surrounded by minor variants comprised from conservative single amino acid substitution events. We present evidence to suggest that neutralization antibody efficacy was diminished for stationary-virome HVR1 variants. Our results identify the HVR1 network structure during chronic infection as the preferential dominance of a single variant within a narrow sequence space.
IMPORTANCE
HCV infection is often asymptomatic, and chronic infection is generally well established in advance of initial diagnosis and sub-sequent treatment. HVR1 can undergo rapid sequence evolution during acute infection, and the variant pool is typically seen to diverge away from ancestral sequences as infection progresses from the acute to the chronic phase. In this report, we describe HVR1 viromes in chronically infected patients that are defined by a dominant epitope located centrally within a narrow variant pool. Our findings suggest that weakened humoral immune activity, as a consequence of persistent chronic infection, allows for the acquisition and maintenance of host-specific adaptive mutations at HVR1 that reflect virus fitness.
H
epatitis C virus (HCV) infection is a global health issue and is recognized as a major etiological agent of liver-related dis-eases (1). It has been estimated that the current prevalence of HCV represents approximately 2% of the global adult (15 years of age and older) population (2). Following transmission, HCV infec-tion may remain asymptomatic for decades, resulting in the ma-jority of infections initially passing undetected (3). It is estimated that up to 4 million Americans are living with the virus, the ma-jority of whom became infected prior to the isolation and identi-fication of the virus (4,5). Consequently, the U.S. Centers for Disease Control and Prevention now recommend that Americans born from 1945 to 1965 be screened for the presence of the virus notwithstanding the presence of clinical symptoms (3,5).HCV is a single-stranded positive-sense RNA virus of consid-erable genomic heterogeneity. A recent reclassification defined the HCV global distribution into 7 genotypes and 67 subtypes, with genotypes 1 and 3 accounting for the majority of infections world-wide (6,7). An error-prone RNA-dependent RNA polymerase, together with an inherent tolerance of defined hypervariable re-gions (HVR), accounts for much of this variability. Three HVRs are located within the envelope glycoprotein E2. The greatest het-erogeneity has been identified at the 27-amino-acid HVR1 (resi-dues 384 to 410 of the H77 reference strain), located at the amino-terminal end of the E2 glycoprotein (8). Recent studies indicated that the central region of E2 (residues 456 to 656) is globular and surprisingly compact, whereas the first 80 amino acids (including
HVR1) lack this structural rigidity (9). This observation is consis-tent with a region that is proposed to shield conserved neutralizing epitopes and to participate in high-density lipoprotein enhance-ment of infection via scavenger receptor class B type I (SRBI) interactions and is itself targeted by neutralizing antibodies (nAb) (10–16).
Mutational flexibility at HVR1 was characterized soon after the initial identification of HCV (8,17). Rapid mutational change of HVR1 has been documented over weeks during the acute phase of infection, where HVR1 evolution is governed predominantly by strong selective pressures, with fixation of beneficial mutations (11,18,19). Reports examining samples collected over years to decades have documented the emergence of convergent HVR1
Received25 November 2015Accepted22 December 2015
Accepted manuscript posted online30 December 2015
CitationPalmer BA, Schmidt-Martin D, Dimitrova Z, Skums P, Crosbie O, Kenny-Walsh E, Fanning LJ. 2016. Network analysis of the chronic hepatitis C virome defines hypervariable region 1 evolutionary phenotypes in the context of humoral immune responses. J Virol 90:3318 –3329.doi:10.1128/JVI.02995-15. Editor:M. S. Diamond
Address correspondence to Liam J. Fanning, [email protected].
B.A.P. and D.S.-M. contributed equally to this article.
Copyright © 2016, American Society for Microbiology. All Rights Reserved.
on November 7, 2019 by guest
http://jvi.asm.org/
quasispecies variant pools under purifying selection pressures in established chronic infections (20–24). In selected instances, the maintenance of the dominant HVR1 epitope extended over years and in the absence of an associated antibody response (22).
We recently reported HVR1 quasispecies phenotypes at the clonal level from a study of 23 chronically infected, treatment-naive patients from whom samples were collected every 2 weeks over a period of 16 weeks (25). Within the short sampling time frame, both stationary (ST) viromes and rapid intrapatient se-quence changes were observed. In the present study, a represen-tative cohort of 12/23 patients was selected for ultradeep pyrose-quencing (UDPS) analysis to interrogate in depth the clonal phenotypes reported. Furthermore, IgG-associated virions were subfractionated from serum, and the HVR1 profiles of viral RNA-positive samples were determined. We report HVR1 phenotypes exhibiting conservative HVR1 evolution that is coincident with patient age and the presence of cirrhosis. The HVR1 variant pools of this group were interlinked by single-site amino acid substitu-tions. Additionally, IgG binding for this cohort of patients was associated with the dominant HVR1 variant but was not indicative of effective virus neutralization for the majority of patient viromes during the study period.
MATERIALS AND METHODS
Sample set.Twelve treatment-naive patients were selected from a larger cohort of 23 for whom the HVR1 quasispecies change had been charac-terized at the clonal level (Table 1) (25). The selection criteria were based on genotype, the presence/absence of cirrhosis, and the observed diver-gence of sequences from the initial sample observed from clonal analysis (25).
Samples collected at 16 weeks, at 8 weeks, and immediately prior to the commencement of antiviral treatment (0 weeks) were analyzed in con-junction with a homogenous plasmid control template of known se-quence (GenBank accession numberGQ985374) by UDPS of amplicons that spanned the E1-E2 glycoprotein gene junction. The amplified frag-ment corresponded to positions 1296 to 1613 of the H77 reference strain (GenBank accession numberAF009606). The 0-week sample was addi-tionally analyzed for the presence of IgG-bound virions. Subjects pro-vided written informed consent, and the study was undertaken under the governance of the Clinical Research Ethics Committee of the Cork Teach-ing Hospitals.
Fractionation of IgG-bound virions.Protein G HP SpinTrap col-umns were used to extract IgG-bound virions from whole patient serum (GE Healthcare). The procedure followed the manufacturer’s instruc-tions, with minor modifications. Briefly, 200l of patient serum,
normal-ized to 5 log10IU/ml with phosphate-buffered saline, was applied to a preequilibrated SpinTrap column. End-over-end mixing at room temper-ature (RT) for 15 min was then performed, followed by centrifugation. Eight serial wash steps (W1 to W8) with 300l of binding buffer were applied. The final wash elute (W8) was retained and analyzed to confirm the absence of detectable virus RNA. IgG-bound virions were recovered from the column by the addition of 200l of elution buffer followed by end-over-end mixing at RT for 5 min. The eluted IgG-bound virions were collected in a microcentrifuge tube containing 30l neutralizing buffer.
Amplification of the E1-E2 junction encompassing the HVR1 re-gion.Viral RNA was extracted using a QIAamp viral RNA minikit into a final volume of 60l (Qiagen). Ten microliters of the RNA sample was taken to generate cDNA by use of SuperScript II reverse transcriptase (Invitrogen). Nested PCR amplification was performed as described pre-viously (26). Inter- and intrapatient samples were handled on separate days to guard against cross-contamination. In each instance, a 1:100 di-lution of the RNA was performed to ensure that the amount of starting template was not limiting. This was confirmed by visualization of the amplicon by gel electrophoresis. Amplicons were purified using a PCR purification kit (Qiagen).
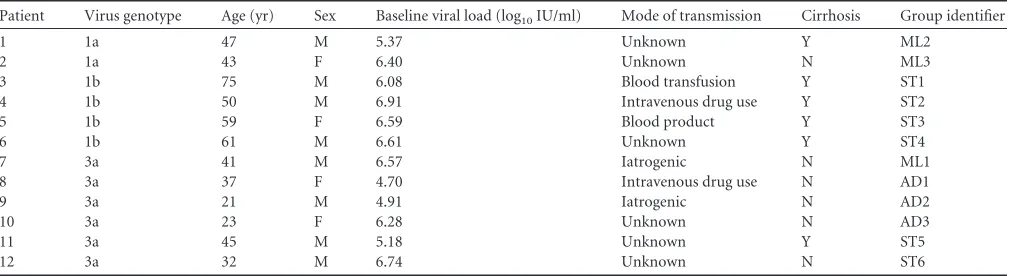
[image:2.585.41.550.77.215.2]FIG 1Phylogenetic analysis of patient consensus sequences against reference 1a, 1b, and 3a strains. The scale bar shows the genetic distance. Bootstrap values for 1,000 resamplings are shown.
TABLE 1Study cohort descriptorsa
Patient Virus genotype Age (yr) Sex Baseline viral load (log10IU/ml) Mode of transmission Cirrhosis Group identifier
1 1a 47 M 5.37 Unknown Y ML2
2 1a 43 F 6.40 Unknown N ML3
3 1b 75 M 6.08 Blood transfusion Y ST1
4 1b 50 M 6.91 Intravenous drug use Y ST2
5 1b 59 F 6.59 Blood product Y ST3
6 1b 61 M 6.61 Unknown Y ST4
7 3a 41 M 6.57 Iatrogenic N ML1
8 3a 37 F 4.70 Intravenous drug use N AD1
9 3a 21 M 4.91 Iatrogenic N AD2
10 3a 23 F 6.28 Unknown N AD3
11 3a 45 M 5.18 Unknown Y ST5
12 3a 32 M 6.74 Unknown N ST6
aF, female; M, male; Y, cirrhosis was present; N, cirrhosis was not present.
on November 7, 2019 by guest
http://jvi.asm.org/
[image:2.585.299.544.474.690.2]Clonal analysis.IgG-bound virion RNA was isolated and the E1-E2 region amplified. Amplicon-positive samples were initially purified and sequenced (Eurofins Genomics). In cases where multiple peaks were ob-served in the trace files, a panel of clones was generated as previously described (26).
UDPS data generation, handling, and error correction.Amplicons were quantified using a Biophotometer machine (Eppendorf) and diluted to a final concentration of 1⫻107molecules/ml. Pyrosequencing was performed using a 454 GS FLX titanium platform with sample-specific multiplex identifier sequence-adapted libraries for Lib-1 sequencing (Roche 454 Life Sciences, Branford, CT). Raw sff data files were first un-coupled into individual patient sample files by using SFFFile tools (Roche). Low-quality reads and reads shorter than 90% of the expected amplicon lengths were removed.
The resultant data files were sequentially processed through imple-mentation of thek-mer error correction (KEC) and empirical thresh-old algorithms as previously described, using the parametersk⫽25 andi⫽3 (22,27). A panel of clonal sequences temporally matched to the UDPS data was used to further identify and correct homopolymer errors (22, 25). Following this procedure, no erroneous sequences were present at a frequency of⬎0.1% in the homogeneous plasmid control sample. Consequently, all haplotypes present at a frequency of⬎0.1% in their respective samples were retained for downstream analysis.
1-step andk-step network construction.To study the dynamics of intrahost quasispecies evolution, we created two networks for each patient (28). First, all unique haplotypes (318 bp) were aligned, and the Hamming distance between each pair was calculated. Connected components were then built, in which each unique haplotype was represented by a node and two nodes were connected by an edge if the distance between them was 1. Initially, the components were independent of one another and together formed a 1-step network.
The 1-step network of most patients consisted of several components. To join them together,k-step networks were constructed as follows: iter-atively fork⫽2, 3, . . ., until all pairs of haplotypes from different com-ponents with a distance equal tokwere found. They were linked by edges,
and the components were recalculated. These steps were repeated until a single connected component was formed. The resultingk-step network is equivalent to the union of all minimum spanning trees. The analysis and network visualization were performed with MATLAB R2014b (The MathWorks, Inc.) and Pajek (29).
Bioinformatic analyses.MEGA6 was used to calculate Hamming distances and synonymous and nonsynonymous substitution rates (30). Phylogenetic trees were drawn in MEGA6, using a general time-reversible model with gamma-distributed and invariant sites. The time-ordered Shannon diversity (H) of 1-step networks was calculated using the following formula:H⫽ ⫺
兺
iN⫽1pi⫻lnpi, wherepiis thetotal frequency of haplotype componentiin the 1-step network andN
is the number of components of the 1-step network (richness). The evenness (EH) of the 1-step network was determined using the
follow-ing formula:EH⫽H⁄ lnN.
Three patients were identified as containing mixed lineages. In each instance, the components comprising the dominant lineage were analyzed separately from the minor lineages. Prior to calculation of the Shannon diversity index, the total frequency of the dominant lineage components was normalized to 1 to account for the absence of the minor lineage.
Amino acid conservation plots were drawn using the Jalview program, which is based on analysis of multiply aligned sequences (AMAS) to de-termine changes to the physiochemical properties of the constituent amino acids (31,32).
Nucleotide sequence accession numbers.UDPS data sets used in this study are available athttp://www.ucc.ie/liamfanning/hcv. Unique nucleotide sequences were deposited in GenBank and assigned accession numbers KT193821toKT193838.
[image:3.585.40.552.81.303.2]Statistical analysis.All statistical analyses were performed using R 3.1.3. The statistical significance of comparisons was analyzed using the nonparametric Mann-Whitney U test. Where appropriate, the nonindependence of intrapatient samples was accounted for by aver-aging the individual values, which were then used for statistical com-parisons. In all tests,Pvalues of⬍0.05 were considered statistically significant.
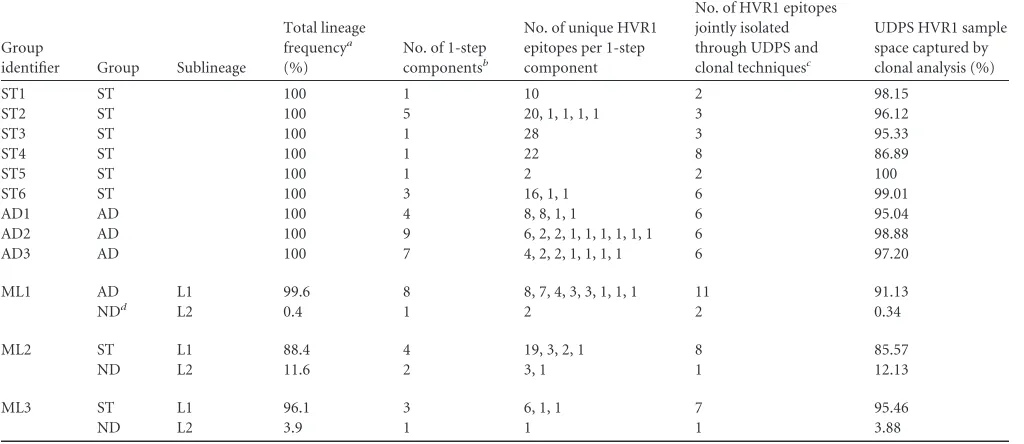
TABLE 2Inter- and intracomponent HVR1 epitope distribution
Group
identifier Group Sublineage
Total lineage frequencya (%)
No. of 1-step componentsb
No. of unique HVR1 epitopes per 1-step component
No. of HVR1 epitopes jointly isolated through UDPS and clonal techniquesc
UDPS HVR1 sample space captured by clonal analysis (%)
ST1 ST 100 1 10 2 98.15
ST2 ST 100 5 20, 1, 1, 1, 1 3 96.12
ST3 ST 100 1 28 3 95.33
ST4 ST 100 1 22 8 86.89
ST5 ST 100 1 2 2 100
ST6 ST 100 3 16, 1, 1 6 99.01
AD1 AD 100 4 8, 8, 1, 1 6 95.04
AD2 AD 100 9 6, 2, 2, 1, 1, 1, 1, 1, 1 6 98.88
AD3 AD 100 7 4, 2, 2, 1, 1, 1, 1 6 97.20
ML1 AD L1 99.6 8 8, 7, 4, 3, 3, 1, 1, 1 11 91.13
NDd L2 0.4 1 2 2 0.34
ML2 ST L1 88.4 4 19, 3, 2, 1 8 85.57
ND L2 11.6 2 3, 1 1 12.13
ML3 ST L1 96.1 3 6, 1, 1 7 95.46
ND L2 3.9 1 1 1 3.88
a
Averaged across all three samples.
bAll HVR1 variants within any one component can be linked to at least one other variant within that component by a single amino acid substitution. c
See reference25.
dND, not determined.
on November 7, 2019 by guest
http://jvi.asm.org/
RESULTS
Characterization of the patient cohort.Twelve treatment-naive
patients chronically infected with either HCV genotype 1 (n⫽6) or genotype 3a (n⫽6) comprised the study cohort. Initial geno-type identification was performed using the Versant hepatitis C virus genotype assay (LiPA) 1.0, targeting the 5=untranslated re-gion. This procedure identified all six genotype 1 patients as hav-ing subtype 1b virus (25). Reanalysis of both the 5=untranslated region and the core by using LiPA 2.0 categorized patients 1 and 2 as having subtype 1a viruses. This result was confirmed by phylo-genetic analysis of patient consensus sequences against reference 1a, 1b, and 3a sequences (Fig. 1andTable 1).
In our hands, clonal analysis accounted for (on average) 96.3% occupation of the HVR1 variant sample space identified through UDPS (range, 86.9% to 100%). However, this translated to⬍34% of the unique HVR1 variant sequence space present in the UDPS data set (Table 2) (25). Frequency selection bias toward the dom-inant epitope in the clonal data was evident, as 34/35 HVR1 vari-ants, with a UDPS sample-specific frequency of⬎5%, were also described clonally (25).
k-step network analysis of patient viromes.To better explore
sequence evolution over the sampling time frame, visualization of UDPS data was performed by generating ak-step network for each of the 12 patients. The initial 1-step network was comprised of
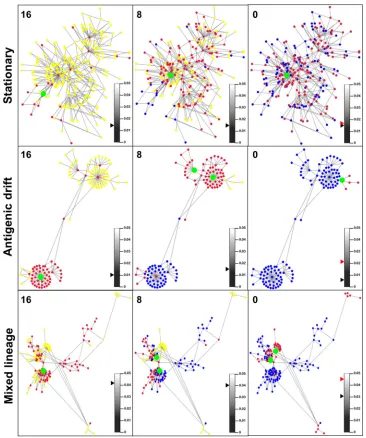
FIG 2Representativek-step network graphs for stationary (ST3), antigenic drift (AD1), and mixed-lineage (ML1) viromes. Unique haplotypes with frequencies of⬎0.1% of the sample space are displayed. Individual panels are given for 16 weeks pretreatment, 8 weeks pretreatment, and immediately prior to commence-ment of treatcommence-ment (0 weeks). Red nodes identify unique time point-specific haplotypes, yellow nodes identify future haplotypes, and blue nodes identify haplotypes from an earlier sample that were not detected in the given sample. Green nodes denote sample-specific haplotypes that occupied⬎10% of the sample space at that time. The maximum distance between any two haplotypes from separate 1-step components was 4 bp for ST3, 8 bp for AD1, and 18 bp for ML1. A black triangle juxtaposed to the color bar represents the relative Hamming distance for that samples. A red triangle represents the relative Hamming distance of haplotypes combined across all three samples.
on November 7, 2019 by guest
http://jvi.asm.org/
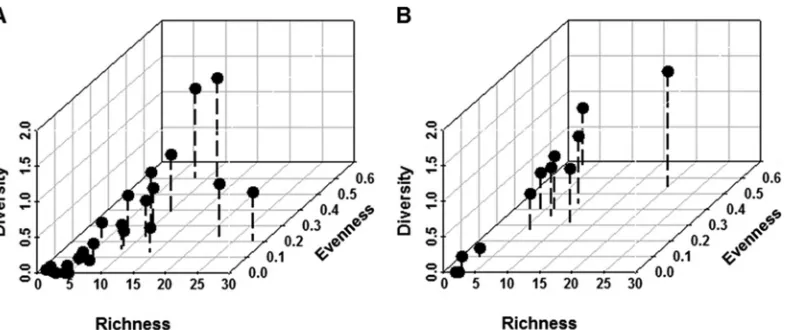
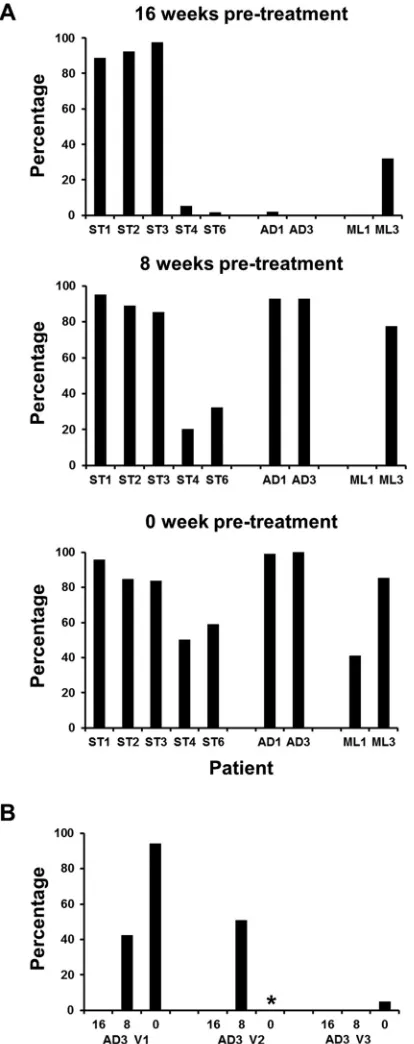
[image:4.585.109.475.64.502.2]FIG 3Temporal 1-step component frequency and composition. Over the 16-week sampling period, all components that formed the 1-step network graph were examined for fluctuations in the percentage of occupation of the sample space (stationary viromes [A] and antigenic drift viromes [B]) and the number of unique
on November 7, 2019 by guest
http://jvi.asm.org/
[image:5.585.53.526.70.694.2]components whose nodes (haplotypes) were connected by edges that represented a genetic distance of 1. In cases where one haplo-type could not be paired with a second in this manner, the com-ponent was comprised of that single haplotype.
The patient cohort was divided into three groups based on genetic and network characteristics, and representativek-step net-works for each group are given inFig. 2. First, viromes were clas-sified as stationary (ST) based on comparable sample-specific and combined Hamming distances. Within ST networks, haplotype emergence over the sampling period was within a localized se-quence space. The dominant haplotypes in each ST network re-mained largely fixed across the 16 weeks (Fig. 2, green nodes). Second, viromes were observed that exhibited a time-ordered spa-tial distribution of haplotypes toward naive sequence space. Much of the sequence heterogeneity was within HVR1, and such vi-romes were classified as undergoing antigenic drift (AD). The el-evated Hamming distance of combined AD samples compared to sample-specific Hamming distances also defined the intersample heterogeneity. The remaining viromes contained mixed-lineage (ML) virus subpopulations (Tables 1and2). With respect to the ML phenotype, the presence of a subpopulation was initially evi-dent due to elevated between-component distances (⬎16 bp) within thek-step network. These separations were later confirmed through a phylogenetic analysis using the maximum likelihood method, based on a general time-reversible model. Bootstrap val-ues of ⬎98% for 1,000 resamplings were recorded (data not shown). The dominant lineage in each of the ML viromes was partitioned away from minor lineage haplotypes and designated either ST or AD for downstream analysis. ML1 exhibited an anti-genic drift phenotype. ML2 and ML3 were classified as stationary (Table 1). Minor lineages within each ML virome either were not detectable in all three samples or had too few unique haplotypes to be classified formerly as ST or AD (Table 2).
All 12 patients’k-step networks contained 1 to 4 dominant haplotypes (present at ⬎10% of the sample sequence space)
(Fig. 2, green nodes). Thirty-four of 36 samples contained a single haplotype that accounted for⬎25% of the sample space (the max-imum recorded was 98.7%, for the AD1, 0-week sample). The dominant haplotype was centrally placed within the network and contained the highest edge degree (Fig. 2). The majority of edges to the dominant haplotype were reflective of synonymous substi-tution events.
1-step components reveal virome connectedness.For each
patient network, the composition of the constituent components was analyzed over time (Fig. 3). ST patients were largely defined by a single dominant component that persisted across the 16-week sampling period and varied substantively only by the constituent numbers of unique haplotypes. The sequence depth achieved here facilitated the construction of a 1-step network (defined as being comprised of a single connected component) for ST1 sequences (Fig. 3). The majority of ST networks were formed from a single dominant component and multiple low-frequency components containing few unique haplotypes. In contrast, AD networks ex-hibited a temporal component dominance that was observed to change between sample points (Fig. 3BandD).
Partitioning of the patient data into 1-step components al-lowed for (i) haplotypes to be grouped together by the nearest evolutionary linkages and (ii) component stability over time to be assessed quantitatively. In this study, virome richness was defined as the number of components that accounted for all sequences within a sample-specific 1-step network. Shannon diversity and evenness are commonly used to characterize species diversity in a community. We applied this approach to our data by assuming that each component is analogous to a species and that, together, the components comprise the community. Evenness values ap-proaching zero indicate a skewed component dominance within the network (e.g., ST1 is uneven because it contains only one com-ponent) (Fig. 3A). Overall, ST samples demonstrated restrictive exploration of the sequence space, which is indicative of compo-nent stability and dominance (Fig. 4). Nineteen of the 24 patient
FIG 4Richness, Shannon diversity, and evenness values for individual-sample 1-step networks. For each 1-step network (n⫽36), the constituent component profile was assessed. (A) A total of 19/24 1-step ST networks were concentrated in the lower left quadrants for all three parameters examined. (B) A total of 6/12 1-step AD networks were concentrated in the lower left quadrants for all three parameters examined.
haplotypes (stationary viromes [C] and antigenic drift viromes[D]). Each component was comprised of a single haplotype (black) or existed as a connected component where the constituent haplotypes differed by a single nucleotide substitution from at least one other haplotype across the length of the amplicon sequence (318 bp). Time is represented on thexaxis, and the specific component identifier by patient is shown on theyaxis. Ranges are defined by the color bars.
on November 7, 2019 by guest
http://jvi.asm.org/
[image:6.585.99.492.65.230.2]samples for group ST occupied the lower left quadrants for all three measures of the 1-step network components (Fig. 4A). Taken together, the data indicated that ST viromes were stably maintained for 16 weeks.
HVR1 evolution is markedly conservative in ST patient
vi-romes. Partitioning of the conserved E1 region (195 bp) and
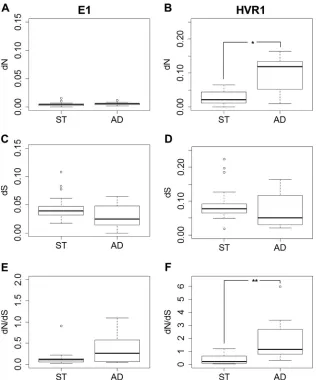
HVR1 (81 bp) distinguished nonsynonymous mutation at HVR1 as the main determinant differentiating ST and AD phenotypes (Fig. 5B). The ratio of nonsynonymous to synonymous evolution-ary changes (dN/dS) for the HVR1 portions of ST sequences indi-cated that HVR1 was predominantly under purifying selection pressures (Fig. 5F). Significant differences in age and the presence or absence of cirrhosis between ST and AD patients were also observed (Pvalue⫽0.017). All patients were chronically infected for at least 3 years (25). The parameters of age and cirrhosis were introduced as additional surrogate markers for the duration of infection, and HVR1 evolution was subsequently viewed in this context (33–35).
Separation of the patient cohort into ST and AD viromes was
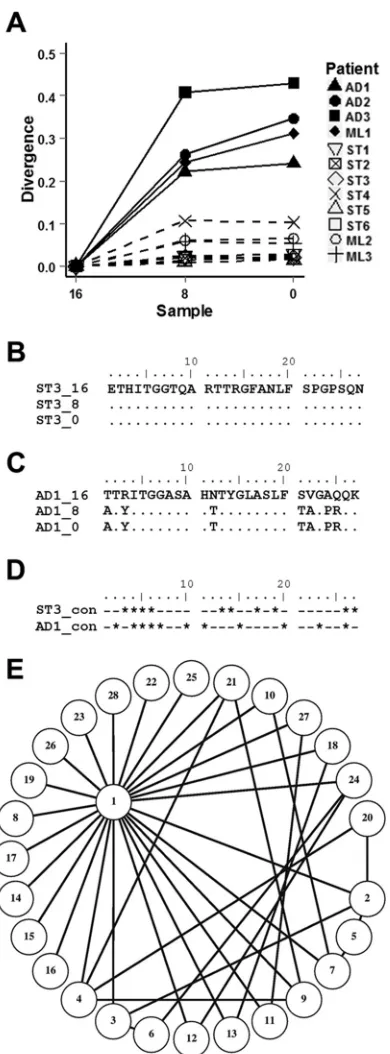
also evident from the divergence of the HVR1 pool from the initial samples (Fig. 6A) (P⬍0.01). All patients identified as AD patients fromk-step network analysis showed marked separation of the HVR1 epitope away from the original quasispecies. This was in contrast to ST patients, who demonstrated minimal movement of the HVR1 quasispecies over time. The dominance of individual HVR1 variants within ST viromes was fixed, with little evidence of epitope evolution (Fig. 6B). In contrast, the dominant HVR1 for AD group viromes was seen to change at multiple sites within 8 weeks (Fig. 6C). Nevertheless, the mutational capacities of HVR1 were similar for both ST3 and AD1. Sequence analysis across all unique ST3 and AD1 HVR1 variants isolated revealed that just 10/27 and 11/27 sites, respectively, were conserved (Fig. 6D).
Unique HVR1 variants from each sample set were subjected to 1-step network analysis as detailed previously for the nucleotide data, and variants linked by a single amino acid substitution were assigned to 1-step components. The entire HVR1 variant pool for ST1, ST3, ST4, and ST5 formed a single 1-step component, with the dominant HVR1 exhibiting the highest edge degree (Table 2
FIG 5dN,dS, anddN/dSvariations between patient groups ST and AD examined across E1 (195 bp) and HVR1 (81 bp) sections of the amplicon sequence. (A and B) Number of nonsynonymous mutations per nonsynonymous site. (C and D) Number of synonymous mutations per synonymous site. (E and F)dN/dS
ratios. When a patient was identified as containing a mixed-lineage virome, the dominant lineage was assigned to either the ST or AD group, where possible (Table 2), and analyzed independently from the minor lineage. Statistically significant differences in averaged sample values (to account for nonindependent intrahost sampling) are indicated by asterisks (**,P⬍0.005; *,P⬍0.05).
on November 7, 2019 by guest
http://jvi.asm.org/
[image:7.585.135.451.65.445.2]andFig. 6E). Remarkably, for ST5, only two unique HVR1 vari-ants (occupying 99.9% and 0.1% of the sample space) were recov-ered from three independent sample preparations and⬎10,000 individual reads sequenced. For ST2 and ST6, across all three sam-pling points combined, the dominant HVR1 1-step component accounted for 96.9% and 99.8% of the sample space, respectively. In contrast, the dominant HVR1 1-step components for AD1, AD2, and AD3 accounted for 62.4%, 33.3%, and 49.1% of the sample space, respectively.
AD HVR1 variant pools demonstrate pronounced
physio-chemical changes.HVR1 microdomains participating in SRBI
interactions, influencing infectivity and encompassing a neutral-izing epitope, have been defined for the H77 HVR1 variant (16). We sought to map the observed HVR1 mutations within our data to these sites (Fig. 7).
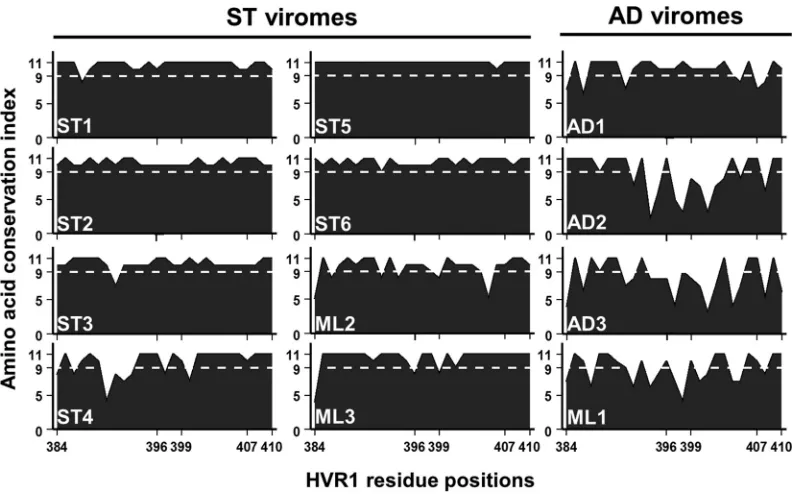
As anticipated, conservative changes were observed for the ma-jority of ST HVR1 sites. The most noticeable exception was for ST4, which had the largest recorded HVR1 divergence of the ST group (Fig. 6A). A considerable proportion of this change oc-curred within the SRBI interacting microdomain (Fig. 7, residues 384 to 396). AD viromes, with the exception of AD1, exhibited high diversity within the proposed nAb epitope for H77 and resi-dues 397 and 398, which are linked to infectivity (Fig. 7) (16). Additionally, the changes were for nonconservative amino acids. Within this domain, residues 403, 406, and 407 emerged as highly conserved across all viromes, which is suggestive of a discrete pres-ervation of function. Overall, the pattern of diverse mutational change seen for AD sequences implicates nAb targeting and the modulation of processes governing infectivity.
IgG binding of virions is associated with the dominant HVR1
amino acid epitope.We previously showed that IgG-bound
viri-ons can be fractionated away from IgG-free viriviri-ons through affin-ity chromatography (22,26,36). In this study, the HVR1 profile of IgG-bound virions in the 0-week samples was determined, and the prevalence of the IgG-associated HVR1 motifs over the 16-week sampling period was evaluated retrospectively.
Ten of the 12 patients were positive for HCV RNA following IgG fractionation (ST5 and AD2 were identified as negative for HCV RNA in the IgG-bound sample). In cases where the pre-dicted HVR1 of IgG-bound virions initially occupied⬎80% of the sample space, it remained so for the subsequent samples. In cases where the predicted HVR1 of IgG-bound virions was initially be-tween 0 and 40%, the occupation of the sample space expanded by an additional 25 to 95% (Fig. 8A). The homogeneity of ST group samples was clear for ST1, ST2, and ST3, as a single HVR1 amino acid motif accounted for⬎80% of the total virome across all three sampling points. IgG binding was associated with virus sequences that coded for the 0-week dominant HVR1 variant in ST4, ST6, and ML2 (Fig. 8A). Within the latter three viromes, the between-sample dominant HVR1 variants differed by a single amino acid substitution event (data not shown). With respect to ML2, the HVR1 variant identified following IgG fractionation formed part of the minor lineage variant pool (Table 2).
HVR1 epitope heterogeneity was observed in just 2 of the 10 IgG-bound virus RNA-positive samples, both of which had AD group viromes (AD3 and ML1, respectively). For AD1 and AD3, the predicted HVR1 of IgG-bound virions was present at⬍2% of the 16-week sample space and rose to⬎90% in both subsequent samples (Fig. 8A). Given the positive selection of HVR1 in this group (Fig. 5F) and the pronounced nonconservative amino acid
FIG 6HVR1 evolution is conservative in ST group viromes. (A) HVR1 amino acid divergence from the original sample was calculated as the pairwise mean distance for ST patient viromes (dashed lines) and AD patient viromes (solid lines). The dominant ST3 HVR1 variant remained unchanged over the 16-week study period (B), whereas the AD1 HVR1 variant’s dominance altered between samples, with multiple mutations across the 27-amino-acid length of the epitope (C). (D) ST3 and AD1 HVR1 sequence conservation across all isolates demonstrates that ST3 variants retain mutational capacity. Conserved sites are denoted by asterisks, and variant sites are denoted by dashes. (E) All 28 unique HVR1 variants isolated from ST3 had a single amino acid separation from at least one other HVR1 motif within the sample set, as shown in the 1-step network graph. Variants are numbered in order of the averaged fre-quency across all three samples (for variant 1, 88.3%; and for variant 28, 0.06%).
on November 7, 2019 by guest
http://jvi.asm.org/
[image:8.585.69.264.64.591.2]substitutions within the putative nAb epitope (Fig. 7A, residues 399 to 407), the data support the hypothesis that, in both in-stances, these variants were subject to humoral immune targeting. This conclusion was further strengthened by the isolation of five unique AD3 HVR1 epitopes following IgG fractionation, three of which were detectable in the UDPS data (Fig. 8B). The sum of these data is that the AD3 HVR1 profile was indicative of antibody targeting and removal of variants, which reflected the between-sample dominant HVR1 profile.
While effective IgG binding of virions occurred for both the ST and AD phenotypes, only the AD3 HVR1 profile was indicative of neutralization during the 16-week time frame examined here. We previously reported that the predicted HVR1 of IgG-bound viri-ons was associated with the collapse of the cviri-onstituent virion pop-ulation in a process that was measured in years rather than weeks or months (22). Consequently, the 16-week study period is likely to be insufficient to determine the full extent of neutralization efficacy of the antibody response. However, the antibody reper-toire does appear to be capable of readily recognizing virions as new HVR1 epitopes emerge from the background variant pool, regardless of HVR1 phenotype (Fig. 8).
DISCUSSION
Visualization of the data through the generation ofk-step net-works and analysis of the constituent 1-step network components revealed viromes governed by either stably or temporally domi-nant master sequences. We categorized these phenotypes as ST or AD based on the evident evolutionary divergence within the se-quence sets. ST virome HVR1 variant pools converged around the dominant HVR1 epitope, with most variants separated from the dominant epitope by a single amino acid substitution. IgG
bind-ing of virions was associated with the sample-specific dominant HVR1 in both ST and AD groups but was indicative of neutraliza-tion only for AD3 variants during the study period.
Despite a large volume of research documenting the genetic variability of HVR1, discrete windows of intrahost evolution in chronic infection are lacking in the literature. Initial clonal analy-sis of samples, collected at 2-week intervals over 16 weeks, identi-fied both divergent and stationary HVR1 evolutionary pheno-types (25). In the present study, UDPS was utilized to scrutinize this window of HVR1 evolution in treatment-naive patients, all of whom were chronically infected with HCV for at least 3 years. Next-generation sequencing technologies facilitate a more com-plete mining of the quasispecies pool. Our analysis concurs with estimates that variants present at a frequency of⬎5% of the sam-ple space are reliably detectable using clonal methods (37,38). Nevertheless, ST and AD phenotype classification was not achiev-able through clonal analysis, as the true quasispecies spectrum was masked by a few dominant sequences (Table 2).
For all 12 patients, the sample-specific viromes were organized around dominant haplotypes or master sequences that were highly connected to the quasispecies pool, largely through single-point synonymous substitutions (Fig. 2and3). ST viromes were relatively homogeneous and explored a narrow sequence space. Additionally, significant associations of ST viromes were made with older patients and patients with cirrhosis (Table 1). While sequence heterogeneity and rapid virus evolution have been asso-ciated with the initial development of fibrosis, the homogeneous viromes seen here may be a reflection of further advancement of liver disease (39–41). Indeed, HCV viromes with low-diversity HVR1 variant pools have, over time, been linked to increasing disease severity (42).
FIG 7Amino acid conservation of patient-specific HVR1 variant pools is pronounced among ST viromes. An amino acid physiochemical conservation plot was prepared for each of the 12 patients, based on the AMAS method of multiple-sequence alignment, and scored (yaxis). Values of⬎9 reflect ultraconservative changes or absolute conservation (dashed white lines). Functional microdomains as characterized by Guan et al. (16) for the H77 HVR1, which are purported to participate in SRBI interactions (residues 384 to 396) and to contain a nAb epitope (residues 399 to 407), are identified (xaxis), while residues 397 and 398 and 408 to 410 modulate infectivity. HVR1 residues are numbered in accordance to the H77 reference genome.
on November 7, 2019 by guest
http://jvi.asm.org/
[image:9.585.94.492.65.312.2]We report significant differences between ST and AD group haplotype profiles solely in the exploration of nonsynonymous sequence space across HVR1 and the subsequent divergence from the initial sample (Fig. 5and6). The intriguing observation with respect to ST HVR1 variant pools was the interconnectedness of the dominant HVR1 variant to remaining minor variants, largely through single amino acid point mutations (Fig. 6E). We previ-ously detailed an HCV genotype 4a mixed-lineage infection in which a low-diversity minor lineage expanded into the sample space over a period of 10 years, to dominate the viromein toto
during the last 2 years (percentage sample space minimum, 0.4%; and maximum, 96.9%) (22). A conservative pattern of synony-mous mutation was observed that parallels the ST phenotypes reported here, with the distinction that the HVR1 variant domi-nated the sample space for years rather than weeks.
We did not observe differences between ST and AD patients with respect to IgG binding, and we cannot exclude the possibility that epitopes outside the N terminus of E2 may exhibit immu-nodominance. However, significant differences distinguished hu-moral immune targeting of the HVR1 ST and AD variant pools. AD HVR1 epitopes were under strong positive selection pressures and exhibited frequent variant replacement rather than sequence diversification (Fig. 5). Furthermore, the predicted HVR1 profile of AD3 IgG-bound virions argues in favor of direct humoral im-mune targeting, and this is strengthened by the observation of pronounced nonconservative mutational changes in the putative nAb epitope of AD HVR1 variants (Fig. 7and8B) (16).
Lower levels of nucleotide substitution in HVR1 have been reported for patients with hypogammaglobulinemia, suggesting that sequence evolution in this region of the genome is primarily linked to humoral immune pressure (43–45). For each patient with detectable IgG binding of virions, the associated HVR1 vari-ant was dominvari-ant and centrally placed within the virome network (Fig. 6E), which has previously been associated with greater cross-immunoreactivity (46). However, given the short time frame and the commencement of treatment following the completion of this study, we were unable to confirm whether the HVR1 profile of detectable virus-antibody interactions seen for AD3 extended to the wider sample set.
ST viromes additionally displayed considerable global stability (Fig. 4). Original antigenic sin, the preferential activation of im-mune memory against a similar yet nonidentical antigen follow-ing a reinfection event, has been described for HCV, dengue virus, and influenza virus (47–49). The delayed removal of the dominant variant targeted by a weakened nAb response is known to extend to years (22,50). In the context of a convergent HVR1 variant pool, the presentation of successive, antigenically similar but non-identical epitopes (Fig. 6E) may impart a cumulative weakening of the nAb response required for effective virion neutralization (51– 53). Consequently, the minimum binding threshold required for vi-rion neutralization is more difficult to achieve, which concomitantly facilitates the maintenance of related minor variants (54,55). To-gether, the data support a model of antigenic cooperation enabled in viromes, organized around a single dominant variant (51).
FIG 8IgG binding of virions was associated with the dominant HVR1 in the 0-week sample. All samples taken on the day of treatment were subjected to fractionation of IgG-bound virions followed by extraction of virus genomes and determination of the predicted HVR1 epitopes. (A) UDPS data from pre-treatment samples (16 and 8 weeks prior) were retrospectively reviewed to assess the prevalence of HVR1 epitopes associated with IgG-bound virions. Thexaxis gives the patient identifier, and theyaxis gives the percentage of the sample space occupied by sequences containing the predicted IgG-bound HVR1. (B) Three AD3 HVR1 variants associated with IgG-bound virions (AD3_V1, accession number KT193831; AD3_V2, accession number KT193830; and AD3_V3, accession numberKT193829) were detectable in the UDPS data. Partition analysis by variant revealed that IgG binding was asso-ciated with variant emergence and removal. Specifically, the AD3_V2 epitope was isolated only from the IgG-bound fraction, not from UDPS analysis of
whole serum, for the 0-week sample (asterisk). In the 8-week sample, this variant accounted for 50.8% of the UDPS sample space. Theyaxis gives the percentage of sample space occupation of the predicted IgG-bound HVR1, and thexaxis defines the IgG-bound variant occupation of the sample space by time point.
on November 7, 2019 by guest
http://jvi.asm.org/
[image:10.585.62.269.70.592.2]The persistent dominance of specific HVR1 epitopes indicates diminished humoral immune pressures. Indeed, stronger nAb cross-reactivity with historic than with current HVR1 epitopes has been shown (50). Alleviation of potentially deleterious nonsyn-onymous mutations forced upon this region allows for enhance-ment of fitness through exploration of the synonymous sequence space (56). In the context of an error-prone polymerase and a high replication rate, the maintenance of singly dominant HVR1 epitopes over weeks (as observed here) and years is indicative of host adaptation and/or the maintenance of functional advantages (21,22,57).
The acquisition of host-specific adaptions to HVR1 has the potential to enhance infectivity and receptor recognition (16,58– 60). As the within-host period of infection extends, we predict a preferential evolution toward ST rather than continued rapid and nonconservative epitope change. Based on our observations over 16 weeks, AD1 is moving toward an ST group phenotype given the contraction of the network to a single 1-step component in the 0-week sample (Fig. 2and3). We note that the adaptive capacity of HVR1 is retained regardless of the specific mutational phenotype (Fig. 6D), and we recognize that reversion between phenotypes over time is feasible, depending on the within-host environment (57).
In summary, homogeneous HVR1 populations arise as a con-sequence of long-term, host-specific, pervasive humoral immune selection. Complex viromes reflect a population dynamic that ex-plores a more expansive sequence space in an attempt to find within-host fitness optima. The benefits of nearly clonal HVR1 dominance in the virus are ill defined, but this phenomenon does imply adaptation of HCV to its host.
ACKNOWLEDGMENTS
Daniel Schmidt-Martin was funded by Molecular Medicine Ireland through the Clinician Scientist Structured Training Programme.
We thank David S. Campo (Division of Viral Hepatitis, Centers for Disease Control and Prevention) for his assistance with 1-step andk-step network visualization.
REFERENCES
1.Yamane D, McGivern DR, Masaki T, Lemon SM.2013. Liver injury and disease pathogenesis in chronic hepatitis C. Curr Top Microbiol Immunol
369:263–288.http://dx.doi.org/10.1007/978-3-642-27340-7_11. 2.Gower E, Estes C, Blach S, Razavi-Shearer K, Razavi H.2014. Global
epidemiology and genotype distribution of the hepatitis C virus infection. J Hepatol61:S45–S57.http://dx.doi.org/10.1016/j.jhep.2014.07.027. 3.Santantonio T, Wiegand J, Gerlach JT.2008. Acute hepatitis C: current
status and remaining challenges. J Hepatol49:625– 633.http://dx.doi.org /10.1016/j.jhep.2008.07.005.
4.Choo QL, Kuo G, Weiner AJ, Overby LR, Bradley DW, Houghton M.
1989. Isolation of a cDNA clone derived from a blood-borne non-A, non-B viral hepatitis genome. Science244:359 –362.http://dx.doi.org/10 .1126/science.2523562.
5.Smith BD, Morgan RL, Beckett GA, Falck-Ytter Y, Holtzman D, Ward JW.2012. Hepatitis C virus testing of persons born during 1945–1965: recommendations from the Centers for Disease Control and Prevention. Ann Intern Med157:817– 822.http://dx.doi.org/10.7326/0003-4819-157 -9-201211060-00529.
6.Smith DB, Bukh J, Kuiken C, Muerhoff AS, Rice CM, Stapleton JT, Simmonds P.2014. Expanded classification of hepatitis C virus into 7 genotypes and 67 subtypes: updated criteria and genotype assignment web resource. Hepatology59:318 –327.http://dx.doi.org/10.1002/hep.26744. 7.Messina JP, Humphreys I, Flaxman A, Brown A, Cooke GS, Pybus OG,
Barnes E.2015. Global distribution and prevalence of hepatitis C virus genotypes. Hepatology61:77– 87.http://dx.doi.org/10.1002/hep.27259. 8.Weiner AJ, Brauer MJ, Rosenblatt J, Richman KH, Tung J, Crawford K,
Bonino F, Saracco G, Choo QL, Houghton M, Han JH.1991. Variable
and hypervariable domains are found in the regions of HCV correspond-ing to the flavivirus envelope and NS1 proteins and the pestivirus envelope glycoproteins. Virology180:842– 848.http://dx.doi.org/10.1016/0042 -6822(91)90104-J.
9.Khan AG, Whidby J, Miller MT, Scarborough H, Zatorski AV, Cygan A, Price AA, Yost SA, Bohannon CD, Jacob J, Grakoui A, Marcotri-giano J.2014. Structure of the core ectodomain of the hepatitis C virus envelope glycoprotein 2. Nature509:381–384.http://dx.doi.org/10.1038 /nature13117.
10. Dowd KA, Netski DM, Wang XH, Cox AL, Ray SC.2009. Selection pressure from neutralizing antibodies drives sequence evolution during acute infection with hepatitis C virus. Gastroenterology136:2377–2386. http://dx.doi.org/10.1053/j.gastro.2009.02.080.
11. Farci P, Shimoda A, Coiana A, Diaz G, Peddis G, Melpolder JC, Strazzera A, Chien DY, Munoz SJ, Balestrieri A, Purcell RH, Alter HJ.2000. The outcome of acute hepatitis C predicted by the evolution of the viral quasispecies. Science 288:339 –344.http://dx.doi.org/10 .1126/science.288.5464.339.
12. Bartosch B, Verney G, Dreux M, Donot P, Morice Y, Penin F, Paw-lotsky JM, Lavillette D, Cosset FL.2005. An interplay between hyper-variable region 1 of the hepatitis C virus E2 glycoprotein, the scavenger receptor BI, and high-density lipoprotein promotes both enhancement of infection and protection against neutralizing antibodies. J Virol79:8217– 8229.http://dx.doi.org/10.1128/JVI.79.13.8217-8229.2005.
13. Dao Thi VL, Granier C, Zeisel MB, Guerin M, Mancip J, Granio O, Penin F, Lavillette D, Bartenschlager R, Baumert TF, Cosset FL, Dreux M.2012. Characterization of hepatitis C virus particle subpopulations reveals multiple usage of the scavenger receptor BI for entry steps. J Biol Chem287:31242–31257.http://dx.doi.org/10.1074/jbc.M112.365924. 14. Wahid A, Dubuisson J.2013. Virus-neutralizing antibodies to hepatitis C
virus. J Viral Hepat20:369 –376.http://dx.doi.org/10.1111/jvh.12094. 15. Farci P, Shimoda A, Wong D, Cabezon T, De Gioannis D, Strazzera A,
Shimizu Y, Shapiro M, Alter HJ, Purcell RH. 1996. Prevention of hepatitis C virus infection in chimpanzees by hyperimmune serum against the hypervariable region 1 of the envelope 2 protein. Proc Natl Acad Sci U S A93:15394 –15399.http://dx.doi.org/10.1073/pnas.93.26.15394. 16. Guan M, Wang W, Liu X, Tong Y, Liu Y, Ren H, Zhu S, Dubuisson J,
Baumert TF, Zhu Y, Peng H, Aurelian L, Zhao P, Qi Z.2012. Three different functional microdomains in the hepatitis C virus hypervariable region 1 (HVR1) mediate entry and immune evasion. J Biol Chem287:
35631–35645.http://dx.doi.org/10.1074/jbc.M112.382341.
17. Hijikata M, Kato N, Ootsuyama Y, Nakagawa M, Ohkoshi S, Shimo-tohno K.1991. Hypervariable regions in the putative glycoprotein of hepatitis C virus. Biochem Biophys Res Commun175:220 –228.http://dx .doi.org/10.1016/S0006-291X(05)81223-9.
18. Bull RA, Luciani F, McElroy K, Gaudieri S, Pham ST, Chopra A, Cameron B, Maher L, Dore GJ, White PA, Lloyd AR.2011. Sequen-tial bottlenecks drive viral evolution in early acute hepatitis C virus infection. PLoS Pathog7:e1002243.http://dx.doi.org/10.1371/journal .ppat.1002243.
19. Elena SF, Sole RV, Sardanyes J.2010. Simple genomes, complex inter-actions: epistasis in RNA virus. Chaos20:026106.http://dx.doi.org/10 .1063/1.3449300.
20. Gismondi MI, Díaz Carrasco JM, Valva P, Becker PD, Guzmán CA, Campos RH, Preciado MV.2013. Dynamic changes in viral population structure and compartmentalization during chronic hepatitis C virus in-fection in children. Virology 447:187–196. http://dx.doi.org/10.1016/j .virol.2013.09.002.
21. Ramachandran S, Campo DS, Dimitrova ZE, Xia GL, Purdy MA, Khudyakov YE.2011. Temporal variations in the hepatitis C virus intra-host population during chronic infection. J Virol85:6369 – 6380.http://dx .doi.org/10.1128/JVI.02204-10.
22. Palmer BA, Dimitrova Z, Skums P, Crosbie O, Kenny-Walsh E, Fan-ning LJ.2014. Analysis of the evolution and structure of a complex intra-host viral population in chronic hepatitis C virus mapped by ultradeep pyrosequencing. J Virol88:13709 –13721.http://dx.doi.org/10.1128/JVI .01732-14.
23. Li H, Hughes AL, Bano N, McArdle S, Livingston S, Deubner H, McMahon BJ, Townshend-Bulson L, McMahan R, Rosen HR, Gretch DR.2011. Genetic diversity of near genome-wide hepatitis C virus se-quences during chronic infection: evidence for protein structural conser-vation over time. PLoS One6:e19562.http://dx.doi.org/10.1371/journal .pone.0019562.
on November 7, 2019 by guest
http://jvi.asm.org/
24. Lu L, Tatsunori N, Li C, Waheed S, Gao F, Robertson BH.2008. HCV selection and HVR1 evolution in a chimpanzee chronically infected with HCV-1 over 12 years. Hepatol Res38:704 –716.http://dx.doi.org/10.1111 /j.1872-034X.2008.00320.x.
25. Schmidt-Martin D, Crosbie O, Kenny-Walsh E, Fanning LJ.2015. Intensive temporal mapping of hepatitis C hypervariable region 1 qua-sispecies provides novel insights into hepatitis C virus evolution in chronic infection. J Gen Virol 96:2145–2156. http://dx.doi.org/10 .1099/vir.0.000149.
26. Palmer BA, Moreau I, Levis J, Harty C, Crosbie O, Kenny-Walsh E, Fanning LJ.2012. Insertion and recombination events at hypervariable region 1 over 9.6 years of hepatitis C virus chronic infection. J Gen Virol
93:2614 –2624.http://dx.doi.org/10.1099/vir.0.045344-0.
27. Skums P, Dimitrova Z, Campo DS, Vaughan G, Rossi L, Forbi JC, Yokosawa J, Zelikovsky A, Khudyakov Y.2012. Efficient error correction for next-generation sequencing of viral amplicons. BMC Bioinformatics
13(Suppl 10):S6.http://dx.doi.org/10.1186/1471-2105-13-S10-S6. 28. Campo DS, Dimitrova Z, Yamasaki L, Skums P, Lau DT, Vaughan G,
Forbi JC, Teo CG, Khudyakov Y.2014. Next-generation sequencing reveals large connected networks of intra-host HCV variants. BMC Genomics
15(Suppl 5):S4.http://dx.doi.org/10.1186/1471-2164-15-S5-S4.
29. Batagelj V, Mrvar A.2004. Pajek—analysis and visualization of large networks, p 77–103.InJ¨unger M, Mutzel P (ed), Graph drawing software. Springer, Berlin, Germany.
30. Tamura K, Stecher G, Peterson D, Filipski A, Kumar S.2013. MEGA6: Molecular Evolutionary Genetics Analysis version 6.0. Mol Biol Evol30:
2725–2729.http://dx.doi.org/10.1093/molbev/mst197.
31. Waterhouse AM, Procter JB, Martin DM, Clamp M, Barton GJ.2009. Jalview version 2—a multiple sequence alignment editor and analysis workbench. Bioinformatics25:1189 –1191.http://dx.doi.org/10.1093 /bioinformatics/btp033.
32. Livingstone CD, Barton GJ.1993. Protein sequence alignments: a strat-egy for the hierarchical analysis of residue conservation. Comput Appl Biosci9:745–756.
33. Poynard T, Bedossa P, Opolon P.1997. Natural history of liver fibrosis progression in patients with chronic hepatitis C. The OBSVIRC, META-VIR, CLINIMETA-VIR, and DOSVIRC Groups. Lancet349:825– 832.
34. Hajarizadeh B, Grebely J, Dore GJ.2013. Epidemiology and natural history of HCV infection. Nat Rev Gastroenterol Hepatol10:553–562. http://dx.doi.org/10.1038/nrgastro.2013.107.
35. Pradat P, Voirin N, Tillmann HL, Chevallier M, Trepo C.2007. Progression to cirrhosis in hepatitis C patients: an age-dependent process. Liver Int27:
335–339.http://dx.doi.org/10.1111/j.1478-3231.2006.01430.x.
36. Moreau I, O’Sullivan H, Murray C, Levis J, Crosbie O, Kenny-Walsh E, Fanning LJ.2008. Separation of hepatitis C genotype 4a into IgG-depleted and IgG-enriched fractions reveals a unique quasispecies profile. Virol J
5:103.http://dx.doi.org/10.1186/1743-422X-5-103.
37. Polyak SJ, Faulkner G, Carithers RL, Jr, Corey L, Gretch DR.1997. Assessment of hepatitis C virus quasispecies heterogeneity by gel shift analysis: correlation with response to interferon therapy. J Infect Dis175:
1101–1107.http://dx.doi.org/10.1086/516448.
38. McCaughan GW, Laskus T, Vargas HE.2003. Hepatitis C virus quasi-species: misunderstood and mistreated? Liver Transpl9:1048 –1052.http: //dx.doi.org/10.1053/jlts.2003.50260.
39. Domingo E, Sheldon J, Perales C.2012. Viral quasispecies evolution. Microbiol Mol Biol Rev76:159 –216.http://dx.doi.org/10.1128/MMBR .05023-11.
40. Lauring AS, Andino R.2010. Quasispecies theory and the behavior of RNA viruses. PLoS Pathog6:e1001005.http://dx.doi.org/10.1371/journal .ppat.1001005.
41. Wang XH, Netski DM, Astemborski J, Mehta SH, Torbenson MS, Thomas DL, Ray SC.2007. Progression of fibrosis during chronic hepa-titis C is associated with rapid virus evolution. J Virol81:6513– 6522.http: //dx.doi.org/10.1128/JVI.02276-06.
42. Sullivan DG, Bruden D, Deubner H, McArdle S, Chung M, Christensen C, Hennessy T, Homan C, Williams J, McMahon BJ, Gretch DR.2007. Hepatitis C virus dynamics during natural infection are associated with long-term histological outcome of chronic hepatitis C disease. J Infect Dis
196:239 –248.http://dx.doi.org/10.1086/518895.
43. Booth JC, Kumar U, Webster D, Monjardino J, Thomas HC. 1998. Comparison of the rate of sequence variation in the hypervariable region of E2/NS1 region of hepatitis C virus in normal and
hypogammaglobu-linemic patients. Hepatology27:223–227.http://dx.doi.org/10.1002/hep .510270134.
44. Landau DA, Saadoun D, Calabrese LH, Cacoub P.2007. The patho-physiology of HCV induced B-cell clonal disorders. Autoimmun Rev
6:581–587.http://dx.doi.org/10.1016/j.autrev.2007.03.010.
45. Gisbert JP, Garcia-Buey L, Pajares JM, Moreno-Otero R.2005. System-atic review: regression of lymphoproliferative disorders after treatment for hepatitis C infection. Aliment Pharmacol Ther21:653– 662.http://dx.doi .org/10.1111/j.1365-2036.2005.02395.x.
46. Campo DS, Dimitrova Z, Yokosawa J, Hoang D, Perez NO, Ramachan-dran S, Khudyakov Y.2012. Hepatitis C virus antigenic convergence. Sci Rep2:267.http://dx.doi.org/10.1038/srep00267.
47. Proust B, Dubois F, Bacq Y, Le Pogam S, Rogez S, Levillain R, Goudeau A.2000. Two successive hepatitis C virus infections in an intravenous drug user. J Clin Microbiol38:3125–3127.
48. Kim JH, Skountzou I, Compans R, Jacob J.2009. Original antigenic sin responses to influenza viruses. J Immunol183:3294 –3301.http://dx.doi .org/10.4049/jimmunol.0900398.
49. Midgley CM, Bajwa-Joseph M, Vasanawathana S, Limpitikul W, Wills B, Flanagan A, Waiyaiya E, Tran HB, Cowper AE, Chotiyarnwong P, Grimes JM, Yoksan S, Malasit P, Simmons CP, Mongkolsapaya J, Screaton GR.2011. An in-depth analysis of original antigenic sin in den-gue virus infection. J Virol85:410 – 421.http://dx.doi.org/10.1128/JVI .01826-10.
50. von Hahn T, Yoon JC, Alter H, Rice CM, Rehermann B, Balfe P, Mc Keating JA.2007. Hepatitis C virus continuously escapes from neutralizing antibody and T-cell responses during chronic infection in vivo. Gastroenter-ology132:667– 678.http://dx.doi.org/10.1053/j.gastro.2006.12.008. 51. Skums P, Bunimovich L, Khudyakov Y.2015. Antigenic cooperation
among intrahost HCV variants organized into a complex network of cross-immunoreactivity. Proc Natl Acad Sci U S A112:6653– 6658.http: //dx.doi.org/10.1073/pnas.1422942112.
52. Parsons MS, Muller S, Kohler H, Grant MD, Bernard NF.2013. On the benefits of sin: can greater understanding of the 1F7-idiotypic repertoire freeze enhance HIV vaccine development? Hum Vaccin Immunother
9:1532–1538.http://dx.doi.org/10.4161/hv.24460.
53. Bartosch B, Bukh J, Meunier JC, Granier C, Engle RE, Blackwelder WC, Emerson SU, Cosset FL, Purcell RH.2003. In vitro assay for neutralizing antibody to hepatitis C virus: evidence for broadly conserved neutraliza-tion epitopes. Proc Natl Acad Sci U S A100:14199 –14204.http://dx.doi .org/10.1073/pnas.2335981100.
54. Meyer K, Banerjee A, Frey SE, Belshe RB, Ray R.2011. A weak neutral-izing antibody response to hepatitis C virus envelope glycoprotein en-hances virus infection. PLoS One 6:e23699.http://dx.doi.org/10.1371 /journal.pone.0023699.
55. Dowd KA, Pierson TC.2011. Antibody-mediated neutralization of fla-viviruses: a reductionist view. Virology411:306 –315.http://dx.doi.org/10 .1016/j.virol.2010.12.020.
56. Cuevas JM, Domingo-Calap P, Sanjuan R.2012. The fitness effects of synonymous mutations in DNA and RNA viruses. Mol Biol Evol29:17– 20.http://dx.doi.org/10.1093/molbev/msr179.
57. Farci P, Wollenberg K, Diaz G, Engle RE, Lai ME, Klenerman P, Purcell RH, Pybus OG, Alter HJ.2012. Profibrogenic chemokines and viral evolution predict rapid progression of hepatitis C to cirrhosis. Proc Natl Acad Sci U S A109:14562–14567. http://dx.doi.org/10.1073/pnas .1210592109.
58. Hsu M, Zhang J, Flint M, Logvinoff C, Cheng-Mayer C, Rice CM, McKeating JA. 2003. Hepatitis C virus glycoproteins mediate pH-dependent cell entry of pseudotyped retroviral particles. Proc Natl Acad Sci U S A100:7271–7276.http://dx.doi.org/10.1073/pnas.0832180100. 59. Bankwitz D, Steinmann E, Bitzegeio J, Ciesek S, Friesland M,
Herrmann E, Zeisel MB, Baumert TF, Keck ZY, Foung SK, Pecheur EI, Pietschmann T.2010. Hepatitis C virus hypervariable region 1 modulates receptor interactions, conceals the CD81 binding site, and protects con-served neutralizing epitopes. J Virol84:5751–5763.http://dx.doi.org/10 .1128/JVI.02200-09.
60. Prentoe J, Jensen TB, Meuleman P, Serre SB, Scheel TK, Leroux-Roels G, Gottwein JM, Bukh J.2011. Hypervariable region 1 differ-entially impacts viability of hepatitis C virus strains of genotypes 1 to 6 and impairs virus neutralization. J Virol85:2224 –2234.http://dx.doi .org/10.1128/JVI.01594-10.
![FIG 3 Temporal 1-step component frequency and composition. Over the 16-week sampling period, all components that formed the 1-step network graph wereexamined for fluctuations in the percentage of occupation of the sample space (stationary viromes [A] and antigenic drift viromes [B]) and the number of unique](https://thumb-us.123doks.com/thumbv2/123dok_us/142202.19346/5.585.53.526.70.694/frequency-composition-components-wereexamined-uctuations-percentage-occupation-stationary.webp)