This is the Accepted Version of a paper published in the
journal Plant, Cell & Environment:
Cernusak, Lucas A., Barbour, Margaret M., Arndt, Stefan K., Cheesman,
Alexander W., English, Nathan B., Feild, Taylor S., Helliker, Brent R.,
Holloway-Phillips, Meisha M., Holtum, Joseph A.M., Kahmen, Ansgar,
McInerney, Francesca A., Munksgaard, Niels C., Simonin, Kevin A., Song, Xin,
Stuart-Williams, Hilary, West, Jason B., and Farquhar, Graham D. (2016) Stable
isotopes in leaf water of terrestrial plants. Plant, Cell & Environment, 39 (5).
pp. 1087-1102.
http://dx.doi.org/10.1111/pce.12703
plants
23 4
Lucas A. Cernusak1, Margaret M. Barbour2, Stefan K. Arndt3, Alexander W. Cheesman1, 5
Nathan B. English4, Taylor S. Feild4, Brent R. Helliker5, Meisha M. Holloway-Phillips6, 6
Joseph A.M. Holtum4, Ansgar Kahmen7, Francesca A. McInerney8, Niels C. Munksgaard9,10, 7
Kevin A. Simonin11, Xin Song2, Hilary Stuart-Williams6, Jason B. West12, Graham D. 8 Farquhar6 9 10 11 1
College of Marine and Environmental Sciences 12
James Cook University, Cairns, Australia 13
14 2
Centre for Carbon, Water and Food, Faculty of Agriculture and Environment 15
The University of Sydney, Camden, Australia 16
17 3
School of Ecosystem and Forest Science 18
The University of Melbourne, Melbourne, Australia 19
20
4College of Marine and Environmental Sciences 21
James Cook University, Townsville, Australia 22
23 5
Department of Biology 24
University of Pennsylvania, Philadelphia, USA 25
26 6
Research School of Biology 27
The Australian National University, Canberra, Australia 28
29 7
Department of Environmental Sciences- Botany 30
University of Basel, Basel, Switzerland 31
32 8
Department of Earth Sciences 33
The University of Adelaide, Adelaide, Australia 34
35 9
College of Science, Technology and Engineering 36
James Cook University, Cairns, Australia 37
38 10
Research Institute for the Environment and Livelihoods 39
Charles Darwin University, Darwin, Australia 40
41 11
Department of Biology 42
San Francisco State University, San Francisco, USA 43
44 12
Department of Ecosystem Science and Management 45
Texas A&M University, College Station, USA 46
This article has been accepted for publication in Plant, Cell & Environment and 48
undergone full peer review but has not been through the copyediting, 49
typesetting, pagination and proofreading process which may lead to 50
differences between this version and the Version of Record. Please cite this 51
article as doi: 10.1111/pce.12703 52
53
54
ABSTRACT 55
Leaf water contains naturally occurring stable isotopes of oxygen and hydrogen in 56
abundances that vary spatially and temporally. When sufficiently understood, these can be 57
harnessed for a wide range of applications. Here, we review the current state of knowledge 58
of stable isotope enrichment of leaf water, and its relevance for isotopic signals incorporated 59
into plant organic matter and atmospheric gases. Models describing evaporative enrichment 60
of leaf water have become increasingly complex over time, reflecting enhanced spatial and 61
temporal resolution. We recommend that practitioners choose a model with a level of 62
complexity suited to their application, and provide guidance. At the same time, there exists 63
some lingering uncertainty about the biophysical processes relevant to patterns of isotopic 64
enrichment in leaf water. An important goal for future research is to link observed variations 65
in isotopic composition to specific anatomical and physiological features of leaves that reflect 66
differences in hydraulic design. New measurement techniques are developing rapidly, 67
enabling determinations of both transpired and leaf water δ18O and δ2H to be made more 68
easily and at higher temporal resolution than previously possible. We expect these 69
technological advances to spur new developments in our understanding of patterns of stable 70
isotope fractionation in leaf water. 71
72
INTRODUCTION 74
In this review, we focus on how stable isotope ratios of oxygen and hydrogen vary in 75
leaf water. The stable isotope composition of leaf water significantly influences isotopic 76
signatures of a number of important biological and atmospheric processes. For example, the 77
oxygen isotope composition of leaf water partly controls the oxygen isotope compositions of 78
atmospheric CO2 (Farquhar et al. 1993; Cuntz et al. 2003; Welp et al. 2011) and atmospheric 79
O2 (Dole et al. 1954; Hoffmann et al. 2004; Luz & Barkan 2011). Sugars and other 80
metabolites formed in leaves incorporate the leaf water isotopic signal, which is then retained 81
in structural organic compounds, such as cellulose (Saurer, Aellen & Siegwolf 1997; Roden, 82
Lin & Ehleringer 2000; Barbour 2007; Gessler et al. 2014). The leaf water signal is also 83
preserved in leaf waxes (Smith & Freeman 2006; Sachse et al. 2010; Kahmen et al. 2013a; 84
Kahmen, Schefuss & Sachse 2013b), components of which can persist in the environment for 85
millions of years (Eglinton & Eglinton 2008). Thus, leaf water derived isotopic signals can 86
be useful for constraining models of the global carbon cycle, reconstructing past climates, 87
retrospectively analysing plant physiological responses to the environment, and for assigning 88
geographic origins to plant materials and plant-derived products (Dawson et al. 2002; West et 89
al. 2006b). All of these various applications rely on a firm understanding of the mechanisms
90
that control leaf water isotopic enrichment. 91
For plant water, isotopic abundances are generally expressed relative to the 92
international standard VSMOW (Vienna Standard Mean Ocean Water) (Coplen 2011). This 93
is accomplished using δ notation: 94
= , (1)
95
where Rp is the isotope ratio (e.g., 18O/16O or 2H/1H) of a plant water sample and RStd is that 96
of the standard. The resulting δ values are typically multiplied by 1000, so that the relative 97
deviation of the isotope ratio of the sample from that of the standard is expressed as per mil 98
(‰). 99
The stable isotope composition of plant water is influenced firstly by the plant’s 100
source water; this is mainly water taken up by roots from the soil. Soil water for terrestrial 101
plants generally derives from local precipitation. The stable isotope composition of 102
precipitation can vary both geographically and temporally. The δ18O and δ2H of precipitation 103
have been shown to vary in conjunction with temperature, altitude, latitude, distance from the 104
coast, and with the amount of precipitation falling in a given event (Rozanski, Araguas-105
Munksgaard et al. 2012). A representation of geographic variation in the δ18O and δ2H of 107
mean annual precipitation across the global land surface is shown in Figures 1A and 1B. 108
Any given precipitation event will mix into an existing soil water pool. Thus, 109
although there can exist relatively large variation in δ18O and δ2H from one precipitation 110
event to the next (Munksgaard et al. 2012; Munksgaard et al. 2015), the soil water pool being 111
accessed by plants will likely be buffered to some extent against these short term variations. 112
The extent to which the isotopic composition of the soil water pool can be linked to 113
individual precipitation events is an area of current interest (Tang & Feng 2001; Brooks et al. 114
2010; Thomas et al. 2013; Gessler et al. 2014). It is particularly relevant, for example, to the 115
detection of long-term records of tropical cyclone activity in tree rings (Miller et al. 2006), 116
because tropical cyclones are predominantly associated with isotopically light precipitation 117
(Gedzelman & Arnold 1994; Lawrence & Gedzelman 1996; Munksgaard et al. 2015). The 118
isotopic composition of soil water can also be affected by evaporation. This causes the soil 119
water near the evaporating front to become enriched in 18O and 2H compared to the soil water 120
at depth (Allison, Barnes & Hughes 1983; Barnes & Allison 1983). 121
For the most part, the isotopic composition of water in non-transpiring plant organs 122
(i.e., roots, stems, etc.) has been shown to match that of the water available to the plant in the 123
soil, indicating that there is little to no stable isotope fractionation associated with absorption 124
of water by roots and transport in xylem (White 1989; Ehleringer & Dawson 1992; Dawson 125
1993). The exception to this rule is that δ2H has been observed to shift with water uptake 126
and/or transport in salt tolerant coastal plants (Lin & Sternberg 1993) and phreatophytic 127
desert shrubs (Ellsworth & Williams 2007). No simultaneous δ18O fractionation was 128
observed, indicating that the cause of the isotope effect was specific only to hydrogen 129
isotopes in water and not oxygen isotopes, or that the isotope effect for oxygen was too small 130
to be detected. 131
Transpiration results in isotopic enrichment at the sites of evaporation within leaves. 132
The isotopically enriched water can then diffuse away from the evaporative sites into other 133
parts of the leaf. The resulting bulk leaf water enrichment generally shows a diurnal pattern, 134
with a daily maximum in the early afternoon associated with the minimum daily relative 135
humidity, and a daily minimum in the early morning reflecting a progressive relaxation of the 136
enrichment through the night (Figure 2). Enriched leaf water can also be transported in the 137
examine in detail the environmental and physiological controls over the stable isotope 139
enrichment of the evaporative sites and the bulk leaf water. 140
141
LEAF WATER 142
Evaporative sites 143
Isotopic enrichment of leaf water as a result of the evaporative process of 144
transpiration was first observed by Gonfiantini et al. (1965). In the same year, a model for 145
predicting the isotopic enrichment that should take place at the surface of an evaporating 146
body of water was published by Craig and Gordon (1965). This model can be applied to the 147
isotopic composition of water at the evaporative sites within leaves (δe). Here, it is 148
convenient to express the isotopic composition of the evaporative sites as enrichment in the 149
heavier isotopes compared to source water, to account for the influence of different source-150
water isotopic signatures among plants. The enrichment of any plant water sample above 151
source water (∆p) can be expressed as 152
∆= , (2)
153
where δp is the δ value of the plant water sample and δs is that of source water. Here again, 154
∆p, δp, and δs are often expressed as per mil. If this is the case, the δs in the denominator on 155
the right side of the equation must be divided by 1000. A list of the main symbols and 156
abbreviations used throughout the text is given in Table 1. 157
The Craig-Gordon model, as modified for application to leaves by subsequent authors 158
(Dongmann et al. 1974; Flanagan, Comstock & Ehleringer 1991; Farquhar & Lloyd 1993), 159
can be approximated by 160
∆≈ + + ∆− , (3)
161
where ∆e is the enrichment of evaporative site water above source water, ε+ is the equilibrium 162
fractionation between liquid water and vapour, εk is the kinetic fractionation for combined 163
diffusion through the stomata and the boundary layer, ∆v is the isotopic enrichment of 164
atmospheric vapour compared to source water, and wa/wi is the ratio of the water vapour mole 165
fraction in the air relative to that in the intercellular air spaces. Thus, wa/wi is the relative 166
humidity, but with the saturation water vapour mole fraction in the denominator calculated 167
for leaf temperature rather than air temperature. If leaf temperature and air temperature are 168
equal, wa/wi is exactly equal to the relative humidity of the air. The ∆v is calculated with 169
equilibrium isotope effect between liquid and vapour. Equation 3 is a convenient 171
approximation for the precise form of the model, as given by (Farquhar, Cernusak & Barnes 172
2007) 173
∆= 1 + 1 + 1 − +1 + ∆ − 1 . (4)
174
Note that in Eqn 3, the calculation can be readily performed with all isotopic terms expressed 175
as per mil, whereas for Eqn 4, it is more straightforward to make the calculation with the 176
isotopic terms not expressed as per mil, and then to multiply the result by 1000 afterward to 177
return to per mil notation. In the supplementary material, we provide a Microsoft Excel 178
spreadsheet with a combined data set of leaf water observations, which also contains a 179
worked example of how to perform the calculation shown in Eqn 4. The difference between 180
∆e calculated with Eqn 3 and that calculated with Eqn 4 is small for oxygen, on the order of 181
0.1‰. For hydrogen, it is larger, on the order of 1 to 2‰. 182
The equations shown above for predicting ∆e assume isotopic steady state. Isotopic 183
steady state means that the isotopic composition of the the transpired water vapour is equal to 184
that of the source water supplying the leaf (Craig & Gordon 1965; Harwood et al. 1998; 185
Farquhar & Cernusak 2005). The condition of non-steady state, when the transpired water 186
has an isotopic composition differing from that of source water, will be discussed below. In 187
general, it has been observed that leaf water enrichment tends to be near to steady state 188
during the day in leaves that have relatively open stomata and do not show a high degree of 189
succulence (Cernusak et al. 2008). 190
The equilibrium fractionation varies as a function of temperature (Bottinga & Craig 191
1969; Majoube 1971; Horita & Wesolowski 1994). It can be calculated according to the 192
following equations (Majoube 1971), with that for 18O shown first, followed by that for 2H: 193
!‰ = #$
%.%'(
)('*+)×-'../%01)('*+2.-334×-5'− 16 × 1000 , (5)
194
8‰ = #$
)/.9//
)('*+)×-'(1.)/9)('*+:2.32×-5'− 16 × 1000 . (6)
195
The right sides of the equations have been multiplied by 1000, so that ε+ is here expressed as 196
per mil. The symbol !(‰) in Eqn 5 refers to the isotope fractionation for 18O, and 8(‰) in 197
Eqn 6 refers to that for 2H. The T in these equations refers to the leaf temperature in degrees 198
Celsius. The εk in Eqns 3 and 4 can be calculated as (Farquhar et al. 1989) 199
!‰ =2;<<=<<> > , (7) 200
The !‰ is εk for 18O expressed as per mil, and 8‰ is the same for 2H. The rs and rb 202
in Eqns 7 and 8 are the stomatal and boundary layer resistances, respectively (m2 s mol-1); 203
they are the inverses of the stomatal and boundary layer conductances. The 28 and 19 in Eqn 204
7 are fractionation factors for diffusion of water molecules containing 18O through the 205
stomata and boundary layer, expressed as per mil. The values 25 and 17 in Eqn 8 are those 206
same fractionation factors for 2H (Merlivat 1978). It has been suggested that these values 207
should be revised (Cappa et al. 2003). However, subsequent measurements indicated that the 208
fractionation factors originally assigned are the more correct values (Luz et al. 2009). 209
If the water vapour in the air is in isotopic equilibrium with source water, then ∆v will 210
approximately equal –ε+. In that case, Eqn 3 will condense to 211
∆≈ + 1 − . (9)
212
Equation 9 demonstrates the strong role that the relative humidity term wa/wi plays in 213
determining the isotopic enrichment of leaf water at the sites of evaporation. 214
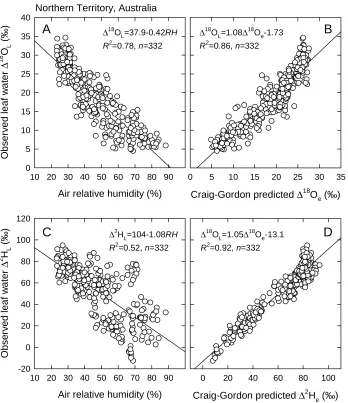
Figure 3 shows the relationships between observed daytime bulk leaf water isotopic 215
enrichment and the air relative humidity and Craig-Gordon predictions for a large dataset 216
collected under natural field conditions across a sub-continental rainfall gradient in northern 217
Australia (Kahmen et al. 2013a). The analysis shows both the importance of the relative 218
humidity term in driving daytime leaf water stable isotope enrichment (Figures 3A and 3C), 219
and that the Craig-Gordon equation captures much of the observed variation across a large-220
scale environmental gradient (Figures 3B and 3D). 221
This analysis also highlights an important difference between 18O and 2H. For 18O, 222
the air relative humidity predicts nearly as much variation in the observed leaf water 223
enrichment as does the full Craig-Gordon model, with R2 of 0.78 for the former versus 0.86 224
for the latter (Figures 3A and 3B). For 2H, on the other hand, the air relative humidity 225
predicts only a little more than half the variation predicted by the full Craig-Gordon model, 226
with R2 of 0.52 for the former versus 0.92 for the latter (Figures 3C and 3D). This 227
demonstrates the importance of the isotopic disequilibrium between air vapour and source 228
water for predicting ∆e for 2H in comparison to 18O. This disequilibrium can be expressed as 229
ε+
+∆v. The contrast between 2H and 18O in the sensitivity of ∆e to ε++∆v comes about 230
because, for 18O, ε+, ∆v, and the difference between them are typically small in absolute 231
value compared to εk, whereas the opposite is true for 2H. For 2H, the disequilibrium term 232
ε+
+∆v can easily be larger than εk in absolute value, with either positive or negative values 233
for 2H, the predicted ∆e is dominated by the equilibrium fractionation, ε+, and by the air 235
vapour disequilibrium term, ε++∆v. 236
The role of the atmospheric vapour isotopic composition in controlling ∆e can be 237
further appreciated by examining the limiting case where relative humidity is saturated, such 238
that wa/wi=1. In this case, Eqn 3 reduces to ε++∆v; and, the isotopic disequilibrium between 239
air vapour and source water then controls ∆e. While this limiting scenario usually only 240
occurs at night, it emphasises the importance of atmospheric vapour in influencing leaf water 241
enrichment (Farquhar & Cernusak 2005; Helliker & Griffiths 2007), as well as the general 242
importance of having a reasonably accurate estimate of ∆v for predicting ∆e, especially with 243
respect to 2H. In humid-zone epiphytes that use Crassulacean acid metabolism, this 244
phenomenon creates an opportunity to reconstruct the isotope ratio of atmospheric water 245
vapour from the epiphyte’s organic matter (Helliker 2014). 246
247
Bulk leaf water 248
The term ‘bulk leaf water’ generally refers to a water sample obtained by extraction 249
from a whole leaf. A bulk leaf water sample may or may not contain the water of the major 250
veins, depending on the sampling protocol of the individual researcher. Leaf water excluding 251
the major veins has also been referred to as ‘lamina leaf water’. It is important to note that in 252
the vast majority of plants, such a sample will also contain water associated with minor veins. 253
Here we use δL to refer to the isotopic composition of bulk leaf water, and ∆L to refer to its 254
enrichment above source water. 255
Early measurements indicated that the Craig-Gordon model tended to overestimate ∆L 256
(Allison, Gat & Leaney 1985; Leaney et al. 1985; Bariac et al. 1989; Walker et al. 1989; 257
Yakir, DeNiro & Gat 1990; Flanagan et al. 1991; Walker & Lance 1991). To illustrate this 258
phenomenon, we compiled leaf water isotopic data from a number of published datasets, 259
along with the Craig-Gordon prediction of leaf water enrichment corresponding to each 260
observation (Supplementary material). The dataset contains 118 species, sampled across a 261
range of tropical and temperate sites from both northern and southern hemispheres. It is 262
limited to daytime observations of C3 plants under natural field conditions. Figure 4 presents 263
the results for the proportional difference between the predicted Craig-Gordon enrichment 264
and the observed bulk leaf water enrichment (1-∆L/∆e). The analysis confirms that observed 265
1-∆L/∆e is larger than zero for both 18O (P<0.001; n=722) and 2Η (P<0.001; n=362), with 266
The explanation for the generally lower observed value of ∆L compared to ∆e has 268
attracted considerable research effort, because it is important to determine which leaf water 269
signal is most relevant to the various applications that depend upon it. Two models have 270
been proposed to explain this pattern when steady state conditions can reasonably be 271
expected: a two-pools model, based on two discrete pools of water within the leaf, with one 272
of them being unenriched xylem water (Leaney et al. 1985; Yakir, Deniro & Rundel 1989; 273
Yakir et al. 1990; Roden & Ehleringer 1999; Song et al. 2015a); and an advection-diffusion, 274
or Péclet, model (Farquhar & Lloyd 1993; Farquhar & Gan 2003; Barnes, Farquhar & Gan 275
2004). 276
If the two-pools model is assumed to comprise unenriched source water and enriched 277
evaporative site water, it can be written as (Leaney et al. 1985; Song et al. 2015a) 278
∆?= 1 − @∆ , (10)
279
where φ is the proportion of leaf water that is unenriched xylem water, presumably residing 280
mainly in the major veins and ground tissue associated with them. In this model, the 281
overestimation of ∆L by the Craig-Gordon model is due to the contribution from the 282
unenriched pool. 283
Rather than two discrete pools, the Péclet model describes gradients of enrichment 284
within the leaf water. In the Péclet model, advection of less enriched water by the 285
transpiration stream opposes the back-diffusion of isotopically enriched water from the 286
evaporative sites (Farquhar & Lloyd 1993). When advection overwhelms diffusion, the bulk 287
leaf water enrichment will be less than that predicted by the Craig-Gordon equation. 288
Accordingly, the proportional difference, 1-∆L/∆e, is predicted to increase with increasing 289
transpiration rate. This particular feature is an important distinction between the Péclet 290
model and the two-pools model: the Péclet model predicts that the deviation of the bulk leaf 291
water from the Craig-Gordon predicted enrichment should record information about the 292
transpiration rate. In contrast, the two-pools model does not predict such an effect. 293
The Péclet number, which is dimensionless, represents the extent to which diffusion is 294
overwhelmed by advective counter-flow (Ikeda 1983). It was originally developed to 295
describe the ratio between convective and conductive heat transfer by Jean Claude Eugene 296
Péclet, and has since been applied more generally to describe advection-diffusion effects on 297
mass transport processes in permeable media. For leaves, the Péclet number, ℘, can be 298
defined as vl/D, where v is the velocity of water movement (m s-1), l is the distance (m) from 299
heavy isotopologue in water (m2 s-1). The D is temperature dependent, and can be modelled 301
as a function of leaf temperature as (Cuntz et al. 2007), 302
A! = 97.5 × 10=$
0((
+5%/0 , (11)
303
A8 = 98.7 × 10=$
0((
+5%/0 , (12)
304
where DO is the diffusivity for H218O, DH is that for H2HO, and T is leaf temperature in °C. 305
The velocity of advection can further be described as kE/C, where E is the transpiration rate 306
(mol m-2 s-1), C is the molar concentration of water (5.55×10⁴ mol m-3), and k is a scaling 307
factor to account for the tortuosity of the water path. The term E/C gives the velocity as if 308
water were moving as a slab perpendicular to the leaf surface. The true velocity must be 309
faster than the slab velocity, because water moves in a tortuous path through the leaf. The 310
scaling factor k represents the ratio of the true velocity to the slab velocity. Combining the 311
above terms gives the following definition for the Péclet number: 312
℘=FGHI . (13)
313
It is convenient to combine k and l into a single term, which has been called the effective path 314
length, L (Farquhar & Lloyd 1993): 315
℘=HI?G . (14)
316
Ignoring the water in veins for the moment, the Péclet model applied to the average leaf 317
lamina then predicts the following relationship with the evaporative site water enrichment 318
(Farquhar & Lloyd 1993): 319
∆?= ∆
5℘
℘ . (15)
320
Equation 15 indicates that the smaller the Péclet number, the more similar ∆L will be to ∆e. It 321
also predicts a continuous isotopic gradient from the sites of evaporation to the source water, 322
modelled as an exponential decay along a cylindrical flow path. 323
Because ℘ includes terms for both the effective path length and the transpiration rate, 324
a change in either one is predicted to alter the relationship between ∆L and ∆e. This is shown 325
schematically in Figure 5. In practice, values for the effective path length L have been 326
difficult to determine directly. Thus, they have generally been fitted using Eqns 14 and 15, 327
which therefore involves comparing observed bulk leaf water enrichment with the predicted 328
Craig-Gordon enrichment. One consideration that could lead to biased estimates of L when 329
fitted in this way is that unenriched vein water could also contribute to the difference between 330
∆L and ∆e, as described by the two pool model. If this were the case, L would be 331
Farquhar and Gan (2003) improved upon the one dimensional Péclet model described 333
above by separating Péclet effects in the leaf xylem and lamina. In practical terms, this 334
provides a means of combining the two-pool concept of dilution of leaf water enrichment by 335
relatively unenriched vein water with the lamina Péclet model. Furthermore, it allows the 336
advection-diffusion behaviour to be expressed in vein water as well as in mesophyll water. 337
Such a consideration is important because some observations suggest that vein water can 338
become enriched in 18O (Gan et al. 2002; Gan et al. 2003). Farquhar and Gan (2003) 339
suggested that most vein water should be found in the major veins and associated ground 340
tissue, with the proportion of leaf water in higher order minor veins being relatively small. If 341
the proportion of leaf water in minor veins were considered negligible, the bulk leaf water 342
enrichment could then be described as (Farquhar & Gan 2003), 343
∆?= ∆@J$℘K+ 1 − @J5℘
℘ , (16)
344
where φx is the proportion of leaf water in major veins, and ℘r is the total radial Péclet 345
number, equal to the sum of the lamina radial Péclet number, ℘, and the veinlet Péclet 346
number, ℘rv. Equation 16 allows for part of the difference between ∆L and ∆e to be 347
accounted for by the relatively unenriched vein water. Fitting mesophyll effective path 348
lengths with Eqn 16 should therefore provide more realistic estimates than with Eqn 15, but 349
has the added complexity that values need to be assigned for φx and ℘r (e.g. Ripullone et al. 350
2008), or these need to be fitted simultaneously (e.g. Gan et al. 2003). 351
A convenient way to probe observed leaf water isotopic composition for evidence of 352
Péclet effects is to plot the proportional difference between ∆e and ∆L as a function of 353
transpiration rate. Such plots have yielded variable results, with some authors finding a 354
positive relationship, as predicted by the Péclet model (Barbour et al. 2000b; Ripullone et al. 355
2008; Loucos et al. 2015), and others, either no detectable relationship or a negative 356
relationship (Roden & Ehleringer 1999; Cernusak, Wong & Farquhar 2003; Song et al. 2013; 357
Roden et al. 2015; Song et al. 2015a). For our combined dataset given in the supplementary 358
material and shown in Figure 4, we find no relationship between 1-∆L/∆e and transpiration 359
rate for either ∆18O or ∆2H. 360
Given the conceptual realism in the Péclet model, it has been difficult to explain why 361
in some cases there is no observable relationship between 1-∆L/∆e and E. One explanation 362
might be changes in the effective path length as transpiration rate varies (Kahmen et al. 2008; 363
Song et al. 2013; Loucos et al. 2015). Water supply to the mesophyll is predominantly via 364
sites of evaporation can proceed through three parallel pathways: symplastic movement 366
through plasmodesmata, transcellular movement across cell membranes through aquaporins, 367
and apoplastic flow in cell walls that are not suberised (Steudle, Murrmann & Peterson 1993). 368
Although it can reasonably be expected that most flow will occur through the apoplast 369
(Brodribb, Feild & Jordan 2007), each of these pathways is nonetheless likely to be 370
associated with its own effective path length (Barbour & Farquhar 2004), and the possibility 371
exists that the relative activity of these pathways may change with transpiration rate. In 372
addition, water may not always evaporate in the vicinity of the stomatal pore (Rockwell, 373
Holbrook & Stroock 2014; Buckley 2015), as is generally assumed. These considerations 374
have potential to obscure the positive relationship between 1-∆L/∆e and E that is predicted by 375
the Péclet model, because changes to L could compensate for changes in E, thereby 376
decoupling ℘ from E (Cernusak & Kahmen 2013; Song et al. 2013). 377
The idea that xylem can be variably coupled to the mesophyll to give distinct pools of 378
water of different volume and function within the leaf has been suggested in relation to leaf 379
hydraulics (Zwieniecki, Brodribb & Holbrook 2007; Canny et al. 2012), and would support 380
the idea of isotopic compartmentalisation of leaf water (Yakir et al. 1989; Yakir 1992; Yakir 381
et al. 1994). Looking at the rehydration kinetics of leaves of different species, Zwieniecki et
382
al. (2007) considered three observed patterns of hydraulic design: 1) where the vein is
383
hydraulically separated from the rest of the leaf; 2) where the epidermis is hydraulically 384
linked to the veins through the bundle sheath extension, but the mesophyll remains separated, 385
and 3) where all tissues are equally well coupled (Figure 6). Such compartmentalisation 386
could be created by both the internal organisation of leaf tissues, leading to variable degrees 387
of physical contact between different structures, and by the number, activity, and resistance 388
of the different pathways for water movement. A reasonable hypothesis, based on these 389
observations, is that different residence times will occur for different pools of water within 390
the leaf, introducing further variation into observed relationships between 1-∆L/∆e and E, 391
because some pools of water would carry a memory of previous leaf water enrichment 392
conditions, whereas others would not. 393
Conifer needles fit within Design 1 of Figure 6, consisting of a singular vascular 394
bundle surrounded by transfusion tissue and a thick-walled endodermis, which likely 395
provides high radial resistance and physical separation between xylem and mesophyll. 396
Consistent with this concept, it was recently observed that a two-pool model was sufficient to 397
enrichment in two pine species (Roden et al. 2015). Water pools may also exist within the 399
mesophyll. In Eucalyptus pauciflora (snowgum) mesophyll cells shrank equally during 400
transpiration (Canny & Huang 2006), whereas in Gossypium hirsutum (cotton), cavity and 401
spongy mesophyll cells shrank more than matrix cells (Canny et al. 2012), suggesting that 402
different pools of water differentially supported evaporative demand. Leaf shrinkage of 403
tissues has also been linked more generally to the decline in extra-xylary hydraulic 404
conductance (Scoffoni et al. 2014), which could further contribute to hydraulic 405
compartmentalisation under conditions of water stress. 406
407
Progressive enrichment 408
Sampling leaf tissue at a sub-leaf scale has revealed spatial patterns of isotopic 409
enrichment within leaves (Figure 7). Here, the isotopic composition tends to become 410
progressively enriched towards the tip of the leaf and out from the mid-vein (Bariac et al. 411
1994; Wang & Yakir 1995; Helliker & Ehleringer 2000; Gan et al. 2002; Santrucek et al. 412
2007). 413
This spatial pattern was initially explained using a string of lakes model, which 414
assumed a string of inter-connected pools of water within the leaf with differing isotope 415
compositions (Gat & Bowser 1991; Helliker & Ehleringer 2000; Helliker & Ehleringer 416
2002). Farquhar and Gan (2003) improved upon this model by including Péclet effects in 417
both mesophyll and veins (Figure 8). This enabled predictions of progressive enrichment of 418
xylem water in monocot leaves with distance from the base of the leaf. The predictions 419
matched relatively well the observed pattern in maize (Farquhar & Gan 2003; Gan et al. 420
2003). Ogée et al. (2007) then further improved upon this model by incorporating non-steady 421
state effects. 422
The progressive enrichment observed in both monocot and dicot leaves suggests that 423
back-diffusion occurs from the mesophyll back into the vein, allowing some evaporative 424
enrichment to be passed via the xylem from central and basal portions of the leaf to 425
downstream leaf sections. Such spatial variation can be described by three Péclet numbers 426
(Figure 8): 1) a radial Péclet number at the interface between xylem and mesophyll (℘rv) 427
which allows for the leaf veinlet xylem water to become enriched above petiole water; 2) a 428
radial Péclet number associated with the mesophyll tissue (℘) which is likely to be small; 429
and 3) a longitudinal Péclet number (℘l), allowing progressive enrichment of the xylem in 430
enrichment is mainly driven by advection. A derivation of this two dimensional Péclet model 432
with component Péclet numbers is given by Farquhar & Gan (2003). 433
In a general sense, observations of progressive enrichment provide strong support for 434
the concept of Péclet effects in leaf water, because increasing enrichment of vein water with 435
increasing distance from the midrib and the leaf base would not occur if some enriched water 436
did not back diffuse from the evaporative sites into the veins, against the advective flow of 437
the vein water. 438
439
Transpired water 440
Water vapour leaving a leaf during transpiration originates directly from water at the 441
evaporative sites. Thus, it makes intuitive sense that the isotopic composition of transpired 442
water vapour (δE) should be related to that of evaporative site water (δe). When the Craig-443
Gordon model is written in a form that does not assume isotopic steady state, it predicts the 444
following relationship between δe and δE: 445
≈ G+ ε+ εM+ − G− εM . (17)
446
From Eqn 17, it can be seen that δE is a necessary component for predicting δe under non-447
steady state conditions. When steady state is assumed, δE is set equal to δs. Making this 448
substitution then leads to the widely used formulation shown in Eqn 3. If δE is measured 449
experimentally, Eqn 17 provides a useful means of estimating the isotopic composition of the 450
evaporative sites under non-steady state conditions (Harwood et al. 1998). 451
The steady-state assumption of δE being equal to δs results from mass balance 452
constraints on leaf water dynamics, as shown in the following equation (Dongmann 1974; 453
Farquhar & Cernusak 2005): 454
NOPQ
NR = EδU− δV . (18)
455
Here W is the leaf water concentration and δL is the isotope composition of leaf water. The 456
product of the two is termed isostorage (Farquhar & Cernusak 2005). The term E(δs-δE) 457
describes the difference between the isotopic flux of water molecules into (Eδs) and out of 458
(EδE) the leaf, and thus can be viewed as the net isoflux. Equation 18 states that the rate of 459
change of leaf water isostorage is equal to the net isoflux of water into or out of the leaf. 460
With the leaf at isotopic steady state, leaf water isostorage would be constant (i.e., NOPNRQ= 461
Motivated by the need to address the conditions under which isotopic steady state 463
occurs (i.e., δE=δs), several authors have used isotope ratio laser spectrometry coupled to a 464
gas exchange system to explore the variability of δE in response to environmental conditions 465
(Wang et al. 2012; Simonin et al. 2013; Dubbert et al. 2014; Song et al. 2015b). In a 466
laboratory study conducted on tobacco and citrus leaves, Simonin et al. (2013) observed that 467
δE was variable and deviated from δs as long as instability was present in any of the 468
environmental and/or physiological variables (e.g., relative humidity, δv, stomatal 469
conductance). This suggests that environmental and physiological stability is a prerequisite 470
for isotopic steady state to occur. In this context, it should be noted that even when 471
environmental and physiological parameters are stable, the condition of isotopic steady state 472
will not be achieved immediately (e.g. Simonin et al. 2013). Rather, δE will move toward δs 473
in an exponential manner with a time constant that depends on the leaf water concentration, 474
stomatal conductance, and the water vapour mole fraction inside the leaf (Dongmann et al. 475
1974; Farquhar & Cernusak 2005). Song et al. (2015b) recently conducted a laboratory 476
experiment to monitor this type of exponential trajectory of δE in cotton leaves exposed to a 477
gas-exchange cuvette environment. They demonstrated that the time constant for the 478
approach of δE to δs agreed well with the prediction from the non-steady state isotope theory 479
adapted to cuvette conditions. 480
Under field conditions, time constants for leaf water turnover can often be longer than 481
the frequencies at which natural variations in temperature, humidity, and stomatal 482
conductance occur. As a result, it has been argued that the isotopic composition of transpired 483
water, δE, should rarely be precisely at steady state (Wang & Yakir 1995; Harwood et al. 484
1998; Simonin et al. 2013). A recent field study tracked diurnal variations in δE for an oak 485
tree during distinct Mediterranean seasons and found that δE significantly deviated from δs 486
most of the time (Dubbert et al. 2014). Such an observation, resulting from direct 487
measurements of δE, provides support for the “steady state being rare” argument, thereby 488
suggesting that the steady-state assumption should be used with caution in field conditions 489
when applied to δE. However, this raises an interesting contrast with δL, the isotopic 490
composition of leaf water, which often appears to be near to steady state, at least for many C3 491
plants, during the day (e.g., Figure 3). This highlights the difference between the isoflux 492
(EδE) and isostorage (WδL) terms, with the latter being relatively buffered against high 493
frequency variations. 494
Non-steady state effects on leaf water enrichment 496
Non-steady state effects on leaf water isotopic enrichment, the isostorage term, are 497
expected to become important when stomatal conductance is low and/or when leaf water 498
concentrations are high. Most species probably show significant non-steady state behaviour 499
in ∆L at night, due to low stomatal conductance (Cernusak, Pate & Farquhar 2002; Cernusak, 500
Farquhar & Pate 2005; Seibt et al. 2006; Barnard et al. 2007; Cuntz et al. 2007). In addition, 501
non-steady state behaviour has been observed during the day in plant species with succulent 502
leaves (Sternberg, Deniro & Johnson 1986; Cernusak et al. 2008), and in some needle-leaved 503
species, when exposed to high vapour pressure deficits or low soil water availability, such 504
that stomatal conductance was relatively low (Pendall, Williams & Leavitt 2005; Seibt et al. 505
2006; Snyder et al. 2010). 506
Variation in leaf water isotopic enrichment under non-steady state conditions (∆Ln) 507
can be predicted as follows (Farquhar & Cernusak 2005): 508
∆?W= ∆?−X
*XY
Z ∙
5℘
℘ ∙
\]∆^_
\` , (19)
509
where ∆L is the steady-state prediction of leaf water isotopic enrichment, α+ is defined as 510
1+ε+, αk is defined as 1+εk, W is the lamina leaf water concentration (mol m-2), t is time (s), 511
and g is the total conductance to water vapour of stomata plus boundary layer (mol m-2 s-1). 512
Note that ε+ and εk, if they are expressed in per mil, should be divided by 1000 to calculate α+ 513
and αk. Equation 19 has the term ∆Ln on both the left and right sides of the equation, and so 514
needs to be solved iteratively. One way to do this is with the Solver function in Microsoft 515
Excel (Farquhar & Cernusak 2005). Alternatively, Kahmen et al. (2008) suggested a simpler 516
method for solving the equation by introducing the assumption that, over sufficiently small 517
time steps, \]∆^_
\` ≈
]∆^_]∆^_5%
∆ , where the subscript t-1 refers to the value at the 518
previous time step and ∆t is the time elapsed since the previous time step. This definition can 519
be substituted into Eqn 19, which can then be solved for ∆Ln, such that it only occurs on the 520
left side of the equation. The value for ∆Ln can then be calculated without need for iteration 521
(Kahmen et al. 2008). Another alternative is to assume a step change in parameters from one 522
time step to the next, so that the leaf water enrichment moves toward the new steady state in 523
an exponential fashion with a time constant, τ, approximated by W/gwi. This also results in 524
equations that can be calculated without need for iteration (Dongmann et al. 1974; Farquhar 525
527
Which leaf water model to use? 528
As seen above, models describing leaf water evaporative enrichment have become 529
increasingly complex over time, from the simplest version of the Craig-Gordon equation, to 530
non-steady state models (Dongmann et al. 1974; Farquhar & Cernusak 2005), to the most 531
complex spatially-explicit models describing gradients of enrichment under non-steady state 532
conditions (Cuntz et al. 2007; Ogée et al. 2007). Given the range of options available, it is 533
not always straight forward to decide which leaf water model to use for a particular research 534
question. For some applications at larger temporal and spatial scales, the steady state Craig-535
Gordon model (Eqn 3) will be adequate and including non-steady state effects and Péclet 536
effects will likely add complexity that does not significantly improve model outcomes. 537
Conversely, if water is sampled within a leaf and at high temporal resolution, a spatially-538
explicit and non-steady state model may be required (Ogée et al. 2007). Some studies have 539
tested the suitability of different models in specific applications. For example, Cernusak et 540
al. (2005) demonstrated that both the non-steady state and whole-leaf Péclet models were 541
required to predict accurately diel variability in leaf water enrichment in Eucalyptus globulus. 542
Ogée et al. (2009) found that the oxygen isotope composition of tree ring cellulose was not 543
sensitive to the value assigned to the Péclet effective length, implying that a simpler two-pool 544
model would have been adequate. At larger spatial but smaller temporal scale, the 545
requirement for a non-steady state model has been confirmed when interpreting variation in 546
ecosystem-scale isofluxes (Xiao et al. 2012; Santos et al. 2014). 547
Here, we describe a general framework for deciding when to apply different leaf 548
water models. Questions relating to the δ18O of oxygen evolution, such as studies of the 549
Earth’s Dole effect (Bender, Sowers & Labeyrie 1994; Hoffmann et al. 2004), should for the 550
most part be well served by the steady state Craig-Gordon prediction of ∆e. This is because 551
oxygen evolution takes place during the day when leaf water is generally near isotopic steady 552
state, and because chloroplasts are mostly located near to the evaporative sites. The same 553
argument can be applied for questions relating to effects of photosynthesis on δ18O of 554
atmospheric CO2 (Farquhar et al. 1993; Cuntz et al. 2003). However, in this case the impact 555
of exchange of atmospheric CO2 with leaf water also continues at night. In order to account 556
for the influence of dark respiration on δ18O of atmospheric CO2, a non-steady state model of 557
evaporative site water is needed (Cernusak et al. 2004; Seibt et al. 2006; Cuntz et al. 2007; 558
For the most part, the influence of leaf water isotopic enrichment on organic material 560
is mediated by photosynthesis. Again, because photosynthesis takes place during the day, 561
research questions relating to δ18O and δ2H of organic material should be served reasonably 562
well by steady state models. Here, there have been mixed results as to whether Péclet effects 563
need to be considered. For isotopic signals closely related to leaf water, such as δ18O of 564
phloem sugars, a Péclet effect was required (Barbour et al. 2000b; Cernusak et al. 2003). 565
However, in applications that consider processes further downstream from leaf water, such as 566
tree-ring formation, the relatively small Péclet effect becomes further damped, to the point 567
that there may be little advantage in including it (Ogée et al. 2009; Gessler et al. 2014; Song, 568
Clark & Helliker 2014). 569
For plant breeding applications aimed at disentangling effects of stomatal 570
conductance from those of photosynthetic capacity on water-use efficiency, it will likely be 571
advantageous to consider Péclet effects (Farquhar, Condon & Masle 1994; Barbour et al. 572
2000a; Barbour 2007). In addition, Péclet effects will likely be particularly important in 573
studies aimed at linking leaf water stable isotope composition with leaf hydraulic pathways 574
(Barbour & Farquhar 2004; Ferrio et al. 2012; Song et al. 2013). On the other hand, for 575
applications aimed at using the δ2H of leaf waxes to reconstruct hydrological features of 576
ancient ecosystems, the simplest form of the steady state Craig-Gordon equation will likely 577
suffice (McInerney, Helliker & Freeman 2011; Sachse et al. 2012; Kahmen et al. 2013a). 578
579
SAMPLING CONSIDERATIONS AND METHODOLOGICAL ADVANCES 580
The isotopic analysis of plant waters presents a number of analytical challenges. 581
These include difficulties of extraction, the necessity to work with small quantities of water, 582
protecting the original composition of the water sample, and avoiding undesirable influences 583
of dissolved compounds. Preventing post-sampling evaporative enrichment of leaf water 584
requires careful consideration of sample handling and storage. For example, even the time 585
taken to separate primary veins from leaf lamina can result in detectable isotopic enrichment 586
of the leaf lamina (Cernusak et al. 2003). 587
There are three main ways of analysing the isotopic composition of plant water: 588
equilibration, prior extraction, and simultaneous extraction. With equilibration methods, a 589
gas is equilibrated directly with the plant water while it is still in the sample, and the gas is 590
plant tissue before isotopic analysis, whereas with simultaneous extraction the water is 592
removed from the plant as part of the analysis. 593
In equilibration methods, a gas is introduced into a sealed vessel with the sample, 594
such as a detached portion of stem, and the system maintained until the gas has effectively 595
equilibrated with the water that the sample contains (Scrimgeour 1995). Typically, for 596
oxygen isotopic analysis, pure CO2 or a CO2/gas mixture is stored over the sample at a 597
controlled temperature. The CO2 then exchanges oxygen with the water by the carbonic 598
acid/bicarbonate reaction, with a temperature dependent fractionation. Direct equilibration of 599
CO2 with twig and stem water showed good agreement, to within 0.5‰, with assessments of 600
the δ18O of paired samples based on prior extraction (Scrimgeour 1995). This direct 601
equilibration method may also be useful for analysis of the δ18O of leaf water. However, a 602
limitation may be imposed by the very low rate of diffusion of CO2 in water, and of water in 603
water, so that the gas may primarily equilibrate with the more exposed portion of the leaf 604
water. Thus, the δ18O of the equilibrated CO2 may be more representative of the evaporative 605
site water, as opposed to the bulk leaf water; experiments are needed to test this. 606
Extraction methods aim for complete removal of the water from the sample, because 607
the removal of water by evaporation is typically associated with a fractionation. Thus, in the 608
event of a partial extraction, the water removed will have a different isotopic composition 609
from that which remains. The most widely used prior extraction method is cryogenic vacuum 610
extraction (Ehleringer, Roden & Dawson 2000). Here, the water is freed from the sample 611
using heat and vacuum, and then frozen onto a collecting surface. For plant tissues, 612
cryogenic vacuum extraction is a tested and reliable method, and it typically serves as the 613
benchmark against which new methods are evaluated. However, it is relatively labour and 614
time-intensive. Several authors have proposed modifications aimed at reducing these 615
restrictions (West, Patrickson & Ehleringer 2006a; Vendramini & Sternberg 2007; Koeniger 616
et al. 2011; Ignatev et al. 2013; Orlowski et al. 2013). For laser-based analysis of water
617
isotopes, cryogenic extraction also presents the challenge of transferring organic 618
contaminants that can mix with the water sample and cause optical interference (West et al. 619
2010). 620
Recent years have seen the advent of laser-based, optical analysers with the capacity 621
to measure the stable isotope composition of water vapour (e.g. Gupta et al. 2009; Sturm & 622
Knohl 2010; Aemisegger et al. 2012; Griffis 2013). Using this type of analyser, new 623
is placed in the extraction device and the resulting water vapour is analysed as it is driven off 625
by heating. One example of such a system is an induction module cavity ring down 626
spectroscopy system (IM-CRDS) (Berkelhammer et al. 2013). The laser isotope analyser 627
relies on the absorption of an infrared laser pulse by water vapour as it reflects inside a 628
chamber. For a typical liquid water injection, about 1 µL of water is vaporised when it is 629
injected into a chamber hotter than boiling point. The vapour is then carried into the analyser 630
in a non-interfering gas. The IM-CRDS system is similar, except that the leaf sample is 631
heated inductively, and the vapour produced is then carried into the laser analyser. A second 632
example of a simultaneous water extraction and analysis system uses a microwave oven to 633
heat the leaf sample (Munksgaard et al. 2014). This was termed ME-IRIS, for microwave 634
extraction isotope ratio infrared spectroscopy. The ME-IRIS system includes a microwave 635
and a condenser to moderate the water vapour concentration of air passing to the laser 636
analyser, so that it remains within the optimal measuring range. Advantages of ME-IRIS are 637
that it can handle larger samples (e.g., whole leaves), and that it uses relatively low cost 638
components, such as a domestic microwave oven. 639
A complication in these simultaneous extraction methods is that some organic 640
compounds, for example alcohols, which can be present in leaf water, interfere significantly 641
with absorption peaks for the target isotopologues in the laser analyser. Two solutions have 642
been developed: a small furnace in-line which breaks down the interfering compounds, and 643
post-processing software that detects and flags analyses that potentially contain spectral 644
interference. The combination of the two tools together appears sufficient to identify and/or 645
reduce the analytical errors associated with organic contaminants to acceptable levels (West 646
et al. 2011; Munksgaard et al. 2014; Martín-Gómez et al. 2015).
647
Both IM-CRDS and ME-IRIS also suffer from memory effects, often requiring two to 648
three sample analyses to overcome the influence of a previous sample if its isotopic 649
composition was substantially different (Berkelhammer et al. 2013; Munksgaard et al. 2014). 650
The impact of the memory effect can be minimized by arranging the analytical sequence in 651
such a way as to avoid large jumps in isotopic composition between adjacent samples. This 652
also highlights a further disadvantage of simultaneous extraction methods; once analysed, the 653
same sample is not available for re-analysis. Thus, wherever possible, samples should be 654
collected in sufficient replication to overcome memory effects and as back-up in the event 655
that a re-analysis is deemed necessary. The main advantage gained by simultaneous 656
field laboratory, and to thereby have analytical results in near real time so that they can 658
inform the proceeding sampling strategy and experimental design. 659
An interesting variant of an equilibration method and simultaneous analysis of water 660
vapour stable isotopes by a laser analyser has been applied to soil cores (Wassenaar et al. 661
2008). In this system, a soil core was placed inside a sealed, inflatable plastic bag. The 662
sealed bag was then left to equilibrate the water vapour in the headspace with the liquid water 663
in the soil sample. Following the appropriate equilibration time, the plastic bag was 664
punctured with a needle connected to a piece of tubing feeding directly into a laser analyser. 665
The δ18O and δ2H of the liquid water in the soil sample could then be inferred from the 666
temperature dependent equilibrium fractionation between liquid and vapour, ε+. Such a 667
system may also be suitable for plant materials. Advantages would be the simplicity of the 668
equilibration compared to liquid water extraction, and that isotope ratios of both oxygen and 669
hydrogen could be determined simultaneously. As with the direct equilibration of CO2, a 670
question that would need to be addressed for leaves is whether the water vapour in the 671
headspace primarily equilibrates with the evaporative site, or whether it equilibrates with the 672
bulk leaf water. 673
674
CONCLUSIONS 675
Steady state leaf water isotopic enrichment is closely related to relative humidity in 676
natural environments, with the observed enrichment decreasing with increasing relative 677
humidity. Isotopic disequilibrium between source water and atmospheric vapour can also 678
have a relatively strong effect on steady state leaf water isotopic composition. Observations 679
over a large scale environmental gradient in Australia indicated that this effect is likely to be 680
stronger for 2H than for 18O. This difference in behaviour between the two isotopes reflects 681
the relative magnitudes of the equilibrium and kinetic fractionations in the Craig-Gordon 682
model of evaporative site enrichment. Equilibrium effects dominate for 2H, whereas kinetic 683
effects dominate for 18O. 684
In a combined dataset including 118 species, we found that observed bulk leaf water 685
was less enriched than the Craig-Gordon predictions for both 18O and 2H, as has been shown 686
previously. Across the full dataset, the proportional difference between Craig-Gordon 687
predicted and observed bulk leaf water enrichment showed no relationship with transpiration 688
rate. Explaining why Péclet effects are detectable in some situations, but not in others, 689
specific hydraulic characteristics could provide a tractable way forward, especially with 691
respect to pathways for water movement from veins to evaporative sites. 692
The development of new technologies for quantifying stable isotope ratios of 693
transpired water and water extracted from plant tissues offers an opportunity to further our 694
understanding of the finer scale controls over leaf water stable isotope enrichment. For 695
example, measuring the isotopic composition of transpired water vapour provides a means of 696
detecting nuances of steady versus non-steady state behaviour, and it also has potential to 697
provide insight into whether slow turnover pools exist within the leaf water, indicative of 698
hydraulic compartmentalisation. Improving our understanding of the environmental and 699
physiological controls over leaf water stable isotopic enrichment will benefit the many 700
applications to which models of this process can be applied, and may additionally lead to 701
novel insights into hydraulic design and functioning in leaves of terrestrial plants. 702
703
ACKNOWLEDGMENTS 704
This review paper resulted from a workshop funded by James Cook University and 705
held at the Daintree Rainforest Observatory in September 2014. L.A.C. and F.A.M. were 706
supported by Australian Research Council Future Fellowships (FT100100329 and 707
FT110100793, respectively). N.B.E. was supported by an Australian Research Council 708
Discovery Early Career Researcher Award (DE130100295). 709
710
REFERENCES 711
Aemisegger F., Sturm P., Graf P., Sodemann H., Pfahl S., Knohl A. & Wernli H. (2012) 712
Measuring variations of δ18O and δ2H in atmospheric water vapour using two 713
commercial laser-based spectrometers: an instrument characterisation study. 714
Atmospheric Measurement Techniques 5, 1491-1511.
715
Allison G.B., Barnes C.J. & Hughes M.W. (1983) The distribution of deuterium and 18O on 716
dry soils. 2. Experimental. Journal of Hydrology 64, 377-397. 717
Allison G.B., Gat J.R. & Leaney F.W.J. (1985) The relationship between deuterium and 718
oxygen-18 delta values in leaf water. Chemical Geology 58, 145-156. 719
Araguas-Araguas L., Froehlich K. & Rozanski K. (2000) Deuterium and oxygen-18 isotope 720
composition of precipitation and atmospheric moisture. Hydrological Processes 14, 721
Barbour M.M. (2007) Stable oxygen isotope composition of plant tissue: a review. 723
Functional Plant Biology 34, 83-94.
724
Barbour M.M. & Farquhar G.D. (2004) Do pathways of water movement and leaf anatomical 725
dimensions allow development of gradients in H218O between veins and the sites of 726
evaporation within leaves? Plant Cell and Environment 27, 107-121. 727
Barbour M.M., Fischer R.A., Sayre K.D. & Farquhar G.D. (2000a) Oxygen isotope ratio of 728
leaf and grain material correlates with stomatal conductance and grain yield in 729
irrigated wheat. Australian Journal of Plant Physiology 27, 625-637. 730
Barbour M.M., Schurr U., Henry B.K., Wong S.-C. & Farquhar G.D. (2000b) Variation in the 731
oxygen isotope ratio of phloem sap sucrose from castor bean. Evidence in support of 732
the Péclet effect. Plant Physiology 123, 671-679. 733
Bariac T., Gonzalezdunia J., Tardieu F., Tessier D. & Mariotti A. (1994) Spatial variation of 734
the isotopic composition of water (18O, 2H) in organs of aerophytic plants: 1. 735
Assessment under laboratory conditions. Chemical Geology 115, 307-315. 736
Bariac T., Rambal S., Jusserand C. & Berger A. (1989) Evaluating water fluxes of field-737
grown alfalfa from diurnal observations of natural isotope concentrations, energy 738
budget and ecophysiological parameters. Agricultural and Forest Meteorology 48, 739
263-283. 740
Barnard R.L., Salmon Y., Kodama N., Sorgel K., Holst J., Rennenberg H., Gessler A. & 741
Buchmann N. (2007) Evaporative enrichment and time lags between δ18O of leaf 742
water and organic pools in a pine stand. Plant Cell and Environment 30, 539-550. 743
Barnes B., Farquhar G. & Gan K. (2004) Modelling the isotope enrichment of leaf water. 744
Journal of Mathematical Biology 48, 672-702.
745
Barnes C.J. & Allison G.B. (1983) The distribution of deuterium and 18O in dry soils. 1. 746
Theory. Journal of Hydrology 60, 141-156. 747
Bender M., Sowers T. & Labeyrie L. (1994) The Dole effect and its variations during the last 748
130,000 years as measured in the Vostok ice core. Global Biogeochemical Cycles 8, 749
363-376. 750
Berkelhammer M., Hu J., Bailey A., Noone D.C., Still C.J., Barnard H., Gochis D., Hsiao 751
G.S., Rahn T. & Turnipseed A. (2013) The nocturnal water cycle in an open-canopy 752
Bottinga Y. & Craig H. (1969) Oxygen isotope fractionation between CO2 and water, and the 754
isotopic composition of marine atmospheric CO2. Earth and Planetary Science 755
Letters 5, 285-295.
756
Bowen G.J. (2010) Isoscapes: spatial pattern in isotopic biogeochemistry. Annual Review of 757
Earth and Planetary Sciences 38, 161-187.
758
Brodribb T.J., Feild T.S. & Jordan G.J. (2007) Leaf maximum photosynthetic rate and 759
venation are linked by hydraulics. Plant Physiology 144, 1890-1898. 760
Brooks J.R., Barnard H.R., Coulombe R. & McDonnell J.J. (2010) Ecohydrologic separation 761
of water between trees and streams in a Mediterranean climate. Nature Geoscience 3, 762
100-104. 763
Buckley T.N. (2015) The contributions of apoplastic, symplastic and gas phase pathways for 764
water transport outside the bundle sheath in leaves. Plant Cell and Environment 38, 7-765
22. 766
Canny M., Wong S.C., Huang C. & Miller C. (2012) Differential shrinkage of mesophyll 767
cells in transpiring cotton leaves: implications for static and dynamic pools of water, 768
and for water transport pathways. Functional Plant Biology 39, 91-102. 769
Canny M.J. & Huang C.X. (2006) Leaf water content and palisade cell size. New Phytologist 770
170, 75-85.
771
Cappa C.D., Hendricks M.B., DePaulo D.J. & Cohen R.C. (2003) Isotopic fractionation of 772
water during evaporation. Journal of Geophysical Research 108, 4525. 773
Cernusak L.A., Farquhar G.D. & Pate J. (2005) Environmental and physiological controls 774
over oxygen and carbon isotope composition of Tasmanian blue gum, Eucalyptus 775
globulus. Tree Physiology 25, 129-146.
776
Cernusak L.A., Farquhar G.D., Wong S.C. & Stuart-Williams H. (2004) Measurement and 777
interpretation of the oxygen isotope composition of carbon dioxide respired by leaves 778
in the dark. Plant Physiology 136, 3350-3363. 779
Cernusak L.A. & Kahmen A. (2013) The multifaceted relationship between leaf water 18O 780
enrichment and transpiration rate. Plant Cell and Environment 36, 1239-1241. 781
Cernusak L.A., Mejia-Chang M., Winter K. & Griffiths H. (2008) Oxygen isotope 782
composition of CAM and C3 Clusia species: non-steady-state dynamics control leaf 783
water 18O enrichment in succulent leaves. Plant Cell and Environment 31, 1644-1662. 784
Cernusak L.A., Pate J.S. & Farquhar G.D. (2002) Diurnal variation in the stable isotope 785
composition of water and dry matter in fruiting Lupinus angustifolius under field 786
Cernusak L.A., Wong S.-C. & Farquhar G.D. (2003) Oxygen isotope composition of phloem 788
sap in relation to leaf water in Ricinus communis. Functional Plant Biology 30, 1059-789
1070. 790
Coplen T.B. (2011) Guidelines and recommended terms for expression of stable-isotope-ratio 791
and gas-ratio measurement results. Rapid Communications in Mass Spectrometry 25, 792
2538-2560. 793
Craig H. & Gordon L.I. (1965) Deuterium and oxygen-18 variations in the ocean and the 794
marine atmosphere. In: Proceedings of a conference on stable isotopes in 795
oceanographic studies and palaeotemperatures (ed E. Tongiorgi), pp. 9-130. Lischi
796
and Figli, Pisa. 797
Cuntz M., Ciais P., Hoffmann G. & Knorr W. (2003) A comprehensive global three-798
dimensional model of δ18O in atmospheric CO2: 1. Validation of surface processes. 799
Journal of Geophysical Research 108, 4527.
800
Cuntz M., Ogée J., Farquhar G.D., Peylin P. & Cernusak L.A. (2007) Modelling advection 801
and diffusion of water isotopologues in leaves. Plant, Cell and Environment 30, 892-802
909. 803
Dawson T.E. (1993) Water sources of plants as determined from xylem-water isotopic 804
composition: perspectives on plant competition, distribution, and water relations. In: 805
Stable isotopes and plant carbon-water relations (eds J.R. Ehleringer, A.E. Hall, &
806
G.D. Farquhar), pp. 465-496. Academic Press Inc., San Diego. 807
Dawson T.E., Mambelli S., Plamboeck A.H., Templer P.H. & Tu K.P. (2002) Stable isotopes 808
in plant ecology. Annual Review of Ecology and Systematics 33, 507-559. 809
Dole M., Lane G.A., Rudd D.P. & Zaukelies D.A. (1954) Isotopic composition of 810
atmospheric oxygen and nitrogen. Geochimica et Cosmochimica Acta 6, 65-78. 811
Dongmann G., Nurnberg H.W., Förstel H. & Wagener K. (1974) On the enrichment of H218O 812
in the leaves of transpiring plants. Radiation and Environmental Biophysics 11, 41-52. 813
Dubbert M., Cuntz M., Piayda A. & Werner C. (2014) Oxygen isotope signatures of 814
transpired water vapor: the role of isotopic non-steady-state transpiration under 815
natural conditions. New Phytologist 203, 1242-1252. 816
Eglinton T.I. & Eglinton G. (2008) Molecular proxies for paleoclimatology. Earth and 817
Planetary Science Letters 275, 1-16.
818
Ehleringer J.R. & Dawson T.E. (1992) Water-uptake by plants - perspectives from stable 819
Ehleringer J.R., Roden J.S. & Dawson T.E. (2000) Asessing ecosystem-level water relations 821
through stable isotope ratio analyses. In: Methods in Ecosystem Science (eds O.E. 822
Sala, R.B. Jackson, H.A. Mooney, & R.W. Howarth), pp. 181-198. Springer-Verlag, 823
New York. 824
Ellsworth P.Z. & Williams D.G. (2007) Hydrogen isotope fractionation during water uptake 825
by woody xerophytes. Plant and Soil 291, 93-107. 826
English N.B., Dettman D.L., Sandquist D.R. & Williams D.G. (2007) Past climate changes 827
and ecophysiological responses recorded in the isotope ratios of saguaro cactus 828
spines. Oecologia 154, 247-258. 829
Farquhar G.D. & Cernusak L.A. (2005) On the isotopic composition of leaf water in the non-830
steady state. Functional Plant Biology 32, 293-303. 831
Farquhar G.D., Cernusak L.A. & Barnes B. (2007) Heavy water fractionation during 832
transpiration. Plant Physiology 143, 11-18. 833
Farquhar G.D., Condon A.G. & Masle J. (1994) Use of carbon and oxygen isotope 834
composition and mineral ash content in breeding for