Rubella Viruses Shift Cellular Bioenergetics to a More
Oxidative and Glycolytic Phenotype with a Strain-Specific
Requirement for Glutamine
Nicole C. Bilz,aKristin Jahn,a,b*Mechthild Lorenz,aAnja Lüdtke,a,b*Judith M. Hübschen,cHenriette Geyer,d* Annette Mankertz,dDenise Hübner,aUwe G. Liebert,aClaudia Clausa
aInstitute of Virology, University of Leipzig, Leipzig, Germany
bFaculty of Life Sciences, University of Leipzig, Leipzig, Germany
cWHO European Regional Reference Laboratory for Measles and Rubella, Department of Infection and
Immunity, Luxembourg Institute of Health, Esch-Sur-Alzette, Grand-Duchy of Luxembourg
dWHO European Regional Reference Laboratory for Measles and Rubella, Robert Koch Institute, Berlin,
Germany
ABSTRACT The flexible regulation of cellular metabolic pathways enables cellular adaptation to changes in energy demand under conditions of stress such as posed by a virus infection. To analyze such an impact on cellular metabolism, rubella virus (RV) was used in this study. RV replication under selected substrate supplementation with glucose, pyruvate, and glutamine as essential nutrients for mammalian cells re-vealed its requirement for glutamine. The assessment of the mitochondrial respira-tory (based on the oxygen consumption rate) and glycolytic (based on the extracel-lular acidification rate) rate and capacity by respective stress tests through Seahorse technology enabled determination of the bioenergetic phenotype of RV-infected cells. Irrespective of the cellular metabolic background, RV infection induced a shift of the bioenergetic state of epithelial cells (Vero and A549) and human umbilical vein endothelial cells to a higher oxidative and glycolytic level. Interestingly there was a RV strain-specific, but genotype-independent demand for glutamine to induce a significant increase in metabolic activity. While glutaminolysis appeared to be rather negligible for RV replication, glutamine could serve as donor of its amide ni-trogen in biosynthesis pathways for important metabolites. This study suggests that the capacity of RVs to induce metabolic alterations could evolve differently during natural infection. Thus, changes in cellular bioenergetics represent an important component of virus-host interactions and could complement our understanding of the viral preference for a distinct host cell population.
IMPORTANCE RV pathologies, especially during embryonal development, could be
connected with its impact on mitochondrial metabolism. With bioenergetic pheno-typing we pursued a rather novel approach in virology. For the first time it was shown that a virus infection could shift the bioenergetics of its infected host cell to a higher energetic state. Notably, the capacity to induce such alterations varied among different RV isolates. Thus, our data add viral adaptation of cellular metabolic activity to its specific needs as a novel aspect to virus-host evolution. In addition, this study emphasizes the implementation of different viral strains in the study of virus-host interactions and the use of bioenergetic phenotyping of infected cells as a biomarker for virus-induced pathological alterations.
KEYWORDS rubella virus, mitochondrial respiration, glycolysis, glucose uptake, 2-deoxyglucose, glutaminolysis, metabolic phenotype, nucleotide biosynthesis, kynurenine pathway, extracellular acidification rate, ECAR, extracellular flux analysis, oxygen consumption rate, OCR
Received29 May 2018Accepted19 June 2018
Accepted manuscript posted online27 June 2018
CitationBilz NC, Jahn K, Lorenz M, Lüdtke A, Hübschen JM, Geyer H, Mankertz A, Hübner D, Liebert UG, Claus C. 2018. Rubella viruses shift cellular bioenergetics to a more oxidative and glycolytic phenotype with a strain-specific requirement for glutamine. J Virol 92:e00934-18.
https://doi.org/10.1128/JVI.00934-18.
EditorJulie K. Pfeiffer, University of Texas Southwestern Medical Center
Copyright© 2018 American Society for Microbiology.All Rights Reserved. Address correspondence to Claudia Claus, claudia.claus@medizin.uni-leipzig.de. *Present address: Kristin Jahn, Institute of Biology and SIKT, University of Leipzig, Leipzig, Germany; Anja Lüdtke, IDT Biologika, Dessau-Rosslau, Germany; Henriette Geyer, Octapharma Biopharmaceuticals GmbH, Berlin, Germany.
N.C.B. and K.J. contributed equally to this article.
crossm
on November 6, 2019 by guest
http://jvi.asm.org/
T
he study of virus-host metabolic interactions affects various aspects of modern virology. The availability of energy and metabolic compounds influences not only the yield of virus progeny production but also the activation of immunological re-sponse pathways (1, 2). Hence, a number of viruses have evolved strategies to manip-ulate cellular metabolism. Glucose and glutamine as the main carbon sources of mammalian cells are essential for ATP generation and biosynthetic reactions. Glucose oxidation occurs during glycolysis with the generation of pyruvate and ATP. Pyruvate can enter the tricarboxylic acid (TCA) cycle as acetyl coenzyme A (acetyl-CoA). The TCA cycle is central for oxidization of nutrients to support electron flow along the electron transport chain and as such the production of ATP through oxidative phosphorylation (OXPHOS). Through oxidative glutaminolysis, glutamine can anaplerotically replenish the TCA cycle to enable continued generation of reducing equivalents (NADH and FADH2) and TCA cycle intermediates. Through these central functions, glucose and glutamine fuel not only cellular metabolism but also replication of a number of viruses, either solely or in combination. Due to the importance of glucose and glutamine for cellular proliferation, common aspects for viral diversion of central carbon pathways emerge, but no generalizations can be made (3). Even for members of one virus family different strategies were identified, as shown for human cytomegalovirus (HCMV) and herpes simplex virus 1 (HSV-1) as members of the family Herpesviridae. While HCMV increases glycolysis in various cell lines, the closely related HSV-1 does not (4). Vaccinia virus does not alter intermediates of glycolysis but instead depends on glutamine as an anaplerotic substrate for the TCA cycle (5). Dengue virus requires as exogenous nutrient just glucose without a further need for glutamine (6). In the case of HCMV and HSV-1, only both nutrients, glucose and glutamine, ensure optimal viral replication (7, 8). However, viral interaction with cellular metabolism is not in general an essential requirement for viral replication. There are examples for virus infections which exhaust cellular resources, including a decreased mitochondrial activity after expression of human immunodeficiency virus glycoprotein gp120 (9). Likewise, the expression of rabies virus phosphoprotein induces mitochondrial dysfunction due to its interaction with respiratory chain complex I (10).Rubella virus (RV) as a positive-stranded RNA virus of the family Rubiviridae is a representative agent for the study of virus-associated metabolic alterations. Its capsid protein localizes to mitochondria and interacts with important mitochondrial proteins such as p32 (11). RV titer is reduced by 2 orders of magnitude in cells with an impaired or a lack of a functional respiratory chain (12). Moreover, RV induces a significant increase in the activity of mitochondrial respiratory chain complex II (13). The aim of this study was to extent these initial observations on isolated mitochondria through a more comprehensive evaluation of the bioenergetic profile of RV-infected cells. Thus, RV infection was examined under selected supplementation with the important nutrients glucose, glutamine, and pyruvate. This was followed by assessment of the respiratory (based on the oxygen consumption rate [OCR]) and glycolytic (based on extracellular acidification rate [ECAR]) capacity of RV-infected epithelial (Vero and A549) cells and human umbilical vein endothelial cells (HUVECs) through extracellular flux analysis. OCR and ECAR can be used to determine the bioenergetic profile and metabolic capacity of a cell, which describes the maximum metabolic rate a cell can achieve (14, 15). Extracellular flux analysis indicated that under RV infection the cell’s energetic state was significantly elevated irrespective of its metabolic background. Furthermore, this study highlights two important findings for the requirement of glutamine for the RV-associated increase in both resting oxidative activity and reserve respiratory capac-ity. (i) The extent of the dependency on glutamine for the induction of these metabolic alterations appears to be RV strain specific. (ii) The dependency appears to be based on glutamine functions other than as a substrate for glutaminolysis, e.g., as a nitrogen donor for nucleotide, amino acid, or hexosamine biosynthesis (16). The end product of the hexosamine biosynthesis pathway in turn supports glycosylation processes. This is one of the first studies with such a comprehensive metabolic extracellular flux analysis of virus-infected cells. The complex exploration of multiple metabolic pathways by RV
Bilz et al. Journal of Virology
on November 6, 2019 by guest
http://jvi.asm.org/
and its dependency on glutamine extends our current knowledge on RV-associated pathologies. Furthermore, new insights were gained into viral mechanisms for the subversion of cellular metabolic functions.
RESULTS
Characterization of low-passaged clinical isolates of RV on Vero cells.During RV infection the activity of electron transport chain complex II or succinate dehydrogenase is increased (13), which indicates profound metabolic alterations under RV infection. Previous studies on the influence of RV on cellular metabolism were carried out with the Therien strain, which was selected for its high titer replication on Vero cells. Since Therien might not reflect general properties of RV strains, several clinical isolates of RV were used in this study besides Therien, such that currently circulating genotypes (1E, 1F, and 2B) were represented (17). Figure 1 shows the replication characteristics of these RV strains on Vero cells. Compared to Therien, all RV strains except Wb-12 replicated at a significantly lower replication rate (reflected by the amount of viral RNA in infected Vero cells) at 48 and 72 h postinfection (hpi; Fig. 1A). Accordingly, viral titers were lower, but the reduction in viral titers was not significant compared to Therien (Fig. 1B). Figure 1C reflects the heterogeneous course of infection of RV in cell culture: at 24 hpi, just about 25% of Vero cells were infected, which increased over the time of infection to 90 to 100% for Therien and Wb-12 strains and to 60 and 45% for the 03-03703 and 07-00426 strains, respectively (Fig. 1C). Compared to Therien, only for the 07-00426 strain was a significant reduction in the number of RV-infected cells noted (Fig. 1C); this was also reflected by the lower expression level of E1 protein, as identified by Western blotting at 72 hpi (Fig. 1D). Thus, RV strains differ in replication kinetics and viral progeny generation, which may be based on differences in the ability to influence cellular metabolism.
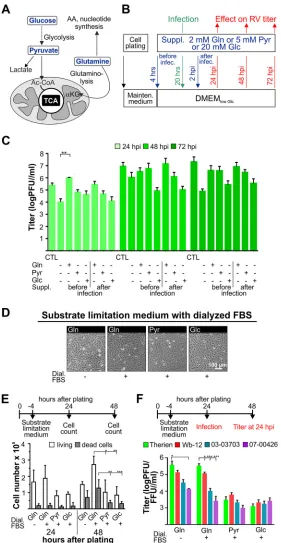
Nutrient starvation assays reveal the need of rubella virus for exogenous glutamine for efficient replication.For exogenous substrate supplementation assays, glutamine (2 mM) and glucose (low [physiological] at 5 mM and high at 25 mM) were chosen as the main carbon sources for mammalian cells, in addition to pyruvate (5 mM), which can enter the TCA cycle after its conversion to acetyl-CoA (Fig. 2A). Culture FIG 1Characterization of the replication rate of RV strains on Vero cells. (A) The number of viral RNA genomes was verified for the indicated time points by TaqMan RT-qPCR. (B) The amount of viral progeny generated over time of incubation was determined by plaque assay (Therien and Wb-12) and focus-forming assay (03-03703 and 07-00426). (C) The number of viral E1-positive cells was determined in random microscopic fields after immuno-fluorescence analysis with anti-E1 antibodies. Total cell number was quantified through counting of stained nuclei per microscopic field. (D) Western blot analysis of mock- and RV-infected Vero cells (72 hpi) with an antibody against RV E1 protein to compare its expression level among the indicated RV strains. A spliced image was used to combine data from different gels and to adhere to the order of the respective samples applied to the figures of the manuscript.
on November 6, 2019 by guest
http://jvi.asm.org/
[image:3.585.42.402.71.258.2]FIG 2Effect of selected substrate supplementation on RV replication and Vero cell growth rate.D-Glucose (Glc),L-glutamine (Gln), and sodium pyruvate (Pyr) as important carbon sources for mammalian cells were used for selected substrate supplementation (suppl.) of mock- and RV-infected Vero cells. (A) Summary of the metabolic pathways fueled by the applied nutrients. AA, amino acid;␣-KG,␣-ketoglutarate. (B) Schematic illustration of the application of the indicated supplements either 4 h after plating (supplementation before infection) or 2 hpi (supplementation after infection). (C) Viral titer (assessed for the Therien strain by a standard plaque assay) was determined for the indicated substrate supplementation conditions at 24, 48, and 72 hpi. CTL, control in maintenance medium. (D) For assessment of cell morphology and density under given substrate supplementation conditions, phase-contrast images of mock-infected Vero cells were obtained 24 h after plating before the initiation of infection with RV. (E) The number of live and dead cells was determined by trypan blue exclusion assay at 24 and 48 h after cell plating for the indicated substrate supplementation conditions. (F) Viral titers were determined by plaque assay (Therien and Wb-12) and focus-forming assay (03-03703 and 07-00426) at 24 hpi.
Bilz et al. Journal of Virology
on November 6, 2019 by guest
http://jvi.asm.org/
[image:4.585.66.347.69.612.2]medium without glucose, glutamine, and pyruvate was supplemented with 5% fetal bovine serum (FBS) and glucose at a physiological concentration of 5 mM (low-glucose Dulbecco modified Eagle medium [DMEMlow Glc]; see Materials and Methods). RV as a slow-replicating virus allowed for substrate supplementation at different time points before and after infection, which was carried out as shown in Fig. 2B. Glucose was never completely deprived, as under this condition endoplasmic reticulum stress can be induced (18). As a control, maintenance medium (DMEM with high glucose [25 mM glucose and 4 mM GlutaMAX] and 5% FBS) was included. Figure 1C shows the slow replication rate of RV; thus, viral replication kinetics under selected substrate supple-mentation were to be determined until 72 hpi. Initial experiments were carried out with Therien to identify relevant time points for further analysis of the effects associated with selected substrate supplementation. Compared to DMEMlow Glc, only supplementation with glutamine before infection led to a significant increase in virus titer at 24 hpi by 1 to 2 orders of magnitude (Fig. 2C). Under this condition, the virus titer was also higher than after cultivation with maintenance medium or glutamine supplementation after infection.
Thereafter, the influence of substrate supplementation on Vero cells was assessed, as this in turn could influence the RV infection rate. Since differences observed for substrate supplementation were greatest at 24 hpi (Fig. 2C), this time point was chosen for further analysis with dialyzed FBS such that traces of glutamine and glucose present in the serum could be excluded. At the time point of infection, a confluent cell monolayer (Fig. 2D) with comparable cell numbers (Fig. 2E) was present. Thus, an influence of substrate supplementation on viral replication through differences in cell numbers could be excluded. It is known and indicated in Fig. 2E that glutamine has a positive influence on cell division and growth. To separate this effect from other glutamine-associated aspects, glutamine supplementation was carried out under con-ditions of serum starvation, which inhibits cell division in Vero cells as efficiently as treatment with pharmacological drugs (19). While cell numbers were reduced at 48 h after plating under conditions of serum starvation (Fig. 2E), viral titers were comparable or even slightly higher than the ones obtained under supplementation with glutamine in the presence of FBS (Fig. 2F). This indicates that a reduced cell division rate under supplementation with pyruvate or glucose could not account for the reduction in viral titers compared to glutamine supplementation (Fig. 2C and F). Significant differences in the replication rate displayed by RV strains were only observed under supplementation with glutamine (Fig. 2F). In summary, the application of exogenous glutamine supports RV replication and reflects differences in the replication kinetics of RV strains.
Rubella virus increases the metabolic capacity of its host cell in a cell line-independent manner.The effect of exogenous glutamine on RV replication (Fig. 2C and F) suggests that RV replication requires distinct metabolic pathways and influences the bioenergetic profile of the infected host cell. The initial observation on an increased mitochondrial activity was made for isolated mitochondria (13). To determine the general effect of RV on cellular bioenergetics, oxidative (mitochondrial) metabolism, as indicated by the OCR, was determined through extracellular flux analysis with a Seahorse XFp Fluxanalyzer.
Figure 3A shows extracellular flux analysis performed on Vero cells infected with the laboratory strain Therien and three clinical isolates (WB-12, 03-03703, and 07-00426). The OCR was measured at 72 hpi, when the infection rate was approximately 90% or at least exceeding 50% (Fig. 1C). As summarized in Fig. 3B, the OCR obtained under basal and stressed conditions through application of a Mito stress test kit allowed the determination of basal respiration, spare respiratory capacity, and ATP production. Table 1 summarizes the values obtained for the respective measurement point during each of the extracellular flux cycles. The term “spare respiratory capacity” reflects the difference between the maximal OCR (as the maximal respiratory capacity) and basal (initial) OCR and describes the ability of a given cell type to cope with external stress. Figure 3C indicates that after infection with RV strains Therien and Wb-12 not only were basal OCR levels increased, but also spare respiratory capacity. Moreover, a
on November 6, 2019 by guest
http://jvi.asm.org/
FIG 3Oxygen consumption rate and metabolic phenotype of RV-infected epithelial cells (Vero and A549) and HUVECs. (A) The OCR was measured at 72 hpi in mock- and RV-infected Vero cells under basal and stressed conditions using Seahorse technology with a Mito stress test kit. Sequential injection of oligomycin (Oligom.), FCCP, and rotenone/antimycin A (Rot./Ant.) is indicated. (B) Calculation of mitochondrial activity was done as illustrated. Maximal respiration is the OCR after the injection of FCCP minus the OCR after injection of oligomycin. Proton leak is the OCR after the injection of rotenone/antimycin A minus OCR after injection of oligomycin. ATP production (based on respiration) is the difference between the basal respiration and the respiration after the injection of oligomycin. The spare respiratory capacity (SRC) is the OCR after the injection of FCCP minus the OCR at basal respiration (measurement point 3). (C) The data obtained in panel A were used to calculate the SRC and ATP production (ATP prod.), as described in panel B. (D) Metabolic phenotype indicative of the bioenergetic state of mock- and RV-infected Vero cells (72 hpi) generated through OCR and extracellular acidification rate (ECAR) values under basal (normal) conditions and stressed conditions (application of oxidative phosphorylation [OXPHOS]
(Continued on next page)
Bilz et al. Journal of Virology
on November 6, 2019 by guest
http://jvi.asm.org/
[image:6.585.45.401.68.620.2]significant increase in respiration-linked ATP production rate was detected. In contrast to Therien and Wb-12, metabolic activity after infection with strains 03-03703 and 07-00426 led to OCR values slightly higher or comparable to the mock-treated control, respectively. For all RV strains, the level of proton leak was comparable to the mock control (data not shown). The RV-induced shift of the metabolic phenotype of Therien-and Wb-12-infected Vero cells to a higher energetic state was further visualized in a metabolic phenogram obtained through plotting the OCR against the extracellular acidification rate (ECAR) values under basal and stressed conditions (Fig. 3D). Further-more, the OCR/ECAR ratio was determined, which under normal/unstressed conditions is low in cell lines with a high glycolytic rate (20). Infection with RV strains Therien and Wb-12 increased the OCR/ECAR ratio compared to the mock control, which points toward an increase in mitochondrial metabolic activity (Fig. 3E).
Vero cells as a permanent cell line with a nontumorigenic background (21) were used in a number of studies for the characterization of RV. To analyze whether the observed effects are cell type specific, metabolic assays were extended to two RV-susceptible human cell lines, A549 cells as a tumorigenic cell line and HUVECs as a primary cell line (13, 22). Due to the Warburg effect, tumor cell lines such as A549 rely on glycolysis, which was indicated by a rather low OCR/ECAR value of 2.6⫾0.8 for A549 compared to 3.7 ⫾ 1.3 for Vero cells and 4.1 ⫾ 1.8 for HUVEC cells (Table 1). A comparative analysis of the metabolic activity of these three cell lines, especially the high glycolytic rate in A549 cells, was illustrated in a recent publication (23).
In A549 cells (Fig. 3F), as well as in HUVECs (Fig. 3G), RV infection resulted in a significant increase in spare respiratory capacity. The metabolic phenotype generated for both cell lines points toward a shift of RV (Wb-12)-infected cells to a higher energetic profile (Fig. 3G and H). Comparable to Vero cells (Fig. 3E), a higher mitochon-drial metabolic activity was found in Wb-12-infected A549 cells and HUVECs, which was also reflected by an increase in the OCR/ECAR ratio (Fig. 3H). These data suggest that RV shifts its host cell to a higher energetic state with a significant increase in mito-chondrial metabolic activity. The extent of this influence varied among RV strains but
FIG 3Legend (Continued)
[image:7.585.40.549.103.238.2]inhibitors of the Mito stress test kit). (E) The ratio of the OCR to the ECAR was calculated based on the values obtained for baseline (normal) conditions in mock- and RV-infected Vero cells (72 hpi). An increase in the OCR/ECAR ratio compared to the mock-infected cells is indicative of a higher OXPHOS activity. (F and G) For mock- and RV-infected A549 (at 72 hpi) cells (F) and HUVECs (at 36 hpi) (G), the OCR was measured under basal and stressed conditions using a Mito stress test kit. Sequential injection of the indicated inhibitors was used to calculate the SRC and ATP production, as described in panel B, and to generate the metabolic phenotype. (H) OCR/ECAR ratio based on OCR and ECAR values obtained for baseline (normal) conditions in mock- and RV-infected A549 cells (72 hpi) and HUVECs (36 hpi). An increase in the OCR/ECAR ratio compared to mock-infected cells indicates a higher OXPHOS activity.
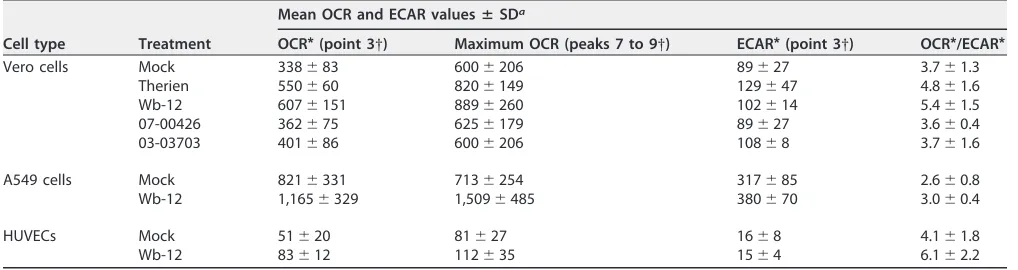
TABLE 1OCR and corresponding ECAR values obtained through extracellular flux analysis with the Mito stress test kit for RV strains and corresponding mock controls after infection of Vero cells (MOI of 5 at 72 hpi), A549 cells (MOI of 5 at 72 hpi), and HUVECs (MOI of 10 at 36 hpi)
Cell type Treatment
Mean OCR and ECAR valuesⴞSDa
OCR*(point 3†) Maximum OCR (peaks 7 to 9†) ECAR*(point 3†) OCR*/ECAR*
Vero cells Mock 338⫾83 600⫾206 89⫾27 3.7⫾1.3
Therien 550⫾60 820⫾149 129⫾47 4.8⫾1.6
Wb-12 607⫾151 889⫾260 102⫾14 5.4⫾1.5
07-00426 362⫾75 625⫾179 89⫾27 3.6⫾0.4
03-03703 401⫾86 600⫾206 108⫾8 3.7⫾1.6
A549 cells Mock 821⫾331 713⫾254 317⫾85 2.6⫾0.8
Wb-12 1,165⫾329 1,509⫾485 380⫾70 3.0⫾0.4
HUVECs Mock 51⫾20 81⫾27 16⫾8 4.1⫾1.8
Wb-12 83⫾12 112⫾35 15⫾4 6.1⫾2.2
a*, That is, the basal activity at measurement point 3, as published previously (20).†, As indicated in Fig. 3B.
on November 6, 2019 by guest
http://jvi.asm.org/
occurred in three different cell lines irrespective of the metabolic phenotype of these cell lines.
Metabolic alterations correlate with strain-specific, but genotype-independent cytopathogenicity. RV is generally considered a noncytopathogenic virus, but its replication in susceptible cell lines such as Vero cells is associated with cytopathic effect (CPE) induction. A higher metabolic activity could be associated with the production of reactive oxygen species (ROS). To be able to determine whether a correlation exists between the induction of metabolic alterations and CPE development, RV-associated cytotoxicity was investigated through cytotoxicity assessment with a MultiTox-Fluor multiplex assay. Wb-12 represents the genotype 2B with a worldwide distribution, so we wanted to include additional 2B strains in our experimental assays to determine whether parameters identified for Wb-12 could reflect general properties of 2B strains facilitating their worldwide distribution. However, at 72 hpi for Vero cells infected with indicated RV strains, no correlation between cytotoxic potential and RV genotype was revealed (Fig. 4A). Comparable to Therien and Wb-12, RV strains RA27/3 (vaccine strain) and Rub 1B displayed cytopathogenicity on Vero cells (Fig. 4A). Furthermore, an infection rate similar to that for Therien and Wb-12 was determined for these two strains through assessment of the number of E1-postive cells over the time of infection (Fig. 4B). RV strains BIH10-H-9 and RV114 lacked signs of cytopathogenicity (Fig. 4A) and were characterized by a lower infection rate than the aforementioned strains (Fig. 4B). As a next step, the OCR as a representative for the bioenergetic profile was determined for Vero cells infected with RA27/3, Rub 1B, BIH10-H-9, and RV114 (Fig. 4C and D). Basal FIG 4Analysis of the cytopathogenic and metabolic potential of selected RV strains representing clade 1 and 2 genotypes. (A) A fluorescence-based MultiTox-Fluor multiplex cytotoxicity assay was used to measure the number of live and dead cells at 72 hpi in Vero cells. The corresponding genotype is given in parentheses adjacent to the respective RV strain. (B) The number of viral E1-positive cells was determined in random microscopic fields by immunofluorescence analysis with anti-E1 antibodies. The total cell number was quantified by counting the stained nuclei per microscopic field. (C) The OCR was measured at 72 hpi in mock-infected and RV-infected (using the indicated strains) Vero cells under basal and stressed conditions using a Mito stress test kit. The sequential injection of the indicated inhibitors (oligomycin [Oligom.], FCCP, and rotenone/antimycin A [Rot./Ant.]) was used to calculate the SRC and ATP production (D), as described in Fig. 3B. OCR is expressed as the increase versus mock-infected cells (mock⫽100%).
Bilz et al. Journal of Virology
on November 6, 2019 by guest
http://jvi.asm.org/
[image:8.585.46.407.68.346.2]OCR and ATP production were increased under infection with RA27/3 and Rub 1B (genotype 1B) compared to the mock-treated control (Fig. 4C and D). The results for the attenuated RA27/3 strain suggest that the influence on mitochondrial metabolism is not associated with more severe clinical symptoms. Together, these data point to a RV strain-specific influence on mitochondrial activity, which in turn supports viral replica-tion and occurs irrespective of the genotype. Thereafter, assays were performed with Therien and Wb-12 as representatives for RV strains with a significant alteration of cellular metabolic activity.
Efficient rubella virus replication requires glycolytic activity irrespective of the supplement glutamine.The metabolic phenotype of RV-infected Vero cells (Fig. 3D) and the underlying ECAR values obtained under basal conditions (Table 1) suggest a shift of RV-infected cells to an increased glycolytic activity in addition to a higher mitochondrial respiration. To corroborate this observation, extracellular flux analysis was performed with the glycolysis stress test kit. A significant increase in basal glycolytic activity and glycolytic capacity was noted after infection with Therien and Wb-12 strains, whereas infection with 03-03703 led only to a slight and nonsignificant increase in comparison to the mock-treated cells (Fig. 5A and B). A further increase in ECAR was noted after the injection of oligomycin, which indicates that glycolysis was not operating under full capacity, but especially under Therien infection it came very close to it. This is also reflected by a significantly lower glycolytic reserve in Therien-infected Vero cells (Fig. 5B). In addition, basal ECAR prior to injection of glucose was higher for Therien and Wb-12 compared to the mock treatment and infection with RV strains 07-00426 and 03-03703. This could be due to nonglycolytic acidification by CO2 derived from other metabolic pathways, most importantly the TCA cycle. To confirm that the increase in ECAR was indeed associated with lactate secretion, its extracellular concentration was determined. In comparison to the mock-treated control, a significant increase in extracellular lactate concentration after infection with RV (Therien) was measured (Fig. 5C), evidenced by the RV-induced increase in glycolytic activity deter-mined by extracellular flux analysis (Fig. 5A). Next, we sought to determine whether this increased glycolytic rate was accompanied by an altered (i) glucose uptake rate and (ii) expression level of glucose transporters in addition to hexokinase II (HKII) as a rate-limiting enzyme of the glycolytic pathway.
Glucose uptake rates were measured with the fluorescently labeled glucose ana-logue 2-deoxy-2-[(7-nitro-2, 1, 3-benzoxadiazol-4-yl)amino]-D-glucose (2-NBDG), which inhibits the conversion of glucose to glucose-6-phosphate and accumulates in the cytoplasm (Fig. 5D). Glucose uptake was measured in DMEMlow Glcsupplemented with 2 mM glutamine to support glycolytic rate and as such glucose consumption. The glucose uptake rate was assessed qualitatively through microscopic analysis (Fig. 5D), as well as quantitatively through measurement of the 2-NBDG fluorescent signal on a microplate reader (Fig. 5E). While an increased rate was noted for Therien- and Wb-12-infected Vero cells, it was comparable to the mock-infected cells during infec-tion with 03-03703. Similar results were obtained for Therien-infected A549 cells (data not shown). However, the HKII expression level was comparable between mock- and Wb-12-infected Vero cells (Fig. 5F).
Thereafter, we assessed whether efficient RV replication requires glycolytic activity. The HKII inhibitor 2-deoxglucose (2-DG) was added at a concentration of 5 mM at different time points after infection. Viral progeny generation was most notably re-duced after its addition directly after infection (at 2 hpi) or at 24 hpi, while at 48 hpi only a mild reduction was noted (Fig. 5G). The reduction in RV titer after application of 2-DG was only significant under cultivation with exogenous glutamine (Fig. 5G). In summary, RV increased glycolytic activity and glucose uptake at a strain-specific efficiency to ensure high-level replication, which required glycolysis in the presence as well as in the absence of glutamine.
Rubella virus requires glutamine for efficient viral replication at a strain-specific extend.The data presented point toward a comprehensive influence of RV on cellular metabolism, including both mitochondrial metabolism and glycolysis. As a next
on November 6, 2019 by guest
http://jvi.asm.org/
step, the analysis of the influence posed by RV on cellular metabolism was comple-mented by the effect of daily supplementation with glutamine on both the intracellular ATP level and cellular bioenergetics. Wb-12 and 03-03703 strains were chosen for these assays, as they display characteristic differences in their influence on cellular bioener-getics (Fig. 3A). The viral influence on cellular ATP levels was analyzed with or without daily glutamine supplementation through the application scheme high-lighted in Fig. 6A. While intracellular ATP content at 72 hpi remained almost at a steady-state level in the mock-infected control, daily supplementation with glu-tamine had a notable effect on the intracellular ATP content in RV-infected Vero cells (Fig. 6B). This effect was present for infection with the two RV strains, Wb-12 and 03-03703. As a next step, we determined mitochondrial respiration through FIG 5Impact of rubella virus infection on cellular glycolytic activity and glucose uptake rate. (A) The extracellular flux measurement based on the medium conditions of the glycolysis stress test kit was applied at 72 hpi to Vero cells infected with the indicated RV strains. (B) Sequential injection of the substrate glucose and the inhibitors oligomycin (Oligom.) and 2-DG was used to calculate glycolytic capacity and reserve. (C) The observed increase in the ECAR in Therien-infected Vero cells (see panel A) was correlated with the extracellular lactate concentration at 72 hpi through the internal lactate standard of the glycolysis cell-based assay kit. (D and E) The glucose uptake rate was qualitatively analyzed through microscopic analysis (D) and quantitatively on a microplate reader for mock- and RV-infected Vero cells (72 hpi) through uptake of 2-NBDG as the fluorescent analogue of glucose (E). Cells were cultivated in DMEMlow Glcsupplemented with glutamine. (F) Extracts of mock- and RV-infected Vero cells
were obtained at 72 hpi and processed for Western blot analysis with anti-cofilin (loading control) and anti-hexokinase II (HKII) and anti-E1 antibodies. A spliced image of the same gel was used to adhere to the order of the respective samples applied to the figures in the manuscript. (G) The impact of the application of the glycolytic inhibitor 2-DG (at a concentration of 5 mM) at the indicated time points on the replication of RV strain Wb-12 was assessed by titer determination using a standard plaque assay.
Bilz et al. Journal of Virology
on November 6, 2019 by guest
http://jvi.asm.org/
[image:10.585.52.357.70.438.2]FIG 6Glutamine-centered cellular pathways contribute to metabolic alterations induced by RV at a strain-specific rate. (A) Application scheme for the supplementation of DMEMlow Glcwith (⫹) or without (⫺)
the daily addition of glutamine (Gln). Glutamine supplementation was started 4 h after plating. (B) The intracellular ATP content in mock- and RV-infected Vero cells (72 hpi) was determined by a CellTiter-Glo luminescent cell viability assay for the indicated substrate conditions. The relative fluorescence units (RFU) were normalized by dividing the average of each triplicate sample by the mean OD value of standard Bradford protein assay (blank corrected). (C and D) The bioenergetic profiles of mock- and RV-infected cells were determined after daily supplementation with glutamine. (C) The OCR was measured at 72 hpi in mock-infected and RV-infected (using the indicated strains) Vero cells under basal and stressed conditions using a Mito stress test kit. Sequential injection of indicated inhibitors (oligomycin [Oligom.], FCCP, and rotenone/antimycin A [Rot./Ant.]) was used for the calculation of the SRC and ATP production (D), as described in Fig. 3B. The OCR is expressed as the increase over mock-infected cells (mock⫽100%). (E) The ratio of the OCR to the ECAR was calculated with the values obtained for baseline (normal) conditions in mock- and RV-infected Vero cells (72 hpi). An increase in the OCR/ECAR ratio indicates a higher oxidative phosphorylation (OXPHOS) activity. (F) The impact of the glutaminase inhibitor BPTES (at a concentration of 10M) on the replication of RV strain Wb-12 was assessed by titer determination for supernatants collected at 48 hpi using standard plaque assay. (G) Western blot analysis of the PPAT expression level in Vero cells (72 hpi) after daily supplementation of DMEMlow Glcwith glutamine. (H) Representative images
(Continued on next page)
on November 6, 2019 by guest
http://jvi.asm.org/
[image:11.585.40.377.70.558.2]OCR values assessed for mock- and RV-infected Vero cells under daily supplemen-tation with glutamine (Fig. 6C). In contrast to the cultivation in maintenance medium, no differences were observed between the Wb-12 and 03-03703 strains. Both RV strains induced a significant increase in basal spare respiratory capacity (Fig. 6D) and the OCR/ECAR ratio (Fig. 6E). Thus, the capacity to induce a shift in the bioenergetic phenotype of the infected host cell appears to be a general property of RV strains, but the requirement for glutamine to induce this shift is rather strain specific.
Thereafter, we wanted to assess through which cellular pathway glutamine could support replication of RV strains. Through glutaminolysis, glutamine can anaplerotically fuel the TCA cycle. The application of BPTES [bis-2-(5-phenylacetamido-1,3,4-thiadiazol-2-yl)ethyl sulfide] as an inhibitor of glutaminase (GLS), the rate-limiting enzyme of glutaminolysis, had no effect on the replication of RV strain Wb-12 (Fig. 6F). The addition of BPTES at 2, 24, and 48 hpi did not alter RV replication (data not shown). Figure 6F shows the daily addition of BPTES (at 10M) before and after infection until supernatants were collected at 48 hpi. Through this approach, the duration of cultiva-tion in the presence of BPTES and its solvent dimethyl sulfoxide was maximized. Since glutaminolysis appeared not to be required for RV replication, the involvement of glutamine in cytoplasmic pathways was tested. Among these, the nucleotide biosyn-thesis pathway was examined through analysis of the expression level of one of the key enzymes, namely, phosphoribosyl pyrophosphate amidotransferase (PPAT). PPAT cat-alyzes the first rate-limiting step of purinede novosynthesis, which requires glutamine. Under RV infection, especially with the Wb-12 strain, the expression level of PPAT was notably increased compared to the mock-infected control (Fig. 6G). Thereafter, we further analyzed the observation made in Fig. 2F that the lack of FBS in the cultivation medium supported the replication of some RV strains. Figure 6H indicates that at 24 hpi the initial infection rate of the 03-03703 strain was higher in the absence of FBS compared to its presence. The calculation of the percentage of E1-positive cells under cultivation in DMEMlow Glc and with daily glutamine supplementation revealed that their number was only comparable between Wb-12 and 03-03703 strain in the absence of dialyzed FBS (Fig. 6I). This stands in contrast to the cultivation in the presence of FBS. Under this condition, the amount of E1-positive cells was significantly reduced for 03-03703 compared to Wb-12. However, Western blot analysis of the E1 expression rate showed that while the 0303703-associated E1 expression rate was higher after culti-vation in DMEMlow Glcand daily glutamine supplementation compared to maintenance medium (Fig. 1D), it was still lower than the one observed for Wb-12 (Fig. 6J). In conclusion, while glutamine in general supports RV replication, a strain-specific require-ment was noted for strains with a lower replication capacity. This was especially evident in the absence of FBS as a known inducer of a cell cycle arrest.
RV addresses key factors in cellular metabolic pathways.Transcriptome analysis of Wb-12-infected HUVECs and human saphenous vein endothelial cells (HSaVECs) was carried out to identify possible metabolic targets addressed by RV. This analysis yielded 834 and 769 differentially expressed genes (DEGs), respectively (24). In order to detect Wb-12-induced alterations of metabolic pathways, the DEGs were analyzed for biolog-ical process GO terms containing the word “mitochondria,” “mitochondrion,” “glu-tamine,” or “glycolysis.” Although no GO terms regarding these biological processes were enriched, 182 and 172 DEGS were found in HUVECs and HSaVECs, respectively, that contained GO terms involved in glutamine metabolism, glycolysis, or biological
FIG 6Legend (Continued)
obtained after immunofluorescence analysis performed at 24 hpi with anti-E1 antibody (shown in red) for RV-infected Vero cells. Experiments were performed under supplementation of DMEMlow Glcwith Gln in the
presence (⫹) or absence (⫺) of dialyzed (Dial.) FBS. (I) The immunofluorescence assays were used to calculate the number of E1-positive cells in random microscopic fields. The total cell number was quantified by counting the stained nuclei per microscopic field. (J) Western blot analysis of E1 expression level at 72 hpi after daily supplementation of DMEMlow Glcwith Gln in the presence (⫹) or absence (⫺) of dialyzed
(Dial.) FBS.
Bilz et al. Journal of Virology
on November 6, 2019 by guest
http://jvi.asm.org/
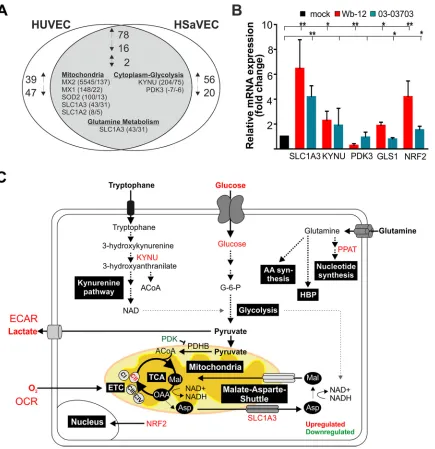
processes related to mitochondria. A total of 78 up- and 16 downregulated genes were assigned to these GO terms in both cell types, and two genes were contraregulated (Fig. 7A). For both cell lines, remarkable changes were noted for genes encoding myxovirus resistance 1 and 2 (MX1 and MX2), superoxide dismutase 2 (SOD2), solute carrier family 1, member 3 (SLC1A3), and the enzyme kynureninase (KYNU) of the kynurenine pathway. In this pathway L-tryptophan is metabolized to L-kynurenine, which subsequently leads to generation of the important metabolic intermediates acetyl-CoA and NAD⫹. Most notably, among the 16 commonly found in HUVEC and
HSaVEC downregulated genes, PDK3 (pyruvate dehydrogenase complex kinase) was detected. The PDH complex has a central role in glucose oxidation, as it catalyzes the rate-limiting oxidative decarboxylation of pyruvate into acetyl-CoA and as such directs the entry of pyruvate into the TCA cycle. Through the phosphorylation of PDH by PDKs, this enzyme is inhibited. Among the identified gene targets, the mRNA expression levels of SLC1A3, KYNU, and PDK3 were analyzed by quantitative real-time PCR (RT-qPCR) in Vero cells cultivated in maintenance medium and infected with RV strains Wb-12 and 03-03703. In addition, two other important factors involved in metabolic regulation were included: GLS1 (glutaminase 1 converts intracellular glutamine to glutamate [25]) and NRF2 (nuclear factor E2-related factor 2 activates as a transcription factor not only cytoprotective pathways but also influences cellular bioenergetics [26]). NRF2 was included in this experimental setup since it is upregulated at its mRNA level under Therien infection (13). Figure 7B indicates that identical cellular genes were addressed by both RV strains, irrespective of their ability to alter the metabolic activity of their host cells. The observed downregulation of PDK3 could support the entry of pyruvate into the TCA cycle. The expression level of all other factors was upregulated during Wb-12 and 03-03703 infection. In agreement with the effect of the inhibitor BPTES on RV replication, GLS1 was found to be slightly, but significantly upregulated at its mRNA level under Wb-12 infection. Notably and compared to 03-03703, the alter-ation of the transcript levels of all examined targets was more profound after infection with Wb-12 (Fig. 7B), which could be related to its higher capacity to increase mito-chondrial respiration. Figure 7C summarizes the cellular pathways affected by RV which were identified in this study.
DISCUSSION
The data of this study undermine RV as one of the few viruses with a complex influence on cellular metabolism. RV infection induces a metabolic shift of its infected host cell to a higher energetic level. This shift occurred irrespective of the cell type (endothelial or epithelial) or the metabolic background (nontumorigenic and tumori-genic). This is one of the first reports on an increase in metabolic activity that was assessed by extracellular flux analysis and involved both mitochondrial respiration (OCR) and glycolysis (ECAR). The requirement for exogenous glutamine differed among RV strains, which could in turn influence viral spread within its human host and the preference for a certain cell type. Cells of the immune system, including macrophages which were reported to enable RV persistence (27), have a high turnover rate of glutamine (28).
A comparable complexity of cellular metabolic alterations has so far only been reported for human cytomegalovirus (HCMV) (4, 7). The prevailing aspect the DNA virus HCMV has in common with RV is its rather slow replication cycle (29, 30). Both viruses have evolved strategies to meet their need for constant energy supply. In contrast to HCMV (7), RV was still able to replicate in the absence of glutamine. Glucose and glycolysis were also required for efficient RV replication in the presence of glutamine. Glucose and glutamine have overlapping metabolic functions (16, 31), which might explain why both nutrients are required for RV replication. Glycolytic intermediates could support fatty acid synthesis and fuel the pentose phosphate pathway and subsequently nucleotide synthesis. The RV-associated increase in glycolysis could also be a compensatory mechanism for the generation of oxidative stress through the higher rate of mitochondrial respiration (32). However, this seems rather unlikely. The
on November 6, 2019 by guest
http://jvi.asm.org/
addition of 2-DG had no detectable effect on CPE development (data not shown), and its effect on viral replication was more pronounced at early time points of infection than at later time points, when ROS induction and CPE development were noted (13).
How cells in general can modulate cellular metabolism to fulfill the needs of a high growth rate can be exemplified by two different glioblastoma cell lines. They were derived from the same parental cell line, but one is characterized by a slow growth rate and one by a high growth rate (33). Similar to the results shown here for RV, the faster cell growth rate was associated with a higher basal respiration and an increased spare respiratory capacity. However, in contrast to RV, this was connected with a high proton
FIG 7Analysis of cellular factors involved in metabolic alterations induced by RV. (A) Diagram showing the intersection between upregulated (1), downregulated (2), and contraregulated transcripts in HUVECs and HSaVECs after RV infection that were assigned for biological process GO terms containing the word “mitochondria,” “mitochondrion,” “glutamine,” or “glycolysis.” Data were obtained from microarray analyses described elsewhere (24). (B) Identified hits and relevant target genes were confirmed by RT-qPCR for cDNA samples derived from the RNA extracted at 72 hpi from Wb-12- and 03-03703-infected Vero cells (MOI of 5). The expression level is indicated relative to the corresponding mock-infected control (set as 1). SLC1A3, glutamate transporter/solute carrier family 1, member 3; KYNU, kynureninase; PDK3, pyruvate dehydrogenase complex (PDH) kinase 3; GLS1, glutaminase 1; NRF2, nuclear factor E2-related factor 2. (C) Summarizing figure for cellular targets with an altered expression level under RV infection with respect to their assigned metabolic pathways as outlined in the manuscript text. AA, amino acids; HBP, hexosamine biosynthesis pathway.
Bilz et al. Journal of Virology
on November 6, 2019 by guest
http://jvi.asm.org/
[image:14.585.45.480.69.518.2]leak and occurred without influence on glycolysis. This highlights that the increased flow of electrons from nutrients through the reducing equivalents NADH and FADH2, along the mitochondrial electron transport chain (ETC), appeared to be converted to ATP. There was no need to reduce ATP production through partial uncoupling of the TCA cycle flux from mitochondrial respiration, which would otherwise inhibit TCA cycle through feedback inhibition (33). The term “spare respiratory capacity” determines how a cell can survive under conditions of high energetic demands (34). Respiratory chain complex II was reported to represent the main source for spare respiratory capacity of a cell (35). RV specifically increases the activity of respiratory chain complex II (13), which could therefore participate in the observed increase in spare respiratory capacity. The dependence of high-titer replication of RV on glutamine appeared not to be based on glutaminolysis. Instead, the demand of RV for glutamine could be related to its role as a nitrogen donor for the synthesis of a number of metabolites. Among these, nucleotide biosynthesis could be a target for RV with its exceptionally high GC content of nearly 70%, since the ratio of cytoplasmic nucleotides is not equimolar (36, 37). Similar to the data shown here, the effect of the human immunodeficiency virus on glutamine metabolism in activated CD4⫹T cells was associated with an increase in the
expression level of PPAT (38). This may also explain the cell cycle delay reported for RV-infected cells (39, 40). During cell division, the cellular demand for several metab-olites, including nucleotides, is high (31), such that an inhibition of cell division could be advantageous for RV replication. Similarly, infection with murine norovirus as another example for an RNA virus with an influence on cell cycle progression showed an enrichment of infected cells in the G0/G1phase to support its replication (41). Hence, such metabolic alterations may not only be relevant for RV.
The positive influence of RV on the mRNA expression level of the enzyme kynureni-nase strengthens the importance of this pathway for virus infections (42, 43). The kynurenine pathway represents the first steps of the mammaliande novopathway for NAD formation (44). This pathway could be relevant for pathogenic agents such as RV, which consume the reducing equivalent NADH along the ETC at a high rate. The increased glycolytic activity under RV infection could support regeneration of the cytoplasmic NAD⫹pool. Since the mitochondrial membrane is impermeable to NADH,
the higher mRNA expression level of the transporter SLC1A3 as a component of the mitochondrial malate-aspartate shuttle could maintain mitochondrial supply with NADH. Thus, RV has not only evolved a complex means to subvert metabolic pathways for the efficient generation of its progeny. RV appears to maintain flow of metabolic intermediates, such that the compromise of cellular functions is minimal. However, this replenishment appears to be possible only until a certain threshold is reached and cytopathogenicity is induced. This helps to explain why a certain level of cytopatho-genicity was noted only for RV strains with the ability to induce metabolic alterations. The differential metabolic influence noted for RV strains in this study suggests that metabolic alterations should be a recognized component in the analysis of virus-host interactions. In the case of RV, the course of infection of the group of virus strains positive for metabolic alterations could differ in certain cell types from the one lacking these alterations. This will extend the virologist’s view on cellular metabolism as a building set for virus progeny generation to an important component of virus-host interaction and evolution. It is not only the variation in the metabolic background within the human population but also within the population of a given viral pathogen that could account for the clinical outcome of a virus infection.
MATERIALS AND METHODS
Reagents. The primary antibodies against cofilin (sc-33779) and hexokinase II (sc-6521) were purchased from Santa Cruz Biotechnologies. The primary antibodies against RV E1 were MAB925 (EMD Millipore Corp.) for Western blot analysis and MAb anti-E1 (Viral Antigens) for immunofluorescence. The primary antibody against PPAT (clone OTI1B8) was obtained from OriGene. Donkey IgG anti-mouse IgG(H⫹L)-Cy3 as the secondary antibody obtained was from Dianova. The glutaminase inhibitor BPTES was from Biomol. 2-DG was obtained from Santa Cruz Biotechnologies.
Virus strains, cell culture, and virus infection.In addition to RV laboratory strain F-Therien and vaccine strain RA27/3, various low-passaged clinical isolates were used, representing clade 1 (Rub 1B [1B],
on November 6, 2019 by guest
http://jvi.asm.org/
RVi/Gdansk.POL/14.07_07-00426 [07-00426, genotype 1E], and RVi/Prahova region.ROU/25.03_03-03703 [03-03703, genotype 1G]) and clade 2 (RVi/Wuerzburg.DEU/47.11_12-00009 [Wb-12, genotype 2B], BIH-10-H9, and RV 114 [2B]) genotypes.
Vero (CCL-81; American Type Culture Collection [ATCC]) and A549 (human lung carcinoma cell line; ATCC) were cultured in Dulbecco modified Eagle medium (DMEM) and in high glucose (25 mM) with GlutamMAX (Gibco, Thermo Fisher Scientific) and supplemented with 5% FBS and antibiotics (thereafter referred to as maintenance medium). HUVECs (pooled; PromoCell) were maintained in endothelial cell basal medium 2. For virus infection studies, Vero cells were incubated with RV in the respective cell culture medium for 2 h. For Vero and A549 cells, RV strains were applied at a multiplicity of infection (MOI) of 5 with the exception of an MOI of 7.5 applied for extracellular flux analysis and the MultiTox-Fluor multiplex cytotoxicity assay. An ATP assay was performed for an MOI of 5. According to a previous publication (22), HUVECs were infected at an MOI of 10 to achieve a high infection rate. Thereafter, the virus inoculum was replaced with fresh medium, and samples were incubated until further analysis. Standard plaque and focus-forming assays were used as described previously for the titer determination of RV strains with and without notable CPE induction, respectively (45).
Selected substrate availability assays.The starting point for all substrate supplementation assays was DMEM withoutD-glucose (Glc), sodium pyruvate (Pyr), andL-glutamine (Gln) (A14430-01; Gibco, Thermo Fisher Scientific), here referred to as DMEMw/o, which was supplemented with 5% FBS and a
physiological concentration of Glc of 5 mM, referred to here as DMEMlow Glc. Either starting 24 h before
infection (suppl.before infect.) or just at 2 h postinfection (suppl.after infect.), DMEMlow Glcwas supplemented
with 5 mM Pyr, 2 mM Gln, or 20 mM Glc (equal to the concentration in the maintenance medium). Some experiments were performed under daily supplementation (feeding) with 2 mM Gln. The application scheme is illustrated in Fig. 2B. For a similar set of experiments with regular FBS, the same batch was used. Dialyzed FBS was obtained from c.c.pro GmbH.
Glucose starvation assay.The glucose uptake of mock- and RV-infected Vero and A549 cells was determined with a cell-based glucose uptake kit from Cayman Chemical Company utilized according to the instructions given in the manual. The starvation conditions for maximal uptake of the fluorescent glucose analog 2-NBDG were incubation for 3 h with DMEMw/o, supplemented with 2 mM Gln, followed
by 24 h of incubation after supplementation with 80g/ml 2-NBDG. Accumulation of the fluorescent 2-NBDG in the cytoplasm was visualized on a fluorescence microscope and quantified on the Victor X3 microplate reader (Perkin-Elmer).
Assessment of cytotoxicity. Cytotoxicity based on a MultiTox-Fluor multiplex cytotoxicity assay (Promega) was determined as described previously (23). The ratio of live to dead cells was determined after fluorescence measurements on a Victor X3 microplate reader.
Quantification of extracellular lactate concentration.Secretion of lactate into the extracellular medium was determined with the cell-based glycolysis assay kit (Cayman Chemical Company) according to the manufacturer’s instructions.
ATP assay.According to the manufacturer’s instructions, intracellular ATP levels were determined by the CellTiter-Glo luminescent cell viability assay (Promega). Briefly, 96-well plates were subjected at 72 hpi to cell lysis with 100l of CellTiter-Glo reagent per well, and sample analysis was performed on a Victor X3 microplate reader. For equalization of the luminescence signal, plates were incubated for 30 min at room temperature. Duplicates of the respective samples were used for normalization with the optical density (OD) values obtained after determination of the protein concentration using a Bradford assay.
Metabolic assessment through extracellular flux analysis: analysis of the oxygen consumption rate and the extracellular acidification rate.The OCR and ECAR were measured using an XFp analyzer (Agilent Seahorse Technologies). XFp Seahorse plates were seeded with 20,000 Vero cells, A549 cells, and HUVECs per well. Culture medium was replaced by XF base medium (Agilent Seahorse Technologies) supplemented with 2 mM Gln, 2 mM Pyr, and 11 mM Glc with an adjusted pH of 7.4. The cells were then incubated at 37°C and 5% CO2for 1 h. Four compounds from the XFp cell Mito stress test kit (Agilent
Seahorse Technologies) were injected during the assay at the following final concentrations: oligomycin (2M),p-trifluoremethoxyphenylhydrazone (FCCP; 0.8M), and a mixture of antimycin A (0.5M) and rotenone (0.5M). The increase in the OCR after the application of FCCP reflects the spare respiratory capacity of a cell, the maximum respiratory rate that can be reached. The ECAR rate was verified through application of the glycolysis stress test kit (Agilent Seahorse Technologies). For the glycolysis stress test kit, the assay medium was just supplemented with 2 mM Gln. After manual injection of 10 mM glucose, 1M oligomycin was added, followed by 50 mM 2-DG. The injection of glucose to the so-far glucose-free medium allowed for correlation of an increase in the ECAR with a higher glycolytic rate. After the application of oligomycin, the glycolytic capacity of a cell can be calculated, which is the maximum glycolytic rate that can be achieved. For normalization, the protein content of each well was determined by a Bradford assay. Agilent Seahorse software Wave 2.3 was used for data analysis. According to a previous publication (46), the basal OCR and ECAR as determined at the third measurement point of the XFp cell Mito stress test kit was used to compare the metabolic activities of the infected samples with the mock-infected controls. The nine measurement points during application of the Mito and glycolysis stress test kits and the subsequent calculations are exemplified in Fig. 3B.
Identification of GO terms.Analysis of enriched biological processes of the differentially expressed genes after RV infection was carried out using the Cytoscape v 3.1.1 plugin ClueGO v2.1.1 (47) and revealed no significant overrepresentation of biological process GO terms involved in glutamine me-tabolism, glycolysis, or other biological processes related to mitochondria. To identify genes related to these biological processes using their annotation, DEGs of HUVECs and HSaVECs were filtered for all
Bilz et al. Journal of Virology
on November 6, 2019 by guest
http://jvi.asm.org/
biological process GO terms containing the word “mitochondria” or “mitochondrion” (338 GO terms), “glutamine” (55 GO terms), or “glycolysis” (30 GO terms) via the online database QuickGo (48).
Quantification of viral RNA genome copies.TaqMan-based one-step RT-qPCR was performed as described previously (45). Briefly, total RNA was extracted by MagnaPure technology. RV plasmid DNA was used as the DNA standard to calculate the RV genome copies, which are indicated as total copies per sample. A conserved region within the p90 gene was amplified with sense (RV_235.s, 5=-CTG CAC GAG ATY CAG GCC AAA CT-3=) and antisense (RV_419.as, 5=-ACG CAG ATC ACC TCC GCG GT-3=) primers and quantified by a TaqMan fluorogenic probe (RV_291TaqFAM, 6FAM-TCA AGA ACG CCG CCA CCT ACG AGC-BBQ).
Quantification of cellular mRNA.Total RNA was extracted from mock- and RV-infected Vero cells and HUVECs (35-mm dishes) with TRIzol reagent (Thermo Fisher Scientific), followed by purification with the Direct-zol RNA kit (Zymo Research). According to the manufacturer’s instructions, cellular DNA was removed by column-based digestion with DNase I. RNA integrity was verified through qualitative assessment on a fragment analyzer (Advanced Analytical). For the relative quantification of cellular mRNAs, the total RNA (1.5 to 2g) was reverse transcribed to cDNA with oligo(dT)18primer and AMV
reverse transcriptase (Promega) at 42°C for 1 h, followed by 10 min at 70°C. Quantitative real-time PCR was performed in a carousel-based LightCycler 2.0 (Roche) using SYBR green with a 1:5 dilution of the cDNA samples, 1g of bovine serum albumin, and GoTaq qPCR master mix (Promega). The oligonu-cleotide sequences are given in Table 2. The expression level of selected mRNAs was normalized to HPRT-1 (49) and quantified using the 2⫺ΔΔCTmethod.
Immunofluorescence analysis.Cells were cultivated on glass slides and, prior to fixation with 2% (wt/vol) paraformaldehyde, a phosphate-buffered saline (PBS) wash was applied. Thereafter permeabi-lization with ice-cold methanol was applied for 5 min, followed by blocking with 5% normal serum (Santa Cruz Biotechnology) for 30 min at 37°C in a humidified chamber. Samples were incubated with a 1:200 dilution of the anti-E1 antibody in PBS for 90 min at 37°C. After three wash steps with PBS, incubation with the secondary antibodies was performed for 60 min. Hoechst bisbenzamide 33285 (5 g/ml; Thermo Fisher Scientific) was used to counterstain cellular nuclear DNA. Fluoromount G (Biozol) was applied to mount samples. Images were obtained with an inverted Olympus XM10 microscope and processed using Corel Draw⫻7 with minimal alterations to brightness and contrast.
Western blot analysis.Proteins were extracted from cell monolayers with radioimmunoprecipitation assay buffer (c.c.pro GmbH) according to the manufacturer’s instructions. Standardized SDS-PAGE and electroblotting were performed as described previously (23). Briefly, after incubation with the primary antibody overnight at 4°C, the polyvinylidene difluoride membrane was transferred to secondary antibody and finally to ECL solution (LI-COR Biosciences) for chemiluminescence analysis. Data were collected with the C-DiGit blot scanner (LI-COR Biosciences), and images were adjusted with only slight alterations to brightness and contrast using Corel DRAW⫻7.
[image:17.585.41.372.93.269.2]Statistics.Data in the diagrams are shown as means⫾the standard deviations. The assay setup was based on two to three independent experiments comprising duplicates and triplicates as experimental replicates. Statistical significance was calculated using Prism software (GraphPad Software, Inc., La Jolla, CA). Differences in virus titers were determined with an unpaired nonparametric two-tailed Welch’sttest, while normalized mRNA expression levels were analyzed by a paired Studentttest. For comparison of more than two groups or samples with multiple experimental parameters, one-way analysis of variance (ANOVA), followed by Tukey’s post hoc analysis, was used. Data from extracellular flux analysis were subjected to two-way ANOVA, followed by a Sidac post hoc test. The level of significance is indicated in the diagrams by asterisks (*,P⬍0.05;**,P⬍0.01;***,P⬍0.001;****,P⬍0.0001).
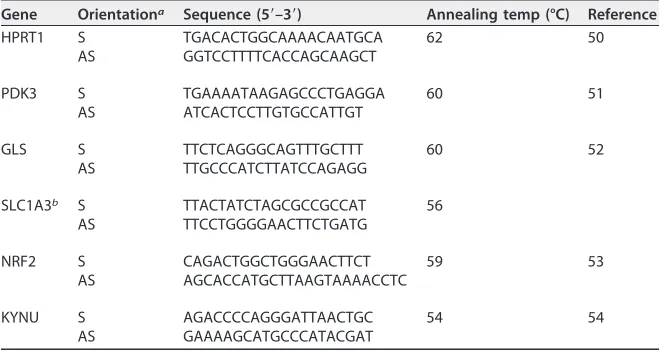
TABLE 2Sequences of oligonucleotide primers and the respective annealing temperatures used for qRT-PCR
Gene Orientationa Sequence (5=–3=) Annealing temp (°C) Reference
HPRT1 S TGACACTGGCAAAACAATGCA 62 50
AS GGTCCTTTTCACCAGCAAGCT
PDK3 S TGAAAATAAGAGCCCTGAGGA 60 51
AS ATCACTCCTTGTGCCATTGT
GLS S TTCTCAGGGCAGTTTGCTTT 60 52
AS TTGCCCATCTTATCCAGAGG
SLC1A3b S TTACTATCTAGCGCCGCCAT 56
AS TTCCTGGGGAACTTCTGATG
NRF2 S CAGACTGGCTGGGAACTTCT 59 53
AS AGCACCATGCTTAAGTAAAACCTC
KYNU S AGACCCCAGGGATTAACTGC 54 54
AS GAAAAGCATGCCCATACGAT
aS, sense; AS, antisense.
bDerived from public database RTPrimerDB.
on November 6, 2019 by guest
http://jvi.asm.org/
ACKNOWLEDGMENTS
This study was supported by DFG grant CL 459/3-1 to C.C.
We thank B. Weissbrich (University of Wuerzburg, Wuerzburg, Germany) for provid-ing the Wb-12 RV strain, Emilia Lupulescu (National Institute of Research-Development for Microbiology and Immunology Cantacuzino, Bucharest, Romania) for providing RV strain RVi/Prahova region.ROU/25.03, and Bogumila Litwinskaja (National Institute of Public Health–National Institute of Hygiene, Department of Virology, Warsaw, Poland) for providing RV strain RVi/Gdansk.POL/14.07. We also thank Knut Krohn and Petra Süptitz from the core unit DNA technologies, IZKF Leipzig, Medical Faculty of the University of Leipzig, Leipzig, Germany, for RNA quality assessment.
REFERENCES
1. Mills EL, O’Neill LA. 2016. Reprogramming mitochondrial metabolism in macrophages as an anti-inflammatory signal. Eur J Immunol 46:13–21. https://doi.org/10.1002/eji.201445427.
2. Hesterberg RS, Cleveland JL, Epling-Burnette PK. 2018. Role of poly-amines in immune cell functions. Med Sci 6:E22.https://doi.org/10.3390/ medsci6010022.
3. Sanchez EL, Lagunoff M. 2015. Viral activation of cellular metabolism. Virology 479-480:609 – 618.https://doi.org/10.1016/j.virol.2015.02.038. 4. Vastag L, Koyuncu E, Grady SL, Shenk TE, Rabinowitz JD. 2011. Divergent
effects of human cytomegalovirus and herpes simplex virus-1 on cellular metabolism. PLoS Pathog 7:e1002124.https://doi.org/10.1371/journal .ppat.1002124.
5. Fontaine KA, Camarda R, Lagunoff M. 2014. Vaccinia virus requires glutamine but not glucose for efficient replication. J Virol 88:4366 – 4374. https://doi.org/10.1128/JVI.03134-13.
6. Fontaine KA, Sanchez EL, Camarda R, Lagunoff M. 2015. Dengue virus induces and requires glycolysis for optimal replication. J Virol 89: 2358 –2366.https://doi.org/10.1128/JVI.02309-14.
7. Chambers JW, Maguire TG, Alwine JC. 2010. Glutamine metabolism is essential for human cytomegalovirus infection. J Virol 84:1867–1873. https://doi.org/10.1128/JVI.02123-09.
8. Lewis VJ, Jr, Scott LV. 1962. Nutritional requirements for the production of herpes simplex virus. I. Influence of glucose and glutamine of herpes simplex virus production by HeLa cells. J Bacteriol 83:475– 482. 9. Avdoshina V, Fields JA, Castellano P, Dedoni S, Palchik G, Trejo M, Adame
A, Rockenstein E, Eugenin E, Masliah E, Mocchetti I. 2016. The HIV protein gp120 alters mitochondrial dynamics in neurons. Neurotoxicity Res 29:583–593.https://doi.org/10.1007/s12640-016-9608-6.
10. Kammouni W, Wood H, Saleh A, Appolinario CM, Fernyhough P, Jackson AC. 2015. Rabies virus phosphoprotein interacts with mitochondrial complex I and induces mitochondrial dysfunction and oxidative stress. J Neurovirol 21:370 –382.https://doi.org/10.1007/s13365-015-0320-8. 11. Beatch MD, Hobman TC. 2000. Rubella virus capsid associates with host
cell protein p32 and localizes to mitochondria. J Virol 74:5569 –5576. https://doi.org/10.1128/JVI.74.12.5569-5576.2000.
12. Claus C, Chey S, Heinrich S, Reins M, Richardt B, Pinkert S, Fechner H, Gaunitz F, Schafer I, Seibel P, Liebert UG. 2011. Involvement of p32 and microtubules in alteration of mitochondrial functions by rubella virus. J Virol 85:3881–3892.https://doi.org/10.1128/JVI.02492-10.
13. Claus C, Schonefeld K, Hubner D, Chey S, Reibetanz U, Liebert UG. 2013. Activity increase in respiratory chain complexes by rubella virus with marginal induction of oxidative stress. J Virol 87:8481– 8492.https://doi .org/10.1128/JVI.00533-13.
14. Yang M, Chadwick AE, Dart C, Kamishima T, Quayle JM. 2017. Bioener-getic profile of human coronary artery smooth muscle cells and effect of metabolic intervention. PLoS One 12:e0177951.https://doi.org/10.1371/ journal.pone.0177951.
15. Mookerjee SA, Nicholls DG, Brand MD. 2016. Determining maximum glycolytic capacity using extracellular flux measurements. PLoS One 11:e0152016.https://doi.org/10.1371/journal.pone.0152016.
16. Wellen KE, Lu C, Mancuso A, Lemons JM, Ryczko M, Dennis JW, Rabi-nowitz JD, Coller HA, Thompson CB. 2010. The hexosamine biosynthetic pathway couples growth factor-induced glutamine uptake to glucose metabolism. Genes Dev 24:2784 –2799. https://doi.org/10.1101/gad .1985910.
17. Abernathy ES, Hubschen JM, Muller CP, Jin L, Brown D, Komase K, Mori
Y, Xu W, Zhu Z, Siqueira MM, Shulga S, Tikhonova N, Pattamadilok S, Incomserb P, Smit SB, Akoua-Koffi C, Bwogi J, Lim WW, Woo GK, Triki H, Jee Y, Mulders MN, de Filippis AM, Ahmed H, Ramamurty N, Feather-stone D, Icenogle JP. 2011. Status of global virologic surveillance for rubella viruses. J Infect Dis 204(Suppl 1):S524 –S532.https://doi.org/10 .1093/infdis/jir099.
18. Iurlaro R, Puschel F, Leon-Annicchiarico CL, O’Connor H, Martin SJ, Palou-Gramon D, Lucendo E, Munoz-Pinedo C. 2017. Glucose depriva-tion induces ATF4-mediated apoptosis through TRAIL death receptors. Mol Cell Biol 37:e00479-16.https://doi.org/10.1128/MCB.00479-16. 19. Claus C, Tzeng WP, Liebert UG, Frey TK. 2007. Analysis of the selective
advantage conferred by a C-E1 fusion protein synthesized by rubella virus DI RNAs. Virology 369:19 –34.https://doi.org/10.1016/j.virol.2007 .06.047.
20. Zhang J, Nuebel E, Wisidagama DR, Setoguchi K, Hong JS, Van Horn CM, Imam SS, Vergnes L, Malone CS, Koehler CM, Teitell MA. 2012. Measuring energy metabolism in cultured cells, including human pluripotent stem cells and differentiated cells. Nat Protoc 7:1068 –1085.https://doi.org/10 .1038/nprot.2012.048.
21. Manohar M, Orrison B, Peden K, Lewis AM, Jr. 2008. Assessing the tumorigenic phenotype of Vero cells in adult and newborn nude mice. Biologicals 36:65–72.https://doi.org/10.1016/j.biologicals.2007.06.002. 22. Perelygina L, Zheng Q, Metcalfe M, Icenogle J. 2013. Persistent infection
of human fetal endothelial cells with rubella virus. PLoS One 8:e73014. https://doi.org/10.1371/journal.pone.0073014.
23. Hubner D, Jahn K, Pinkert S, Bohnke J, Jung M, Fechner H, Rujescu D, Liebert UG, Claus C. 2017. Infection of iPSC lines with miscarriage-associated coxsackievirus and measles virus and teratogenic rubella virus as a model for viral impairment of early human embryogenesis. ACS Infect Dis 3:886 – 897.https://doi.org/10.1021/acsinfecdis.7b00103. 24. Geyer H, Bauer M, Neumann J, Ludde A, Rennert P, Friedrich N, Claus C, Perelygina L, Mankertz A. 2016. Gene expression profiling of rubella virus-infected primary endothelial cells of fetal and adult origin. Virol J 13:21.https://doi.org/10.1186/s12985-016-0475-9.
25. Jin L, Alesi GN, Kang S. 2016. Glutaminolysis as a target for cancer therapy. Oncogene 35:3619 –3625.https://doi.org/10.1038/onc.2015 .447.
26. Duarte FV, Amorim JA, Palmeira CM, Rolo AP. 2015. Regulation of mito-chondrial function and its impact in metabolic stress. Curr Med Chem 22:2468 –2479.https://doi.org/10.2174/0929867322666150514095910. 27. Perelygina L, Plotkin S, Russo P, Hautala T, Bonilla F, Ochs HD, Joshi A,
Routes J, Patel K, Wehr C, Icenogle J, Sullivan KE. 2016. Rubella persis-tence in epidermal keratinocytes and granuloma M2 macrophages in patients with primary immunodeficiencies. J Allergy Clin Immunol 138: 1436 –1439.https://doi.org/10.1016/j.jaci.2016.06.030.
28. Newsholme P. 2001. Why isL-glutamine metabolism important to cells of the immune system in health, postinjury, surgery or infection? J Nutr 131:2515s-2522s.https://doi.org/10.1093/jn/131.9.2515S.
29. Hemphill ML, Forng RY, Abernathy ES, Frey TK. 1988. Time course of virus-specific macromolecular synthesis during rubella virus infection in Vero cells. Virology 162:65–75.https://doi.org/10.1016/0042-6822(88)90 395-9.
30. Emery VC, Cope AV, Bowen EF, Gor D, Griffiths PD. 1999. The dynamics of human cytomegalovirus replication in vivo. J Exp Med 190:177–182. https://doi.org/10.1084/jem.190.2.177.
31. DeBerardinis RJ, Cheng T. 2010. Q’s next: the diverse functions of
Bilz et al. Journal of Virology