ENG4111/4112
–
U
NDERGRADUATE
D
ISSERTATION
P
ROJECT
R
EPORT
O
CTOBER
,
2016
R
ESEARCH
T
OPIC
:
U
NDERGROUND
C
HECK
S
URVEY
A DISSERTATION SUBMITTED BY:
BRAD COSTELLO
STUDENT NUMBER:
0061046613
SUPERVISOR:
3
A
BSTRACT
The wellbeing of the mine and underground workers directly rely on the accuracy of wall stations that controls the workings on the mine. Some of the daily responsibilities of a mine surveyor comprise of staking out construction lines to control the direction and gradient of development drives. When there is deviation in the direction and gradient of construction lines in relation to the design it can lead to damage to infrastructure within the mine that causes problems such as re-development or altering designs which are expensive. This is why it is significant high order check surveys are undertaken to follow up advancing capital development as a means to verify the quality of existing wall stations and provide accurate control to further advance into the mine.
The objective of the proposed research is to perform a high order control survey and adjust the observations of the traverse using a least squares adjustment incompliance with ICSM Class “D”. Variables of the network will be statistically assessed and important considerations in the check survey will be identified to educate and render the importance of check surveying.
Slope distance, direction and vertical angles were analysed to assess the quality of the check survey. It was observed that the greatest standardised residuals were located at the start and end of the survey. The assumption is that the traverse is closing onto another fixed control point which will lead to variation. Integrity of the original fixed control points was questioned as the fixed stations were verified in a check survey three years ago. Over three years wall stations are expected to move due to the nature of the mine.
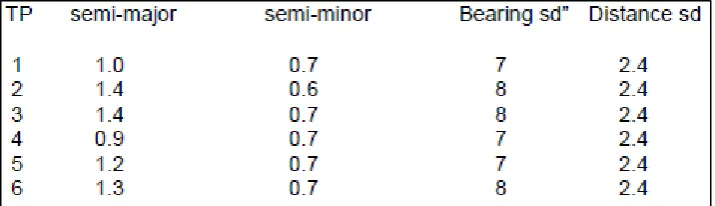
The absolute and relative error ellipses were analyse at a 95% confidence interval. It was observed that there was an azimuth deficiency in the Eastern direction which was caused by the orientation of the fixed control. The relative ellipses semi-major axis did not exceed the limitation of 50mm with the greatest semi-major axis being 27mm.
4
University of Southern Queensland
Faculty of Health, Engineering and Sciences
ENG4111/ENG4112 Research Project
L
IMITATIONS OF
U
SE
The Council of the University of Southern Queensland, its Faculty of
Health, Engineering & Sciences, and the staff of the University of
Southern Queensland, do not accept any responsibility for the truth,
accuracy or completeness of material contained within or associated
with this dissertation.
Persons using all or any part of this material do so at their own risk,
and not at the risk of the Council of the University of Southern
Queensland, its Faculty of Health, Engineering & Sciences or the staff
of the University of Southern Queensland.
This dissertation reports an educational exercise and has no purpose
or validity beyond this exercise. The sole purpose of the course pair
entitled “Research Project” is to contribute to the overall education
within the student’s chosen degree program. This document, the
associated hardware, software, drawings, and other material set out
in the associated appendices should not be used for any other
5
C
ERTIFICATION OF
D
ISSERTATION
I certify that the ideas, designs and experimental work, results,
analyses and conclusions set out in this dissertation are entirely my
own efforts, except where otherwise indicated and acknowledged.
I further certify that the work is original and has not been previously
submitted for assessment in any other course or institution, except
where specifically stated.
B
RAD
C
OSTELLO
_____________________
S
TUDENT
N
UMBER
:
0061046613
6
A
CKNOWLEDGEMENTS
Appreciation for the completion of this dissertation is due to my supervisor Ms
Zahra Gharineiat. As supervisor of the project she provided extensive knowledge
and guidance. A thanks must go to the survey team at Mount Isa Copper
Operations for their time, resources and constant support and guidance for the
duration of the research project.
Mr Frank Smith played a key role in the dissertation providing CompNet least
squares adjustment program. Not only did Mr Smith generously loan the
program but also provided feedback and direction with his extensive knowledge
in relation to control networks.
Luke Czaban and Callum McNaughton were a great help throughout the year
7
T
ABLE OF
C
ONTENTS
1. Chapter 1: Introduction ... 14
1.1 Overview ... 14
1.2 Background ... 14
1.3 Project Aims & Objectives ... 15
1.4 Justification ... 16
1.5 Conclusion ... 17
2. Chapter 2: Literature Review ... 18
2.1 Introduction ... 18
2.2 Standards and Practices for Control Surveys (SP1) v2.1; ICSM ... 18
2.3 Wall Stations in Metalliferous Mining ... 24
2.4 Recent Changes in Underground Traversing Techniques in Western Australia – A.Jarosz & L.Shepherd ... 27
2.5 Least Squares Adjustment ... 28
2.6 Conclusion ... 30
3. Chapter 3: Methodology ... 31
3.1 Introduction ... 31
3.2 Study Area ... 31
3.3 Importance ... 32
3.4 Wall Station Surveying ... 33
3.5 Fixed Stations ... 35
8
3.7 Check Survey Processing ... 37
3.8 Equipment Checks ... 37
3.8.1 Total Station ... 37
3.8.2 Wall Station Prisms ... 38
3.8.3 Tripod ... 39
3.8.4 Kestrel ... 39
3.9 Scope & Limitations ... 40
3.10 Conclusion ... 40
4. Chapter 4 – Results ... 41
4.1 Introduction ... 41
4.2 Summary of Survey ... 41
4.3 Reliability of Measurements ... 43
4.3.1 Precision ... 44
4.3.2 Accuracy ... 45
4.3.3 Uncertainty ... 45
4.4 Traversing ... 46
4.4.1 Open Traverse ... 46
4.4.2 Closed Traverse ... 47
4.5 Least Squares Adjustment (CompNet) ... 47
4.5.1 Iteration ... 47
4.5.2 Adjustment Redundancies ... 48
4.5.3 Most Probable Value ... 48
4.5.4 Residuals ... 49
4.5.5 Standard Deviations ... 49
4.5.6 Standardised Residuals ... 50
4.6 Integrity tests ... 50
4.6.1 Chi-square Test ... 51
9
4.7 Conclusion ... 53
5. Chapter 5 – Discussion ... 54
5.1 Introduction ... 54
5.2 Theory of Errors ... 54
5.2.1 Systematic Errors ... 54
5.2.2 Random Errors ... 55
5.2.3 Gross Errors ... 56
5.3 Effects of External Factors ... 56
5.3.1 Illumination ... 56
5.3.2 Refraction ... 56
5.3.3 Ground Conditions ... 57
5.3.4 Mechanical ... 57
5.3.5 Ventilation ... 57
5.4 Global Precisions (Predicted Errors) ... 57
5.4.1 Predicted Error Constants ... 58
5.5 Statistical Analysis ... 58
5.5.1 Slope distances ... 58
5.5.2 Directions and Vertical Angles ... 63
5.6 Precision Measures ... 66
5.6.1 Error Ellipses... 66
5.7 Number of Stations in Resection ... 72
5.8 Geometry of Stations in Resection ... 78
5.9 Error Propagation ... 79
5.10 Conclusion ... 80
6. Chapter 6 – Conclusion ... 81
6.1 Introduction ... 81
6.2 Important Considerations ... 81
10
7. Chapter 7 – Recommendations ... 84
7.1 Introduction ... 84
7.2 Minimally Constrained (Free) Adjustment ... 84
7.3 Tunnel Deformation Effect of Wall Stations ... 84
7.4 Gyroscope Observation... 85
7.5 Misalignment of Optical Centre and Nodal Point of Prism ... 85
7.6 Planning of Underground Survey Networks ... 86
7.7 Conclusion ... 86
8. References ... 87
9. Appendices ... 90
Appendix A: Project Specification ... 90
Appendix B: EDM Calibration ... 92
Appendix C: Kestrel Calibration ... 93
Appendix D: Atmospheric Data ... 94
Appendix E: Field Sheets of Site ... 96
Appendix F: Adjusted Coordinates ... 100
11
L
IST OF
F
IGURES
Figure 2-1 Wall Station Leica Circular Prism (McCormack, 2002) ... 24
Figure 2-2 Aluminium Sleeve (McCormack, 2002) ... 25
Figure 2-3 Two Point Resection (Grocock, 2014) ... 25
Figure 2-4 Three Point Resection (Grocock, 2014) ... 26
Figure 2-5 Replacement of Right Angled Triangles with Narrow Triangles (Shepherd & Jarosz, 2006) ... 28
Figure 3-1 Mount Isa, Queensland Map (Mount Isa Mines Rotary Rodeo, 2016) ... 32
Figure 3-2 Wall Station Prism placed into Sleeve ... 33
Figure 3-3 Check Survey traversing up the Incline ... 36
Figure 4-1 Survey Network in CompNet ... 42
Figure 4-2 CompNet Adjustment Measures ... 43
Figure 4-3 High Precision & Low Accuracy ... 44
Figure 4-4 High Accuracy & Low Precision ... 45
Figure 5-1 Standardised Residuals – Slope Distances ... 59
Figure 5-2 Derived RMS Deviation Slope Distances ... 60
Figure 5-3 Derived RMS Deviation Direction ... 61
Figure 5-4 Derived RMS Deviation Vertical Angle ... 61
Figure 5-5 Effect of Derived RMS Deviation ... 62
Figure 5-6 Metres Derived RMS Deviations ... 62
Figure 5-7 5-20 Metres Derived RMS Deviations ... 63
Figure 5-8 Direction and Vertical Angle Standardised Residuals ... 64
Figure 5-9 Vertical Angle Offsets ... 65
Figure 5-10 Error Rectangle ... 66
Figure 5-11 Absolute Error Ellipses ... 68
Figure 5-12 2D Absolute Ellipses 95% CI ... 69
Figure 5-13 Adjusted Coordinates ... 70
Figure 5-14 Orientation of Fixed Stations ... 71
Figure 5-15 Two Point Resection ... 73
Figure 5-16 Three Point Resection ... 74
12
L
IST OF TABLES
Table 2-1 Classification of Horizontal Control Survey (Inter-governmental Committee on Surveying and
Mapping (SP1) v1.7, 2007) ... 20
Table 2-2 Horizontal Angle Observation Requirements (Inter-governmental Committee on Surveying and Mapping (SP1) v1.7, 2007) ... 22
Table 2-3 Astronomical Azimuth Observation Requirement (Inter-governmental Committee on Surveying and Mapping (SP1) v1.7, 2007) ... 23
Table 5-1 Two Point Resection Options ... 73
Table 5-2 Two Point Resection Solutions ... 73
Table 5-3 Three Point Resection Options ... 74
Table 5-4 Three Point Resection Solutions ... 75
Table 5-5 Four Point Resection Options ... 76
13
A
BBREVIATIONS
&
N
OMENCLATURE
B&D – Bearing and distance CI – Confidence Interval SF – Scale Factor
TS – Total station
USQ – University of Southern Queensland
ICSM – Intergovernmental Committee on Surveying and Mapping EDM – Electronic Distance Measurement
FL/FR – Face Left/Face Right CMS – Cavity Monitor Scan
CALS – Cavity Auto scanning Laser System
SP1 – Special Publication 1 (Standard for the Australian Survey Control Network) SBQ – Surveyor’s Board of Queensland
MPV – Most Probable Value ENT – Enterprise
14
1.
C
HAPTER
1:
I
NTRODUCTION
1.1 O
VERVIEW
Mount Isa Mines is controlled by Glecore Xstrata Copper which is a section of its North Queensland Operations. Some of the tasks involve mining, processing and smelting processes in Mount Isa and just mining and processing at Cloncurry and then Townsville control refining and port operations. The method of mining used at Mount Isa involves the ore broken down underground and then transported to the surface. Once the ore has been brought to the surface it is then grounded finely and then goes to the flotation operation, in this stage the copper- bearing sulphide minerals are separated and concentrated from the waste. Once the ore has completed these processes, the concentrated ore is sent to the smelter.
At Mount Isa Copper Operations (MICO) there are two underground mines which are called X41 and Enterprise (ENT). The survey department at Mount Isa performs surveys in both X41 and Enterprise to meet the demands of production and development of the mine. In order for the surveying department to remain confident in their everyday work, checks need to be implemented which is why check surveys are completed. Check survey traverses are an integral part of underground mine surveying. A check survey involves using high precision surveying techniques to transfer survey control from an area of established checked control to one with either no control, or survey control of low order. High order check surveys will follow up advancing capital development as a means to verify the quality of existing wall stations and provide accurate control to further advance into the mine.
1.2 B
ACKGROUND
“In underground mines the mine surveyor will determine and control the location and direction of tunnels as well as the mapping of all underground tunnels” (Surveyors Board of Queensland, 2016). Some of the work that an underground metalliferous surveyor can perform includes:
- Survey heading (as mined) pick ups
- Survey for development headings
- Lasers for development headings
- Survey for production mark ups
15
- Survey for raisebore set outs
- Survey for diamond drill hole set outs
- Survey for Cavity Monitor Scan (CMS) and Cavity Auto scanning Laser System (CALS)
In order to relay mining instructions to underground mining staff, a survey memorandum is created detailing the control that survey have provided, how it relates to the design that is to be mined and any pertinent safety information that the miner should be aware of.
With the constant demand of the mine, the survey department is required to communicate instructions to mining staff as to what needs to be done. The mine surveyor must be able to ensure that all the survey work is in the correct position in relation to the mine’s baselines to prevent mishaps such as; drilling operations drilled in the wrong position and not hitting the target which impacts on the production of the mine and raise bore drilling machine not hitting their targets. It is essential that mine surveyors prevent mishaps like these from happening as problems can potentially cost jobs, money and lives.
As a general operating procedure, high order “check” surveys will follow up advancing capital development as a means to verify the quality of existing wall stations and provide accurate control to further advance into the mine.
1.3 P
ROJECT
A
IMS
&
O
BJECTIVES
Check surveys is a procedure which all mine surveyors should understand the importance and processes of. As no literature was found that discussed the process of the check survey method the dissertation aims to outline the need for check surveying and the important considerations of the practice.
The aims and objectives of the proposed research is to:
- Perform a high order control survey and adjust the observations of the traverse using a least squares adjustment.
- The observations in the check survey to the wall stations will be will be in compliance with the ICSM standards of a Class “D” primary survey control network.
- The least squares adjustment will be broken down to analyse the results of slope distances, directions and vertical angles and analyse the behaviour and reasoning of the survey data.
16
- The wall station resection method will be theoretically analysed to portray the importance of the number of wall station in a resection and the geometrical relationship of the instrument to the wall stations.
- The main objective is to help mine surveyors understand the process of check surveys and show the importance of regularly performing high order controls surveys. While rendering the possible issues that can affect accuracy and quality when completing an underground check survey.
1.4 J
USTIFICATION
Mine surveying has been well-defined by the International Society of Mine Surveyors as “the art of making such field observations and measurements as are necessary to determine the positions, areas or volumes of natural and man-made features on the earth's surface” (International Society for Mine Surveying, 2011).
The environment of an underground mine in which the mine surveyor performs everyday tasks is regulated by accuracy requirements imposed by the country. The wellbeing of the mine and workers directly rely on the accuracy of survey network wall stations that controls the workings on the mine. A mine surveyor has daily responsibilities that need to be implemented to exacting limits of error. Some of the daily responsibilities of a mine surveyor comprise of staking out construction lines to control the direction and gradient of development drives. When there is deviation in the direction and gradient of construction lines in relation to the design it can lead to damage to infrastructure within the mine that causes problems such as re-development or altering designs which are expensive. Permanent damage to the infrastructure of the mine can be caused by grading and directions having deviation from what was planned and designed. These deviations can potentially lead to altering the design of the mine that was originally intended or making amendments to the development which are both expensive outcomes. Consequently, it’s vital that the quality of the accuracy of primary survey network is in compliance with the standards of accuracy and the wall stations used to stake out information are in agreement to the mine’s design.
17
1.5 C
ONCLUSION
18
2.
C
HAPTER
2:
L
ITERATURE
R
EVIEW
2.1
I
NTRODUCTION
The objective of this chapter is to provide information in relation to control networks and demonstrate relationships with literature. This will be achieved by identifying methods and data with their limitations and making comments on the relevance to this research project. The literature review will provide a reliable and traceable base and will show relationships links with other literature.
2.2 S
TANDARDS AND
P
RACTICES FOR
C
ONTROL
S
URVEYS
(SP1)
V
2.1;
ICSM
The Mine Surveyor have “in recent times been forced to adapt to a role that sees them ensuring that the core business drivers of their employers are met, while at the same time ensuring that all work is performed in compliance with all the relevant Safety and Health and company Standards and Procedures” (Cawood & Richards, 2007).
To completely understand the significance of the standards in place a summary of the important factors will be discussed. Bannister stated that “understanding the minimum standards of accuracy that limit the accuracy of the measurement techniques is but one step to ensuring specifications are achieved”.
19 accuracy standards and expectations and suggested practices for the documentation process.
The key concept taken out of the SP1 is that the quality of all underground surveys must comply with Class D of the survey standards. This also agrees with Guidance Note QGN19 - Mine surveying and drafting published in 2011 as it states each control network underground when feasible should have a close which is in compliance with the standards of accuracy as stated in ICSM, SP1 Class D. Adjustment by the method of least squares is demanded by these standards; producing the necessary statistics to carry out the evaluation also requires the use of this technique (Grocock, 2014). The document is critically imperative as it states the class needed to be achieved in the traverse and it provides a basis of professional practice.
The first chapter that is relevant to this dissertation is Part A – Standards of Accuracy SP1 v2.1. The success of the underground traverse relies on agreeance with the SP1 in regards to class and order. Part A uses the standard confidence interval as the standard for statistical analysis which is used to determine the class and order. Class has a purpose of intended and achieved precision of a survey network. The SP1 defines class as:
“CLASS is a function of the precision of a survey network, reflecting the precision of observations as well as suitability of network design, survey methods, instruments and reduction techniques used in that survey. Preferably the CLASS is verified by an analysis of the minimally constrained least squares adjustment of the network.”
20 The major ellipse is to be less than or equal to (<=) the maximum allowable semi-major axis length using the equation explained in SP1:
r = c ( d + 0.2 ) Where:
r = length of maximum allowable semi-major axis in mm.
c = an empirically derived factor represented by historically accepted precision for
a particular standard of survey.
d = distance to any station in km.
(Inter-governmental Committee on Surveying and Mapping (SP1) v1.7, 2007)
The values of c assigned to various CLASSES of survey are shown in Table 2-1 below from SP1.
Table 2-1 Classification of Horizontal Control Survey (Inter-governmental Committee on Surveying and Mapping (SP1) v1.7, 2007)
CLASS C
(for one sigma)
Typical applications
3A 1 Special high precision surveys
2A 3 High precision National geodetic surveys
A 7.5 National and State geodetic surveys B 15 Densification of geodetic survey C 30 Survey coordination projects D 50 Lower CLASS projects
E 100 Lower CLASS projects
It is noted that for a Class D survey which is relevant to any underground survey, the c value used is 50. By using the equation r = c ( d + 0.2 ) for a class “D” survey for a comparative distance of 100 metres the length of allowable semi-major axis is determined as 0.015 metres.
21 ancillary equipment should be regularly calibrated, carry unique identifiers, and (where relevant) be regularly compared against each other” (Inter-governmental Committee on Surveying and Mapping (SP1) v1.7, 2007). The “frequency standard should be traceable to the national standard, and calibrated once per year (Inter-governmental Committee on Surveying and Mapping (SP1) v1.7, 2007).
22
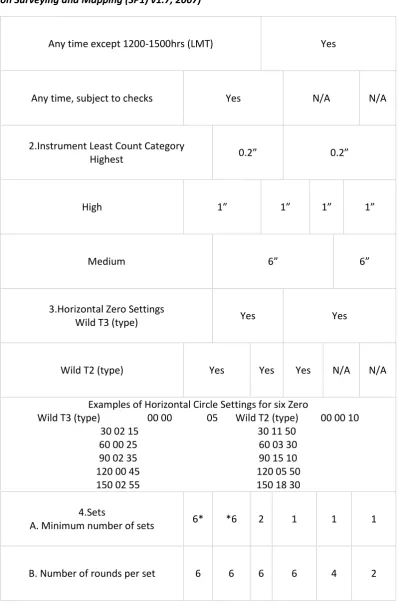
Table 2-2 Horizontal Angle Observation Requirements (Inter-governmental Committee on Surveying and Mapping (SP1) v1.7, 2007)
Any time except 1200-1500hrs (LMT) Yes
Any time, subject to checks Yes N/A N/A
2.Instrument Least Count Category
Highest 0.2” 0.2”
High 1” 1” 1” 1”
Medium 6” 6”
3.Horizontal Zero Settings
Wild T3 (type) Yes Yes
Wild T2 (type) Yes Yes Yes N/A N/A
Examples of Horizontal Circle Settings for six Zero
Wild T3 (type) 00 00 05 Wild T2 (type) 00 00 10 30 02 15 30 11 50
60 00 25 60 03 30 90 02 35 90 15 10 120 00 45 120 05 50 150 02 55 150 18 30 4.Sets
A. Minimum number of sets 6* *6 2 1 1 1
23 “The following table should be used as a guide to achieve results commensurate with the CLASS of survey required” (Inter-governmental Committee on Surveying and Mapping (SP1) v1.7, 2007). It is noted that for class C and lower it is expected that the equipment (theodolite) will be 1” least count.
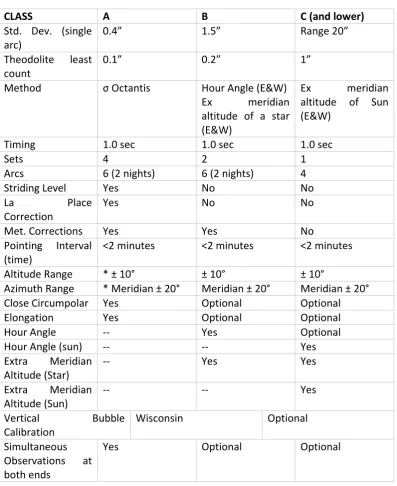
Table 2-3 Astronomical Azimuth Observation Requirement (Inter-governmental Committee on Surveying and Mapping (SP1) v1.7, 2007)
CLASS A B C (and lower)
Std. Dev. (single arc)
0.4” 1.5” Range 20”
Theodolite least count
0.1” 0.2” 1”
Method σ Octantis Hour Angle (E&W) Ex meridian altitude of a star (E&W)
Ex meridian altitude of Sun (E&W)
Timing 1.0 sec 1.0 sec 1.0 sec
Sets 4 2 1
Arcs 6 (2 nights) 6 (2 nights) 4 Striding Level Yes No No La Place
Correction
Yes No No
Met. Corrections Yes Yes No Pointing Interval
(time)
<2 minutes <2 minutes <2 minutes
Altitude Range * ± 10° ± 10° ± 10°
Azimuth Range * Meridian ± 20° Meridian ± 20° Meridian ± 20° Close Circumpolar Yes Optional Optional Elongation Yes Optional Optional Hour Angle -- Yes Optional Hour Angle (sun) -- -- Yes Extra Meridian
Altitude (Star)
-- Yes Yes
Extra Meridian Altitude (Sun)
-- -- Yes
Vertical Bubble Calibration
Wisconsin Optional
Simultaneous Observations at both ends
24 For this research project, the check survey will have to meet the standards of a Class “D” primary survey network which is identified in SP1. In order for the check survey to be accepted and a means to verify the quality of original control it is essential that the survey standards are met.
2.3 W
ALL
S
TATIONS IN
M
ETALLIFEROUS
M
INING
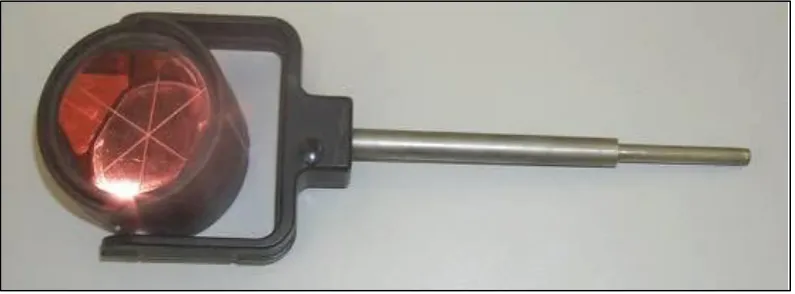
[image:23.595.100.498.355.502.2]In an underground metalliferous mine, wall stations are strategically placed approximately 1.3-1.6 metres high from the floor along the side walls of the drive. A wall station is generally a standard circular prism which is attached to a specifically designed spigot which is inserted into a drilled hole which is approximately 12mm in diameter. The wall station is illustrated in Figure 2-1.
Figure 2-1 Wall Station Leica Circular Prism (McCormack, 2002)
25
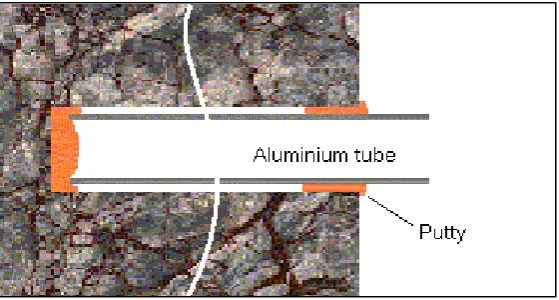
Figure 2-2 Aluminium Sleeve (McCormack, 2002)
[image:24.595.101.381.99.249.2]Similar to conventional stations, the location and placement of wall stations directly impacts the accuracy of the wall station. According to Accuracy of Wall Stations Surveys by Smith and successively reinforced by McCormack in Wall Stations (Reference Points), the “accuracy of wall station surveys is dictated in part by the geometric relationship of the instrument station to the wall stations used for fixation” (Grocock, 2014). Smith compares the differences in error when performing a two and three wall station resection. The resection for both two point and three point had an arbitrary baseline of 25 metres and “six resection stations were established in varying relationships to the wall stations, each observing a forward station some 80 metres distant from the closer wall station.” (Grocock, 2014).
26
Figure 2-4 Three Point Resection (Grocock, 2014)
When comparing the two tables it is evident that there is a significant progression in both semi-minor and semi-major axes of absolute error, this is the both station precision. There is also an improvement in the forward bearing precision when incorporating three points into the resection instead of two. With Smith’s paper, an important relationship outlined is the accuracy of the forward bearing with the amount of prisms used in a resection. This dissertation will fill the gap of their papers and examine the propagation in errors over a larger network. By examining a larger network of wall stations the errors can be magnified and this will portray the importance of performing a check survey. No literature has been found that examines the check survey method only papers which examine impacts of the wall station resection.
The geometry of the existing wall station control relative to the station setup position of the total station is very important when carrying wall station control. The total station must be set up inside existing wall stations using two faced observations to coordinate the instrument position. The aim of this method is to generate a positional solution that is effectively “braced” within the existing control, hence balancing the errors associated with the total station measurements.
27
2.4 R
ECENT
C
HANGES
IN
U
NDERGROUND
T
RAVERSING
T
ECHNIQUES IN
W
ESTERN
A
USTRALIA
–
A.J
AROSZ
&
L.S
HEPHERD
This paper covers a variety of aspects regarded to underground traversing and creating a control network which is pertinent to the data collection and analysis that will be conducted in the dissertation. Importantly, Jarosz and Shepherd’s research is concerned with comparable themes as this research project therefore it should contribute a lot of valuable material.
The first section of this study refers to the two different types of underground traversing. The first method is classical surveying which means points are located in the roof and wall station traversing with points in the drive walls. This dissertation is more interested in the analysis of the wall station traversing method. The paragraph describing wall station traversing briefly describes the purpose and general methodology which is better described in Smith’s literature.
This paper has common similarities and relationships with Smith’s research with both papers analysing the changes in axes of the error ellipse of the forward azimuth. The paper has a baseline which is 0-1 and determines the points of 2, 3, 4 and 5. The instrument locations is calculated by observations to adjacent targets with known positions. Then, the subsequent wall station is calculated by distance and angle observations. This method is then repetitive to calculate the wall station’s position. The first analysis was achieved for a configuration where the instrument was positioned 3 metres from the second wall station which was normal to the direction of the traverse. As expected, the parameters of the error ellipses semi-minor, semi-major and azimuth of major axis increased at the consecutive station which is a similar result proven by Smith.
28
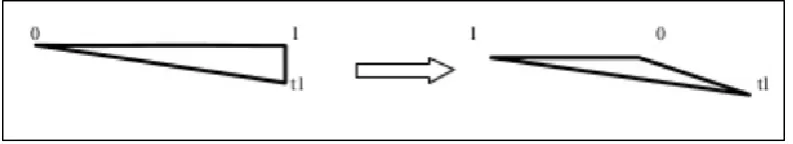
Figure 2-5 Replacement of Right Angled Triangles with Narrow Triangles (Shepherd & Jarosz, 2006)
Jarosz and Shepherd’s review of wall stations method provides a good argument about the resected triangle shape. Proving that the parameters of the error ellipse increases when the triangle is narrowed. Meaning the geometry of the points in the survey has a paramount influence on the transferred direction and position accuracy. “Wall station traversing where acute geometry of resection angles cannot be maintained requires forced centring and additional observations between temporary instrument stations” (Shepherd & Jarosz, 2006).
Again, Jaroz and Shepherd’s paper is concerned about the geometry of resection in wall station surveying. Even though the importance of the geometrical relationship between the wall stations and instrument is essential to maintain accuracy, this dissertation focuses on how errors in wall stations can propagate through wall station traversing. By analysing the check survey method it will show the importance of verifying the quality of the wall stations. When poor geometry and the number of points used in a resection are not adequate the errors in forwarding control and setting out information for the mine will not be correct. By resecting off wall stations that have not been verified mine surveyors can be magnifying errors throughout the mine. The greater the wall stations are from check survey control the greater the error will be propagated and can potentially cause fatal errors in production and development staking out.
2.5 L
EAST
S
QUARES
A
DJUSTMENT
29 quantities consistent within themselves. Thus the same results, whether they are co-ordinates, heights, etc. are obtained no matter which adjusted observations are used. Least squares adjustment is a processing methodology for the adjustment of surveys and an analysis. “This is particularly relevant to wall station control since poor geometry and other factors mean relatively small (less than 5mm) errors to control stations may cause major forward azimuth errors” (Grocock, 2014). The method incorporates all observations which increases the redundancy of the network and develops the quality creating positional precision in both horizontal and vertical axes which is in relation to the baseline. Smith has elaborated on the meanings of positional and local uncertainties and shown the formulas for calculating positional and local uncertainty values. “Positional Uncertainty can be calculated using the Leenhouts formula and the semi major and semi minor axes of error ellipses which are given as a result of a least squares adjustment program based on the network input data provided.” (Roberts, Ozdemir, & McElroy, 2009). The formula below is Leenhouts formula to calculate uncertainty circle’s radius with a 95% confidence level using error ellipses:
C = b/a K = q
0 + q1C + q2C 2
+ q
3C 3
Radius = aK
Where:
a = semi-major axis of the standard error ellipse b = semi-minor axis of the standard error ellipse. q
0 = 1.960790
q
1 = 0.004071
q
2 = 0.114276
q
3 = 0.371625
(Roberts, Ozdemir, & McElroy, 2009)
30 Harvey’s paper has elaborated on the methods to calculate a least squares solution for a survey network. Least squares adjusts random errors, however, doesn’t correct systematic errors. Literature by Harvey (1993) and Roberts, Ozdemir, & McElroy (2009) may both thoroughly investigate least squares however do not consider potential systematic errors that can occur. In this dissertation the gaps from previous literature will be filled by emphasising the importance to calibrate instruments and check that prism constants are correct to ensure a reliable adjustment.
The instrument used will be in current calibration (less than 12 months since the previous EDM calibration) and will be in a clean state, free of dirt and grime. The prisms used will be specifically only used for control surveying and not used for normal operating surveying to ensure the prism constants are correct. The total station’s atmospheric corrections will be set to zero and a Kestrel that has been calibrated against the Beaureau of Meteorologys instruments for temperature and pressure information will be used to obtain accurate pressure and temperature readings.
2.6 C
ONCLUSION
This chapter has described and substantiated the theories put forward by previous literature. The literature found in regards to wall station surveying focused on the resection method. Investigating the effect of the number of wall stations in the resection and the geometry of the resection. The literature concludes that major forward bearing azimuth issues can occur when poor resections are used as the norm. A theoretically analysis will be completed in this dissertation to depict the importance of redundancy in resections.
The papers do not analyse the effects of error propagation over a larger extent. As no literature was sourced that related to underground check surveys this research project will assess the check survey method and render the importance of the method in underground surveying.
31
3.
C
HAPTER
3:
M
ETHODOLOGY
3.1
I
NTRODUCTION
This chapter of the research project will outline and identify the planning and processes undertaken for methodology of the research project. By doing so, this chapter will provide a better comprehension of how the results were created and qualify an analysis to be directed on the results achieved in the underground control survey.
3.2 S
TUDY
A
REA
32
Figure 3-1 Mount Isa, Queensland Map (Mount Isa Mines Rotary Rodeo, 2016)
At Mount Isa Copper Operations (MICO) there are two underground mines which are called X41 and Enterprise (ENT). The survey department at Mount Isa performs surveys in both X41 and Enterprise to meet the demands of production and development of the mine. In order for the surveying department to remain confident in their everyday work, checks need to be implemented which is why check surveys are completed.
3.3 I
MPORTANCE
33 the digital Leica file onto Surpac where a string file is created and a report written that details what control was used, any forward stations that were surveyed in and any points that were recorded during the survey. This system generally works well however relies on wall stations to be advanced correctly. With wall stations being used daily in resections it is expected that these wall stations are in the correct position. To verify the position of wall stations the underground check survey method will be completed.
3.4
W
ALL
S
TATION
S
URVEYING
Wall stations need to be surveyed using a technique that ensures the best possible coordinated solution for the station setup is determined, and errors associated with the survey traverse are minimised as the survey is carried. As headings can extend a significant distance from the origin of the survey, any small deviation in the bearing or weakness in the calculated station position that is used to carry control will have a significant influence on the accuracy of the location of the mining at the end of the heading.
Figure 3-2 Wall Station Prism placed into Sleeve
34 wall stations is common and it is essential that this is checked prior to carrying control further into the development.
The following techniques will be followed to allow the wall station control to remain reliable and accurate whilst mining headings.
- All wall stations are to be sleeved and grouted. A standard wall station sleeve is approximately 0.080m in length and has an internal tube diameter of 0.008m.
- All survey control stations must be carried “outwards” of the existing control. This means to carry control outwards from its origin rather than from “inwards” overlapping the area previously traversed when the control was extended. Error propagation is statistically more significant when control is traversed back on itself before being extended outwards.
- The geometry of the existing wall station control relative to the station setup position of the total station is very important when carrying wall station control. The total station must be set up inside a minimum of three existing wall stations using two faced observations to coordinate the instrument position. The aim of this method is to generate a positional solution that is effectively “braced” within the existing control, hence balancing the errors associated with the total station measurements. If the quality of the free station solution is not deemed acceptable, more wall stations need to be surveyed and analysis of the network solution investigated.
With a quality network solution established, forward wall stations can be carried with confidence. Forward stations are surveyed in two faces and should be staggered along both sides of the drive (subject to ground/wall conditions). Some examples of where wall stations should not be installed include:
- Within 5m of the corner of pillars/drive turnouts (where ground stress is likely to be great)
- On known slabby ground
35
3.5 F
IXED
S
TATIONS
As a general operating procedure, high order “check” surveys will follow up advancing capital development as a means to verify the quality of existing wall stations and provide accurate control to further advance into the mine. All surveyors will be responsible for the check surveys in their areas and these should be organised during a day when mining operations using large machinery are not being conducted in the survey area. As a rule, the working control should not advance more than ten “line of sight” setups from the existing high order survey network. The method of conducting check surveys differs from that of working control as all of the information recorded and documented, from the raw GSI file data to the final traverse report need to explain how the instrument was set up and the traverse was conducted during the survey.
For the check survey, the network is constrained by twelve fixed stations. A fixed station must be a wall station that has been verified by the check survey method previously. The (X, Y, Z) coordinates of the fixed wall station are known and are noted as check survey points in the mine’s database. If the check survey was fixing on wall stations that have not been checked it would defeat the purpose of the check survey method.
3.6 C
HECK
S
URVEY
M
ETHOD
36
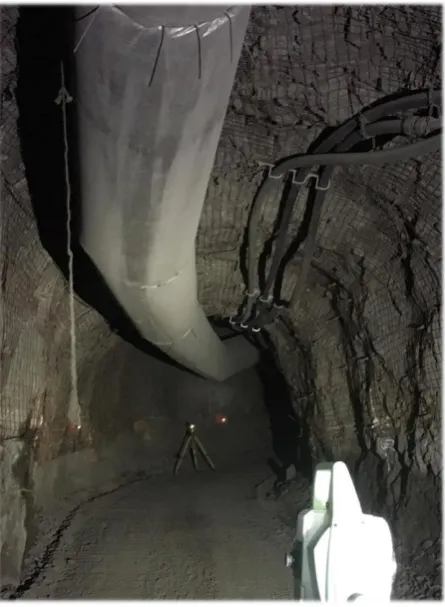
Figure 3-3 Check Survey traversing up the Incline
The ‘Sets of Angles’ program on the Leica total station was used to conduct the survey traverse. The first instrument setup of a new section of traverse was a free station two setups back from the end of the existing network. The first set up was coordinated to verify that the existing control was correct and that the wall stations have not moved since they were last surveyed. The atmospheric corrections applied to EDM measurements must be set to 0ppm for the survey (corrections are applied during post processing). Six sets of observations were taken to survey all visible survey stations, and any existing setups that are occupied during the survey. The connecting observations between the instrument station setups are critically important to maintaining the high order of the survey.
Check survey station naming conventions– the naming conventions for stations surveyed is to be as follows:
37 identify each free station setup as it is merged into the master check survey document and makes sorting of wall / back stations from free set up stations easier.
3.7 C
HECK
S
URVEY
P
ROCESSING
Post processing in CompNet – After setting up CompNet with the configuration with the correct path, the Instrument ID number, a new project is created for the processing of the check survey observations.
- Import the GSI file data, using individual observations and entering the instrument PPM and Constant corrections as calculated in the EDM calibration. Investigate and fix any errors that CompNet reports and then continue with adjustment.
- CompNet will automatically process the project if sufficient fixed stations are referenced to allow a solution to be calculated.
- All duplicate point numbers must be addressed.
- Re-import the GSI file and rerun the adjustment. Check the F-Test and Variance Number and whether the project passes or fails adjustment.
- When the project is optimized as best as can be determined, move the weighted coordinates to the fixed file.
3.8 E
QUIPMENT
C
HECKS
Prior to commencing the field work at Mount Isa underground mine, survey equipment should be checked to ensure that it is functioning as it is designed to, and that it is in good operating condition. This may contain but not be restricted to the following equipment.
3.8.1 T
OTAL
S
TATION
38 be conducted prior to the check survey. Section 5 of the Leica MS50 User Manual explains the method used to complete the “Check and Adjust” on the Leica Instrument. Prior to conducting the calibration, the log file should be switched on and a minimum of three sets of observations is carried out to identify the c, a, l, t, i and ATR Collimation errors. If any of the numbers have changed by greater than 15 seconds from the instruments last check and adjust, this should be brought to the attention.
An EDM Calibration should be completed within a year of completing the check survey to ensure the accuracy of the instrument. In Appendix B, a reference to the latest EDM Calibration is made.
The total station should be in a clean state, free of dirt and grime, be in calibration and be set to run atmospheric corrections of zero parts per million. A Leica user manual states: “Distance measurement is influenced directly by the atmospheric conditions of the air in which the measurements are taken. In order to take these influences into consideration distance measurements are corrected using atmospheric correction parameters” (Leica Heerbrugg, 2009).
The atmospheric corrections applied to EDM measurements must be set to 0ppm for the survey (corrections are applied during post processing). The instrument was checked to be sure the correct adjustments for the work site were correct especially EDM calibration, Scale Factor, PPM settings.
3.8.2
W
ALL
S
TATION
P
RISMS
The Wall Stations used underground are a Leica Circular Prism with a specially designed spigot attached. Before the survey, these should be checked to ensure that the prism will rotate firmly but freely about the spigot and prism holder.
39 used on a number of occasions to clean the interior of the metal sleeve so the spigot is hard up against the wall.
When working in an underground mine there is variation in temperatures and pressures compared to above ground surveys. Due to the impact the instrument settings can have on observations raw measurements were taken underground and all corrections were changed in the processing stage. By recording pressure and temperature readings at every set up errors were eliminated.
3.8.3 T
RIPOD
Before use, tripods were checked to ensure that all hinges, joints and locking mechanisms were functioning as designed. The tripod was checked for stability once set up by applying a downwards pressure to the tribrach plate.
3.8.4 KESTREL
Kestrel that has been calibrated against the Bureau of Meteorology’s instruments for temperature and pressure information. Calibration must be completed within a year of check survey. In the below figure it portrays the calibrations differences. In Appendix C, it shows the latest calibration of the Kestrel.
3.8.4.1
B
AROMETRICP
RESSUREAt MICO the air pressure is controlled by ventilation fans and managed by barricades and doors. Variations in the air pressure are not considered in daily survey procedures. With the check survey pressure readings were recorded at every station set up to ensure accuracy and quality. It is important to let the Kestrel climatise to the underground environment meaning readings were recorded half way through the sets of angles. The Kestrel used was calibrated within a year of the survey to verify the accuracy of readings.
3.8.4.2
T
EMPERATURE40 each station set up. An average temperature was determined for each different set up to eliminate atmospheric errors.
3.9
S
COPE
&
L
IMITATIONS
Data will be collected at MICO underground mine to verify the control stations in X41 around 15 level. The site map of the information needed for the check survey is attached as Appendix D.
Field work will be completed using Leica “Sets of Angles” on a Leica MS50 1” total station. The underground traverse will be in compliance with the requirements of ICSM SP1 v1.7 (Class D).
A 3D linear misclose assessment will be carried out which will examine consideration of any rotational issues. This adjustment will be completed with CompNet v2.9 which has the advantage of comparing parameters against the requirements of Class D of ICSM SP1. A Kestrel 4000 Pocket Weather Tracker was used to collect atmospheric temperatures and pressures at each station set up to accurately edit the raw data collected.
3.10
C
ONCLUSION
In conclusion, the above sections outline in detail the methodology for the check survey within this project. In a larger mine, it is important to plan and understand the processes of the check survey prior to the field work. Problems are encountered that alter original plans while underground. Problems encountered must be overcome or minimise to optimise the check survey procedure. The methodology was followed closely in the field work to ensure eliminate any potential errors. By not following the correct procedures in the field it can lead to major problems in the processing phase. In an underground mine, mine surveyors should remain cautious due to the factors of heat stress that can potentially influence the decision making process of the surveyor.
41
4.
C
HAPTER
4
–
R
ESULTS
4.1
I
NTRODUCTION
This chapter discusses the results produced from the least squares adjustment. Least squares is a common processing procedure for analysis and adjustment of survey data. The check survey has combined fixed stations at the start of the survey which aim to brace the survey network.
The software incorporated the sets of angles traversing data to generate least squares solutions of the rigorous network adjustment. The adjustment software CompNet was used to create output files which provide statistical information of the check survey. For the least squares adjustment to pass the adjustment it is evaluated statistically to assess the adjustments quality.
4.2 S
UMMARY OF
S
URVEY
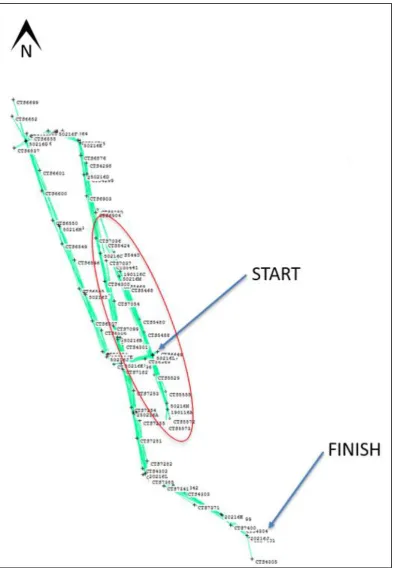
The field work for the check survey was completed over three full days to collect the desired data for adjustment. The check survey traverse consisted of:
- 62 wall stations
- 12 fixed stations (outlined in red at the start of the survey)
- 39 set ups (to the end and back to the start)
- 900 metres to the end and 900 metres back to start.
42
Figure 4-1 Survey Network in CompNet
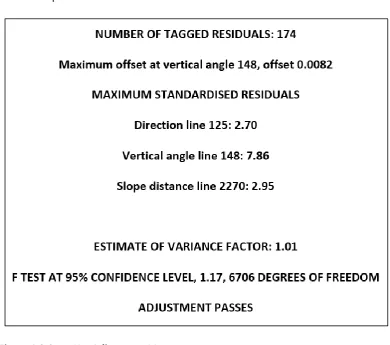
43 squares adjustment the solution of the survey stations need to be evaluated and assessed. CompNet software has the ability to summarise the adjustment and provide the user with the most important information.
Figure 4-2 CompNet Adjustment Measures
In comparison with the new checked survey wall stations and the original wall stations there was little deviation. The difference in the X, Y, Z coordinates were observed and all axis had small difference. The greatest difference was in the Z axis which was a
difference of 30mm. The area of the mine that was checked had limited mining activity over the years which is assumed to have limited movement in the wall stations. Mount Isa mine surveyor’s ensure to incorporate an adequate positional fix for their resection when forwarding new control which will be discussed further.
4.3 R
ELIABILITY OF
M
EASUREMENTS
44 - Precision
- Accuracy - Uncertainty
4.3.1 PRECISION
Precision is the degree of closeness and consistency of a set of observations in surveying terms. When analysing the observations the variance and standard deviation expresses the precision if the statistical information is reliable and unbiased.
[image:43.595.99.291.352.618.2]When the variance of the observations is small it means the measurements are clustered and confined to the mean which produces a tall and thin normal curve. However, when the variance of the observations is large it means the set of observations has low precision and are spread about the mean which produces a flat and low normal curve.
Figure 4-3 High Precision & Low Accuracy
45 the figure above, the observations represent high precision and low accuracy. High precision makes a narrow normal distribution curve as seen in the above figure.
4.3.2 A
CCURACY
[image:44.595.100.312.251.522.2]Accuracy is the amount of closeness of a measurement to the true value. The true value is theoretically never known. The accuracy not only contains the influence of random errors, but also any bias due to systematic errors which have not been corrected.
Figure 4-4 High Accuracy & Low Precision
In the figure above, it portrays high accuracy and low precision which gives a flattened normal distribution curve.
4.3.3 UNCERTAINTY
46 of how wrong a value may be and is used in this Standard to quantify the level of survey quality.” The ICSM Standards categorise three types of uncertainty which include:
- Positional Uncertainty (PU) - Relative Uncertainty (RU) - Survey Uncertainty (SU)
4.3.3.1
P
OSITIONAL UNCERTAINTY(PU)
Positional uncertainty is defined by ICSM SP1 v2.1 as “the uncertainty of the horizontal and/or vertical coordinates of a survey control mark with respect to datum.”
4.3.3.2
R
ELATIVEU
NCERTAINTY(RU)
Relative uncertainty is defined by ICSM SP1 v2.1 as “the uncertainty between the horizontal and/or vertical coordinates of any two survey control marks. For this dissertation relative uncertainty of ellipses will be assessed at 95% confidence interval.
4.3.3.3
S
URVEYU
NCERTAINTY(SU)
Survey uncertainty is “the uncertainty of the horizontal and/or vertical coordinates of a survey control mark independent of datum. That is, the uncertainty of a coordinate relative to the survey in which it was observed, without the contribution of the uncertainty in the underlying datum realisation” (Inter-governmental Committee on Surveying and Mapping (SP1) v2.1, 2014).
4.4 T
RAVERSING
Traversing is a surveying procedure performed to establish a control network. There is two main types of surveying, an open traverse and a closed traverse.
4.4.1 O
PEN
T
RAVERSE
47 other known points are said to be “open,” meaning that there is no automatic check on the validity of the work.”(Bernard, Solomon & Britton, 1992).
An open traverse geometric close in the survey and there needs to be verification on the field work. Open traverses are used on a daily basis at MICO and the check survey process is a method of verifying the traverses.
4.4.2 C
LOSED
T
RAVERSE
A closed traverse is a traverse that is commenced on one point and finishes on one point which forms a polygon. This method of traversing is preferred as it gives a means of check because the start at end point of the traverse is fixed. For the purpose of this research project the survey network was closed by traversing to the end of drive and then traversing all the way back to the starting point. The check survey traverse is a closed traverse but it is not closing back onto itself it is closing back onto a different fixed control station. Errors in traversing can be somewhat balanced by methods of adjustment such as the Least Squares method.
4.5 L
EAST
S
QUARES
A
DJUSTMENT
(C
OMP
N
ET
)
All types of adjustments are based on the assumption that all systematic and gross errors in the survey have been removed. Adjustments are designed to only adjust random errors which is errors that persist after the correct procedure, technique and equipment have been implemented.
The Least Squares method produces the best adjustment by altering the observations by the least possible quantity. All observations will be adjusted simultaneously when using the Least Squares. Essentially the aim of the adjustment is to minimise the sum of the squares of the residuals.
4.5.1
I
TERATION
48 Probable Values (MPV) resultant from the preceding calculation. Commonly when the input data has no gross errors the solution will converge in a few iterations.
4.5.2 A
DJUSTMENT
R
EDUNDANCIES
The adjustment redundancies is also known as the degrees of freedom (𝑓) of the survey network. The entire number of observations in the survey network define the amount of equations that need to be solved by the least squares adjustment. This means that the data of directions, vertical angles and slope distances all alter the equations for the adjustment.
In a model there is (𝑚) unknown variables which means there will have to be (𝑚) independent observations to adequately determine these parameters. If ( 𝑟𝑖) observations were made to estimate (𝑚) variables and (𝑛 > 𝑚) then the redundancies or degrees of freedom (𝑓) is (𝑛 − 𝑚). The redundancy of the network is equal to the amount of observations subtract the amount of unknowns. The process of the least squares adjustment allows the estimation of the (𝑚) variables when there is (𝑓) redundant observations obtainable. Repeated observations which are measured to estimate an unknown variable the additional observations are redundant. By increasing the redundancy in the survey network the confidence of the adjustment is increased.
4.5.3
M
OST
P
ROBABLE
V
ALUE
The Most Probable Value (MPV) is the value with the highest occurrence determined from a set of observations. Theoretically, the true value cannot be determined therefore the most probable value is used. The MPV can be defined as:
1 n
i i
x
x
n
49
4.5.4 R
ESIDUALS
Simply, the residual is the difference between what was observed and the value that best fits into the adjustment. The residual is determined from the Most Probable Value (MPV) where:
i i
r
x
x
It is important to understand that in theory there is a difference between error and residual. An error can be represented as:
i
x
ix
4.5.5
S
TANDARD
D
EVIATIONS
The standard deviation (
) of a population is a measure of closeness of individual measurements. The sample standard deviation of a sample is defined by (𝑠) and is the square root of the sample variance.The standard deviation in theory is represented with true errors: 2
(xi x)
n
When x in theory is the ‘true value’ and
x
i
x
represents the ‘true error’.The sample variance is defined as: 2
2
(
)
1
ix x
s
n
Where the standard deviation used for a set of sample is:
2
s
s
2 ) 1 i x x n
50 2
(xi x)
n
Wherex
i
x
is the error.2 ( ) 1 i x x s n
Where ix x
is the residual.Essentially, a smaller standard deviation will portrays a more accurate position whereas a larger standard deviation will indicate a less accurate position.
The research project considers a derived Root Mean Square (RMS) deviation which is a weighted deviation that takes into account the estimated predicted errors in the survey. The predicted errors entered into CompNet were obtained from instrument specifications and calibrations.
4.5.6 S
TANDARDISED
R
ESIDUALS
The residuals are standardised so that it is clear to detect errors in the survey network. The standardised residual is determined by dividing the residual by its standard error value (the input standard deviation for the appropriate observation). It portrays how much the point has differed from the mean value. The standardised residuals are a superior way to identify poor observations, for this research project 3 σ was the limitation used.
Ideally, the standardised residual should be close to one and in this research project will examine standardised residuals (>3 σ) for mistakes. This is based on the assumption that if an observation is greater than
3
from the mean it may be an error. The 3 σ rule of thumb is that it is a 99.7% probability of fallen in the range of 3 σ.4.6 I
NTEGRITY TESTS
51
4.6.1 C
HI
-
SQUARE
T
EST
The Chi-square test is intended to accept or reject the hypothesis that the predicted errors have been accurately estimated. A probability percentage is calculated which is the level of significance for the adjusted network and if this is less than 95%, the reference factor will not pass the test.
The Chi-square test is made by comparing a
2value calculated from the observations, with that obtained from tables for the desired confidence level.The statistical value
2 (chi-square) is defined as:2 2 2
r
Where, 2r
= the sum of the squares of the residuals resultant from an adjustment,2
= the variance, or square of the standard deviation of the population.
Now as, 2 1 r s n
Rearranged to,
r
2
(
n
1)
s
2Where,
s is the standard deviation of the observations and n is the number of observations.
Then we can say, (n 1) f which the degree of freedom is
52 A two-sided Chi-Square test at 5% significance level is performed on the adjustment to determine if the residuals are potentially due to random errors.
The chi square range is calculated to test if the variance factor
s
02 lies within the allowable range.2 2
2 0
2 2
, 1 ,
2 f 2 f
fs fs s
Where,
is the significance level.If
s
02is out of the range the test will fail.This research project has incorporated a significance level of 5% meaning that the two sided Chi-Squared test will determine if a particular 2
value is within the 95% area of all 2
values. If it does the test will pass if does not and falls into the remaining lower and upper 2.5% areas then the test will fail. When this test fails it is assumed that it is caused by non-random errors. This statistic test in essence considers the quality of fit that the adjustment has made. It is important to realise that the Chi-Squared test is not an absolute test of the accuracy of the observations in the survey.
4.6.2
F
ISHER
T
EST
The Fisher test for surveying applications is defined as:
2 0.05, , 2 f
s
F
Where, (𝑓) represents the number of redundancies of observations which the sample variance (𝑠2) is calculated. The infinity symbol represents the degrees of freedom of the normal distribution population with variance (2
53
4.7 C
ONCLUSION
The traverse and adjustment of the survey network were discussed in detail. Least squares is a common processing procedure for analysis and adjustment of survey data. The results outputted by CompNet have been explained and basic statistics were described to give meaning to the results attained.
54
5.
C
HAPTER
5
–
D
ISCUSSION
5.1
I
NTRODUCTION
In this chapter, the results obtained in the previous chapter will be analytically discussed. The theory of errors, effects of external factors in relation to underground mining, global precisions, instrument settings, and the results will be outlined and discussed in detail. Statistical behaviour will be analysed to thoroughly understand the check survey.
5.2 T
HEORY OF
E
RRORS
Reliable observations is a significant importance of the profession of surveying. There is no such thing as an observation with no error all observations will have errors.
Errors in observations can inherent from many different causes and should be reduced or overcome. There are generally three types of errors that surveyors are concerned with:
- Systematic - Random
- Gross/ Mistakes
Least squares adjustment does not eliminate bad observations which means quality observations are important.
5.2.1 S
YSTEMATIC
E
RRORS
A systematic error is an observed value follows some degree of physical law which can be portrayed in a mathematical formula. Systematic errors should be considered and removed as the adjustment require the complete absence of these errors. When these errors have a substantial magnitude, it will distort the adjustment producing incorrect and biased adjusted coordinates.
55
o Temperature, refraction, slope, sag, tension - Instrumental errors
o Adjustments comparative to the total station
o Systematic positioning of an automatic compensator in an automatic level
- Periodic errors
o Diurnal Refraction
o Electronic Distance Measurement (EDM) cyclic errors
Systematic errors are more commonly caused by field procedures and the instrument used. It is important to realise the least squares adjustment will adjust random errors but will not adjust systematic errors.
To reduce the systematic errors observation procedures were consistently followed. Calibrations of the Leica MS 50 (1” instrument) and Kestrel 4000 Pocket Weather Tracker were completed within a year of the survey to ensure reliability of observations. By recording raw observations and applying atmospheric corrections of EDM such as temperatures and pressures at each station set up helped to eliminate systematic errors. Wall stations used for the check survey are only used for check surveys to ensure that prism constant used are reliable.
Statistical testing of the observations in the survey can aid in representing the presence of systematic errors in the survey. The adjustment passed statistical based tests meaning the survey achieved its desired accuracy.
5.2.2 R
ANDOM
E
RRORS
56
5.2.3 G
ROSS
E
RRORS
Gross errors is any blunders caused from the field techniques in the survey. The survey has sufficient checks throughout and no gross errors should be present.
5.3 E
FFECTS OF
E
XTERNAL
F
ACTORS
In an underground mine surveyors are confronted with extreme environmental conditions of heat, noise, poor visibility and risk. It is important that the check survey be performed with speed and accuracy, meaning the surveyor is expected to plan ahead and foresee problems before they transpire. “Underground measurements always take place under tough conditions,…, permanent time pressure, unfavourable conditions (visibility, light, noise, temperature, humidity, ventilation, traffic...and safety-related constraints…” (Haag & Stengele, 1997).
5.3.1 I
LLUMINATION
When working in an underground mine artificial lighting is incorporated to be able to view and observe survey wall stations. “Artificial light is necessary in order to illuminate the point of sight and the cross hairs. Such light is generally very poor, and this fact greatly hampers work with the instrument.” (Young, 2012). Problems with lack of natural light can effect the accuracy of sighting and recognizing wall stations. Problems with illumionation and wall station sighting can lead to gross errors through the survey.
5.3.2
R
EFRACTION
Refraction of light rays out of the vertical plane is due to presence of layers and currents of air at different temperatures and pressures along the line of sight. “Lateral refraction is the biggest source of systematic error that can be encountered in underground surveys. Every effort should be made to avoid its effect. …” (Fowler, 2006).
57 Refraction is not the same as shimmer in observations. When there is errors caused by shimmering the error is commonly cancelled out by increasing observations. When six sets of angles is more than sufficient to eliminate the error of shimmer.
5.3.3 GROUND CONDITIONS
Poor conditions of the floor of the drive can lead to problems with the setup of the total stations and fore and back sights. Tripods were set up correctly following standard procedures to minimise the potential movement of the tripod. Whe