Faculty of Health, Engineering and Sciences
Improving Queensland Speed Zoning
Practices
A dissertation submitted by
Alexander Williams
in fulfilment of the requirements of
ENG4111 and ENG4112 Research Project
towards the degree of
Bachelor of Engineering (Civil)
i Queensland speed limits are assessed against the guidelines outlined within Part 4 of the Manual of Uniform Traffic Control Devices (MUTCD Part 4), which is maintained by the Queensland Department of Transport and Main Roads. This project was undertaken in order to develop recommendations for improvements in future revisions of MUTCD Part 4 that meet the needs of local government and industry users.
The current framework outlined within MUTCD Part 4 can be difficult for practitioners to follow and often adds unnecessary cost and complexity to speed zoning processes. Results between different users may be inconsistent as a result. It is also structured towards application on State roads, which means that it does not consistently align with local government needs regarding transport planning and traffic operations. It is believed that amendments to particular elements of the guidelines will increase practicality in application and ensure consistent speed zoning in Queensland.
Local and international guidelines for speed zoning were reviewed to understand the processes undertaken by other road authorities. The possibilities of using speed measuring technology and risk assessment tools to analyse speed limits were also considered.
Interviews were conducted to identify stakeholder issues with MUTCD Part 4, and to assist in making informed recommendations for future revisions. Additionally, case studies were conducted using different speed zoning processes on a sample of roads to identify the strengths and weaknesses of processes used by other state and international road authorities. These results were compared to those obtained using MUTCD Part 4. Project tasks highlighted numerous aspects of MUTCD Part 4 that could be improved and provided a basis for recommendations to be considered in future revisions of the
guidelines. Suggested recommendations include amendments to road function classification, criteria-based speed limits for all speed limits, flowchart mapping of processes for clarity, inclusion of design guidance to effect speed reductions and updates to the online assessment tool, QLIMITS.
If adopted by the Department of Transport and Main Roads, future amendments to MUTCD Part 4 may result in more consistency in speed zoning practise and provide a document that will be practical for transport planning purposes. The suggested
recommendations may also contribute to improving community understanding and acceptance of Speed Zoning procedures.
ii
Faculty of Health, Engineering and Sciences
ENG4111 & ENG4112 Research Project
Limitations of Use
The Council of the University of Southern Queensland, its Faculty of
Health, Engineering and Sciences, and the staff of the University of
Southern Queensland, do not accept any responsibility for the truth,
accuracy or completeness of material contained within or associated
with this dissertation.
Persons using all or any part of this material do so at their own risk,
and not at the risk of the Council of the University of Southern
Queensland, its Faculty of Health, Engineering and Sciences or the
staff of the University of Southern Queensland.
iii
Certification
I certify that the ideas, designs and experimental work, results,
analyses and conclusions set out in this dissertation are entirely my
own effort, except where otherwise indicated and acknowledged.
I further certify that the work is original and has not been previously
submitted for assessment in any other course or institution, except
where specifically stated.
Alexander Williams
iv I would like to thank Ron Ayers and Peter Bilton who have both acted as supervisors and have been immensely helpful with provision of guidance throughout the course of my project.
v
Abstract...i
Acknowledgements ... iv
1.0 Introduction ...1
1.1 Project Aim and Justificat ion ...1
1.2 Project Methodology ...3
1.2.1 Stage 1 – Literature Revie w ...3
1.2.2 Stage 2 – Sta keholder Interv iews and Crit ical Review ...4
1.2.3 Stage 3 – Case Studies...4
1.2.4 Stage 4 – Develop ment of Recommendations...5
1.3 Project Appreciation ...5
1.4 Key Literature and Definit ions ...5
1.4.1 Transport Operations (Road Use Management) Act 1995 ...5
1.4.2 Transport Operations (Road Use Management – Road Ru les) Regulation 2009 ...6
1.4.3 The Manual of Un iform Tra ffic Control Devices ...6
1.4.4 Australian Standard 1742.4-2008 ...6
1.4.5 Austroads Guide to Road Safety Pa rt 3: Speed Limits and Speed Management ...7
1.4.6 Austroads Guide to Traffic Manage ment Part 5: Road Management ...7
1.4.7 Engineering Judgement ...7
1.4.8 Speed Limit ...7
1.4.9 Speed Zone ...7
1.4.10 Speed Environment ...7
1.4.11 General Speed Limits ...8
1.4.12 Prevailing Speed ...8
1.4.13 Upper Limit of 15 km/h pace ...8
1.4.14 85th percentile speed...8
1.4.15 Road Function ...8
2.0 Literature Revie w...10
2.1 Purpose...10
2.1.1 Safe System Approach...11
2.1.2 Speed and Crash Risk ...11
2.1.3 Behavioural Influences ...14
2.1.4 Speed Limit Effects on Society...16
2.2 Speed Measuring Methods ...16
2.2.1 Tube counts ...16
2.2.2 Bluetooth...17
vi
2.4 Intelligent Transport Systems ...20
2.4.1 Variable Speed Limits ...20
2.4.2 Self-driving technology ...22
2.5 The Manual of Un iform Tra ffic Control Devices Part 4 ...23
2.5.1 MUTCD Part 4 Overvie w ...23
2.5.2 Speed Management ...24
2.5.3 Speed Zoning and Speed Limit Rev iews ...25
2.6 Australian Standards and Guide lines ...31
2.6.1 Victoria ...31
2.6.2 New South Wales ...32
2.6.3 Western Australia ...33
2.7 International Guide lines ...33
2.7.1 United States of Ame rica (Ca lifornia ) ...33
2.7.2 Sweden ...34
2.7.3 United Kingdom ...34
2.7.4 New Zealand...35
2.8 Gu ideline Su mmary ...37
3.0 Assessment of MUTCD Part 4 ...42
3.1 Stakeholder Interv iews ...42
3.2 Identified Issues...42
3.2.1 Criteria Based Approach ...42
3.2.2 Road Function ...43
3.2.3 Data Co llect ion ...44
3.2.4 QLIM ITS Crash Rate Formu la ...44
3.2.5 Safety Focus ...44
3.2.6 Clarification of Engineering Judgement ...44
3.2.7 Design Guidance...45
3.2.8 Accessibility ...46
4.0 Identificat ion of Solut ions ...47
4.1 Options Overview ...47
4.2 Adoption of Other Gu idelines ...48
4.3 Amend ments to MUTCD Part 4 ...48
5.0 Case Studies ...49
5.1 Case Study Process Overview...49
5.2 Case Study Methodology...49
vii
5.2.4 Western Australia Process ...51
5.2.5 New Zealand Process...51
5.3 Site Descriptions ...52
5.3.1 Nerang Murwillu mbah Road ...52
5.3.2 Curru mb in Cree k-To me win Road ...55
5.3.3 Cunningham Highway ...61
5.3.4 Mount Lindesay Highway...65
5.3.5 Oxley Drive ...67
5.3.6 Reedy Creek Road ...69
5.4 Case Study Results...71
5.4.1 Nerang Murwillu mbah Road ...71
5.4.2 Curru mb in Cree k-To me win Road ...72
5.4.3 Cunningham Highway ...74
5.4.4 Mount Lindesay Highway...75
5.4.5 Oxley Road ...75
5.4.6 Reedy Creek Road ...76
5.4.7 Results Summa ry ...77
5.5 Case Study Observations ...79
5.6 Summary of Case Studies ...80
6.0 Reco mmendations ...81
6.1 Accessibility Tools ...81
6.2 Further Ut ilisation of Criteria Based Speed Limits ...83
6.3 Road Function...84
6.4 Planning and Design Guidance ...84
6.5 Clarification of Engineering Judgement ...85
6.6 Updates to QLIMITS...85
7.0 Conclusions ...86
7.1 Project Su mmary ...86
7.2 Future Work ...87
8.0 Refe rences ...89
Appendix A ...91
Appendix B ...93
Appendix C ...180
viii
Table 2.1 – WTP Values in Queensland (June 2013 values) ...14
Table 2.2 - Influencing Factors of Speed Choice ...14
Table 2.3 – Additional Driver Re lated Factors ...15
Table 2.4 – Exa mple SLNZ Roadway Rating Criteria (Geo metry) ...37
Table 2.5 – Gu ideline Observations: Application and Outcomes ...38
Table 2.6 – Gu ideline Co mparison ...41
Table 5.1 – Ne rang Murwillu mbah Road Site Inspection Observations...53
Table 5.2 – Curru mb in Creek-To me win Road Site Inspection Observations ...56
Table 5.3 – Cunningham Highway Site Inspection Observations...62
Table 5.4 – Mount Lindesay Highway Site Inspection Observations...65
Table 5.5 – Oxley Drive Site Inspection Observations ...68
Table 5.6 – Reedy Cree k Road Site Inspection Observations...70
Table 5.7 – Case Study Results ...77
Table 6.1 – Exa mple o f Criteria Based Speed Limits (Urban Areas)...83
Figures
Figure 1.1 – Road Type and Function: Mobility vs Access ...9Figure 2.1 – The Power Model...12
Figure 2.2 – The Re lationship between Speed and Casualties...12
Figure 2.3 – Pedestrian Fatality Risk as a Function of the Impact Speed of a Ca r ...13
Figure 2.4 – Exa mp le Tube Counter Layout...17
Figure 2.5 – Goog le Live Tra ffic Updates ...18
Figure 2.6 – AusRAP Rating Exa mple ...19
Figure 2.7 – Variable Speed Limit Signage in Fortitude Va lley ...21
Figure 2.8 – Crash Data Collection ...28
Figure 2.9 – M UTCD Part 4 Speed Limit Rev iew Process ...30
Figure 2.10 – Vic Roads process for Speed Limit Assessment in Rura l Areas ...31
Figure 2.11 – SLNZ Flow Chart for Urban Roads...36
Figure 5.1 – Nerang-Murwillu mbah Road Speed Limit Review Extents ...52
Figure 5.2 – Curru mbin Cree k-To me win Road Speed Limit Revie w Extents...55
Figure 5.3 – Cunningham Highway Speed Limit Rev iew Extents ...61
Figure 5.4 – Mount Lindesay Highway Speed Limit Rev iew Extents ...65
Figure 5.5 – Oxley Drive Speed Limit Review Extents ...67
Figure 5.6 – Reedy Creek Road Speed Limit Revie w Extents ...69
Figure 6.1 – Exa mp le guidance tool ...81
Figure 6.2 – Speed Limit Revie w Process Flowchart...82
Page 1
1.0
Introduction
1.1
Project Aim and Justification
Speed limits are typically recognised on Australian roads in the form of signs and pavement markings, or by default limits in areas without devices. They are established with the objective of facilitating movement of road users between locations at a speed that is safe and appropriate for the environment. According to the World Health Organisation, speed is a contributing factor to 30% of all road fatalities in high-income countries. It may be logical to assume that speed limits should be reduced in order to reduce speed related fatalities, however this is not always a practical solution and can affect road mobility and amenity.
It is important that the speed limit of a road be applied appropriately given the context of the road function and environment to encourage compliance and safety of all users. Appropriate speeds, both high and low, contribute to safer road conditions when the prevailing speed of a road is in alignment with the posted speed limit. The action of determining an appropriate speed for a road in Queensland is typically undertaken through a Speed Limit Review process.
This research project has reviewed the existing speed limit assessment process used in Queensland with the objective of improving it by developing of a set of recommendations for future amendments of speed zoning guidelines. A number of options to improve the existing process have been considered and recommendations were developed to address limitations of the current process that were identified in project tasks.
The Queensland Department of Transport and Main Roads’ Manual of Uniform Traffic Control Devices (MUTCD) provides guidance towards the use and assessment of traffic control devices on Queensland roads. While not a standard, Part 4 of the MUTCD
specifically covers the selection and assessment of speed controls. The guidance given for the practice of Speed Zoning and Speed Limit Reviews (MUTCD Part 4 eighth edition, June 2015) has been critically reviewed as part of this research project in terms of meeting industry needs.
Page 2 Anecdotally, industry users have identified concerns with application of the current framework, with a consensus that the current guidelines do not adequately cater for common road environments experienced at a local government and private industry level. It is not uncommon for speed limits recommended by MUTCD Part 4 processes to be considered inappropriate for the specific road environment when safety and site-specific issues are accounted for.
In addition, the current guidelines are primarily focused on determining the ‘correct’ speed limit for a given road environment, and do not assist users in identifying appropriate solutions to achieve a specific desired speed limit outcome. This is often sought in order to change the amenity and characteristics of a road (such as
accommodating higher volumes of pedestrians) and is at odds with the nationally adopted Road Safety Strategy that applies the Safe System Approach, encouraging reduction to speed limits. Users have also highlighted difficulties in explaining the current framework and the communication of decisions to non-technical users, illustrating the need for a transparent process.
The ultimate goal of the project is to provide recommendations for future refinement of MUTCD Part 4 and the development of tools and guidelines that are more practical to road authorities. It is believed that the establishment of a framework that allows for repeatability and reliability, and provides guidance towards achieving a specific desired speed environment can better align current practices with the nationally adopted Safe System Approach. This would contribute to the improvement of road safety in
Page 3
1.2
Project Methodology
The key deliverable of the project is recommendations that improve MUTCD Part 4 from the perspective of accessibility and application for practitioners, and that increase
consistency in speed zoning practise. The recommendations herein have been developed from a process involving research into best practice, discussion with industry users and case studies.
The project methodology was devised in order to achieve the following goals: 1. To understand the importance of good speed zoning practise and therefore
understand what elements should be improved in MUTCD Part 4.
2. To understand the processes of other regions and identify key differences when compared to MUTCD Part 4.
3. To understand industry views and desired changes for MUTCD Part 4.
4. To identify elements from the processes of other regions that address identified issues, and therefore may be suitable for adoption.
A number of tasks were undertaken in order to develop a set of recommendations for future revisions of MUTCD Part 4. This project was conducted over four stages.
1.2.1
Stage 1 – Literature Review
A review of Australian and international literature was undertaken in order to understand the importance of speed management and to identify processes that have potential to be incorporated into future revisions of MUTCD Part 4. The literature research focused on the following topics:
Speed and its correlation to crash risk. Factors that contribute to speed.
The objectives of road authorities in setting speed limits in a modern, safe systems approach context.
Societal attitudes towards posted speed limits and speeding. The processes used by road authorities for speed limit assessment.
Technology and software associated with speed measurement, management and analysis.
Page 4 methodologies that are considerably different to those used in Queensland was done during this stage of the project. The different methodologies identified were implemented in the case studies undertaken for the project.
Speed measurement technology and risk assessment tools were also researched to understand if they could be utilised to determine safe speed limits on assessed roads.
1.2.2
Stage 2 – Stakeholder Interviews and Critical Review
Stakeholders from the public and private sectors were engaged in an interview process to understand industry opinion regarding the current assessment methodology. Those involved were parties from State and local governments, and consultants engaged in traffic and transport planning. This cross section of interview candidates provided an insight into the issues encountered, across all levels, by individuals and organisations responsible for applying the guidelines.
Feedback from the interview process was considered in a detailed review of MUTCD Part 4. The review highlighted aspects of the current speed zoning methodology that can potentially be improved in future revisions of the guidelines.
1.2.3
Stage 3 – Case Studies
A case study process was undertaken and involved a comparison of the processes outlined in MUTCD Part 4 against the processes used by other state road authorities and international bodies. Six roads were chosen for the application of different speed zoning processes to determine if issues identified during Stage 2 could be addressed by a different methodology, or if those issues were still relevant.
The case study process involved speed data collection, site visits and conducting four speed limit reviews per road. The methodologies implemented in New South Wales, Western Australia and New Zealand were selected for comparison. These methods differ from each other in having a differing reliance on the use of engineering judgement and prescriptive processes.
Page 5
1.2.4
Stage 4 – Development of Recommendations
The final stage of this project involved the development of recommendations for future amendments to MUTCD Part 4. The recommendations were developed in consideration of the critical review and case study findings from Stages 2 and 3 of the project, and focus on improvements to the Manual that assist local government and private industry users.
1.3
Project Appreciation
There are benefits in revising the current framework outlined within MUTCD Part 4 to address industry concerns. Accommodation of local government needs can make the guidelines more practical in application to transport planning and placemaking processes, acting as a tool rather than a document that should be complied with. Addressing issues of document accessibility and removal of redundant actions will allow for repeatability and reliability in recommending speed limits. This will also help prevent ‘incorrect’ decisions that may result from misunderstanding of the guidelines.
The development of guidelines that consider the Safe System Approach and recommend appropriate posted speeds accordingly will likely result in reduction of road trauma at locations where changes are proposed as part of the Speed Limit Review process. It is anticipated that making improvements to the current speed zoning processes outlined in MUTCD Part 4 will improve road safety in Queensland at the planning and design phase, and in the review of existing infrastructure.
1.4
Key Literature and Definitions
It is important that the following terminology is clarified and understood as it is used to establish context, and outline and expand upon concepts within this dissertation.
1.4.1
Transport Operations (Road Use Management) Act 1995
The Transport Operations (Road Use Management) Act 1995 (TORUM) is Queensland State legislation that outlines laws relating to road use. The Act specifies responsibilities and requirements of various aspects of public road environments such as vehicles, road users, rules and enforcement, and road control. Standards and guidelines developed for Queensland roads must adhere to the TORUM Act.
Chapter 74 of the TORUM Act specifies that contravention of official traffic signs is an offence. This means that speed limit signage that erected by road authorities in
Page 6
1.4.2
Transport Operations (Road Use Management – Road Rules)
Regulation 2009
Queensland’s road rules are outlined within the Transport Operations (Road Use Management – Road Rules) Regulation 2009, also known as the TORUM Regulation. The TORUM Regulation explicitly states the rules that all road users must abide to, and penalties for infringements. In addition to specifying that road users are not permitted to exceed a posted speed limit, the Regulation addresses default speed limits, speed limits in special zones and vehicle restricted limits.
Any amendments to standards and guidelines developed for Queensland roads must not contradict the TORUM Regulation (and the TORUM Act).
1.4.3
The Manual of Uniform Traffic Control Devices
The Queensland MUTCD is a collection of guidelines that outline practices undertaken in Queensland regarding the design, standards and procedures in the establishment of road control devices. It is maintained by TMR and elements covered within the MUTCD include but are not limited to the following:
signs
pavement markings temporary traffic controls bicycle control
parking control.
The guidelines within the MUTCD are designed to ensure consistency of use of traffic control devices on Queensland roads, however from a regulatory sense all devices must be within the requirements of the TORUM. MUTCD Part 4: Speed Controls specifies the criteria and processes in establishing and assessing posted traffic speeds within
Queensland.
1.4.4
Australian Standard 1742.4-2008
All Australian states have prepared their speed limit assessment guidelines to supplement the Australian Standard, AS1742.4 (Manual of Uniform Traffic Control Devices; Part 4: Speed Controls). The standard covers the principles of elements such as speed
Page 7
1.4.5
Austroads Guide to Road Safety Part 3: Speed Limits and Speed
Management
Austroads Guide to Road Safety Part 3: Speed Limits and Speed Management (AGRS03) is supplemented by State speed limit assessment guidelines. It covers the topics of speed management, safe systems, default and signed speed limits.
AGRS03 provides guidance in selecting the speed limit of a road. It describes all
considerations that are typical to State guidelines and emphasises that the most important consideration is to determine the crash risk of the road.
1.4.6
Austroads Guide to Traffic Management Part 5: Road Management
Austroads Guide to Traffic Management Part 5: Road Management outlines the
philosophy behind speed limits and provides guidance on the application of speed limits. This includes the use of signs and physical devices to manage speed.
1.4.7
Engineering Judgement
Engineering judgement refers to the application of critical thinking to evaluate a particular element, scenario or result. This can involve the application of a ‘first principles’ approach or that practitioner’s experience to assess and establish a sound conclusion. In relation to speed zoning, engineering judgement can be applied to evaluate if a speed limit is suitable for a road environment.
1.4.8
Speed Limit
A speed limit is the maximum speed at which a vehicle is permitted to travel on a road section. Speed limits are legally enforceable and are typically set with posted signs and pavement markings. Part 3 of the TORUM Regulation (2009) outlines legal obligations and penalties regarding speed limits on Queensland Roads.
1.4.9
Speed Zone
A speed zone is a section of road for which a single speed limit has been set. As outlined in MUTCD Part 4, a speed zone can be categorised for special use. One of the most commonly recognised categories is a school zone (40 km/h speed limit).
1.4.10
Speed Environment
The speed environment considers characteristics of the road and traffic that can influence a motorist’s decision to raise or lower their travel speed. Elements such as road
Page 8
1.4.11
General Speed Limits
General speed limits (also known as default speed limits) are enforceable where there is an absence of definitive measures to specify speed limits, such as signs and pavement markings. General speed limits in Queensland are 50 km/h in urban areas and 100 km/h in rural areas (Clause 2.2.1 of MUTCD Part 4). These general speed limits are typical across Australia with the exception of Western Australia (110 km/h in rural areas) and the Northern Territory (60km/h in urban areas and 110 km/h in rural areas).
1.4.12
Prevailing Speed
The prevailing speed is the speed at which a majority of vehicles have been recorded travelling during a survey period. It may be defined by the upper limit of the 15 km/h pace or the 85th percentile speed, depending on the local road authority’s preference.
Given that it is the speed that most vehicles travel on a road, the prevailing speed is viewed as what road users perceive as an acceptable speed for the road (Clause 4.2.3 of MUTCD Part 4), even if it is higher or lower than the posted speed limit.
1.4.13
Upper Limit of 15 km/h pace
The upper limit of 15 km/h pace is a statistic that is reported in traffic speed surveys. Considering the full range of individual speeds at which vehicles are recorded to be travelling when passing the survey point, it is the 15 km/h range of the band where the most vehicles are recorded. Road authorities specify that the upper limit of 15 km/h pace can be used to describe the prevailing vehicle travel speed on a road section; however, the 85th percentile speed can also be used.
1.4.14
85th percentile speed
The 85th percentile speed is a statistic that is reported in traffic speed surveys. 85% of all
vehicles recorded in the survey have been observed travelling at this speed or below it. Road authorities specify that the 85th percentile speed can be used to describe the
prevailing vehicle travel speed on a road section; however, the upper limit of the 15 km/h pace can also be used.
1.4.15
Road
Function
Page 9 Road classifications can vary between road authorities. TMR’s road classification system for urban roads is defined within Appendix A of MUTCD Part 4 and is as follows:
Access or Local streets with the function to provide access to properties.
Collector roads with the function to provide access to properties and other streets.
Trunk Collector roads with the function to facilitate transport within districts.
Sub-Arterial roads with the function to facilitate transport across districts and
between arterial roads.
Arterial roads with the function to provide fast transport across large distances.
Controlled Access Arterial roads to provide transport through and around
metropolitan centres with minimal interruption from intersections e.g. motorways.
TMR’s rural classifications are limited to local, collector and arterial roads.
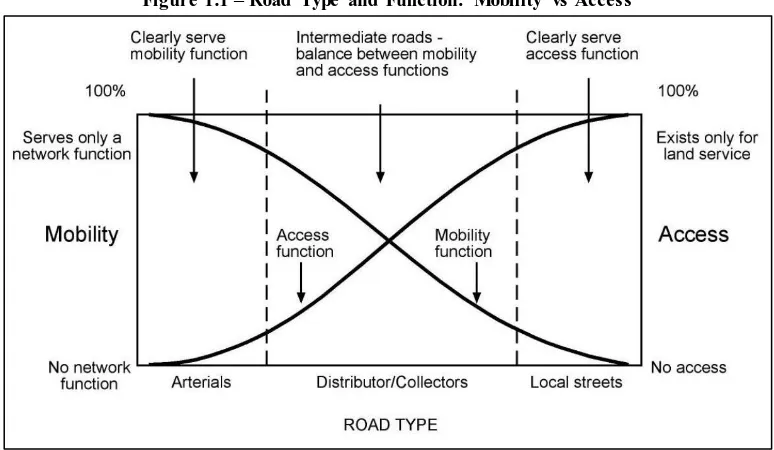
[image:18.596.104.491.484.709.2]The collection and categorisation of roads by function is referred to as a road hierarchy. The development of a road hierarchy can influence the development of a region as road classification dictates elements such as accessibility and posted speed limits. Austroads Guide to Traffic Management Part 1 (2015) outlines that a balanced network will meet both mobility and access needs, with higher speed limits implemented on roads that serve a clear mobility function and lower speeds implemented on roads that serve a clear access function.
Figure 1.1 – Road Type and Function: Mobility vs Access
Page 10
2.0
Literature Review
2.1
Purpose
The regulation of vehicle speeds in the public domain has always been undertaken in order to provide a safer environment for roadway users. Speed limits have been enforced from as early as 1861 in the United Kingdom under the Locomotives on Highways Act 1861. Speed limits have always been conveyed by static signage and pavement markings but recently, emerging technology is being utilised for both regulation and control of speed via systems such as variable speed limits and self-driving vehicles.
A speed limit is determined by a technical process and is employed to describe the maximum speed that vehicles are legally permitted to travel through a location under normal conditions. As outlined in AGRS03, the control of vehicle speeds is required on roads in order to achieve the following:
Minimise the impact of driver error and misjudgement of action-associated risks. Minimise potential severity of risks in the road environment that may not always
be obvious to road users.
Provide a safer road environment for other road users such as pedestrians, cyclists and other motorists.
Control environmental impacts such as vehicle noise, vibrations and emissions.
Page 11 The overarching concepts behind the decision making process of Speed Limit Reviews should be thoroughly understood by the practitioner prior to commencing a Speed Limit Review, and include:
the Safe System Approach
the correlation between vehicle speeds and crash risk the cost of crashes to society
factors which effect driver speed choice
the effects to society resulting from changes to existing speed limits.
These concepts are discussed in further detail within this section, in addition to other elements that will influence speed limit decision making in the future.
2.1.1
Safe System Approach
Initially endorsed by the Australian Transport Council in 2004, the Safe System Approach has been adopted as a commitment by Australian road authorities and forms the basis of their road safety plans and the National Road Safety Strategy for 2011 to 2020 (Roads and Traffic Authority of New South Wales 2011). The fundamental concept behind this approach is that road users will make errors that may lead to a crash. The road design process should consider this and adopt forgiving elements to attempt to avoid serious or fatal injuries in the event of a crash.
The four principles of a Safe System are typically presented as: safe roads and roadsides
safe speeds safe vehicles safe road use.
In addition to considering the principle of safe speeds, the decision-making processes behind the implementation of posted speed limits on a road should also consider the other Safe System principles in order to reduce the severity of inevitable crashes.
2.1.2
Speed and Crash Risk
Page 12 The Power Model is a description of the relationship between speed and accident
frequency. It was initially developed by Nilsson and refined by Elvik, Christensen and Amundsen. The Power Model consists of six equations that consider varying crash severity indices and takes the following form:
Figure 2.1 – The Power Model
𝐴𝑐𝑐𝑖𝑑𝑒𝑛𝑡𝑠 𝑎𝑓𝑡𝑒𝑟
𝐴𝑐𝑐𝑖𝑑𝑒𝑛𝑡𝑠 𝑏𝑒𝑓𝑜𝑟𝑒= (
𝑆𝑝𝑒𝑒𝑑 𝑎𝑓𝑡𝑒𝑟
𝑆𝑝𝑒𝑒𝑑 𝑏𝑒𝑓𝑜𝑟𝑒)
𝑋
[image:21.596.118.479.334.583.2]Under Nilsson’s model, different exponents are used for fatal accidents (4), fatal or serious injury accidents (3) and all injury accidents (2), although the research conducted by Elvik et al. recommends use of different exponents for these scenarios. The Power Model suggests that the chance for higher severity accidents can be greatly reduced with a reduction of speed. This relationship is shown in Figure 2.2.
Figure 2.2 – The Relationship between Speed and Casualties
Source: Austroads (2009) – based on Elvik et al. (2004)
Page 13 The report details that speed has an exponentially detrimental effect of the safety of road users. The chance of injury to car occupants greatly increases as speed increases. For example, it is reported that the likelihood of death is 20 times greater at an impact speed of 80 km/h than it would be at 32 km/h. This is similar for pedestrians involved in collisions with vehicles. As shown in Figure 2.3, chances of pedestrian survival dramatically decrease from impact speeds over 40 km/h.
Figure 2.3 – Pedestrian Fatality Risk as a Function of the Impact Speed of a Car
Source: World Health Organisation (2004)
Although it is impossible to prevent all crashes from occurring, steps can be undertaken to reduce the severity of crashes, such as speed reductions where appropriate and
installation of roadside devices. Undertaking steps to ensure reduction of crash severity at problematic locations can have economic benefits when considering the costs of crashes to society.
Austroads Guide to Road Safety Part 8: Treatment of Crash Locations outlines that the value of crashes in Australia are comprised of the following elements:
Human costs – ambulance and hospital costs, other medical costs. Labour in the workplace and household, and quality of life.
Insurance claims, criminal prosecution, correctional services, workplace disruptions, funerals.
Vehicle costs for repairs, towing, unavailability of vehicles.
Page 14 Two methods are used to establish crash costs in Australia, willingness-to-pay (WTP) and human capital, with WTP being preferred by road authorities. The 2013 WTP values for crashes in Queensland are shown in Table 2.1. These values describe the amount that society is willing to pay to prevent the risk of a crash of a particular severity. As shown, there is a large difference between the WTP value of fatal and other injury crashes, therefore it is highly desirable that crash severities are reduced where possible.
Table 2.1 – WTP Values in Queensland (June 2013 values)
Crash Severity Rural Environment Urban Environment
Fatal $8,059,079 $7,741,325
Serious Injury $294,906 $436,471
Other Injury $31,268 $23,446
Source: Austroads (2015)
2.1.3
Behavioural Influences
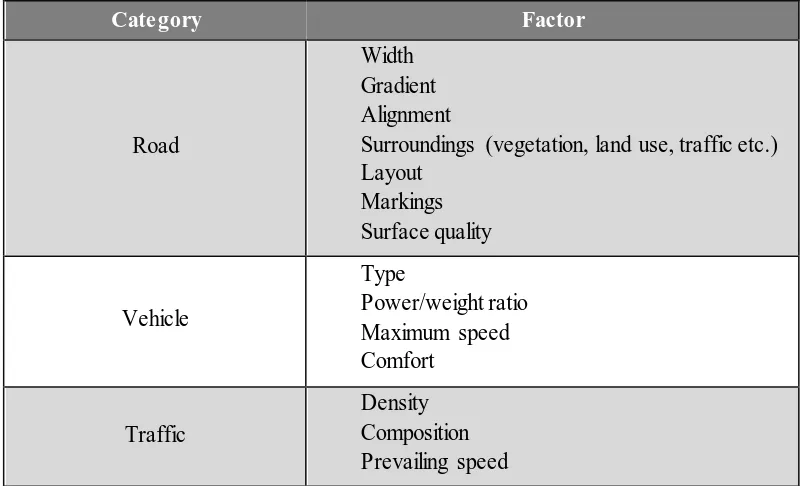
There are numerous factors that can influence a driver’s choice of speed, such as physical surroundings (i.e. road and environment), and characteristics of the individual. These elements are detailed in Table 2.2.
Table 2.2 - Influencing Factors of Speed Choice
Category Factor
Road
Width Gradient Alignment
Surroundings (vegetation, land use, traffic etc.) Layout Markings Surface quality Vehicle Type Power/weight ratio Maximum speed Comfort
Traffic
[image:23.596.97.498.462.705.2]Page 15
Category Factor
Environment Weather Surface condition Natural light Road lighting Signs Speed limit Enforcement Driver Related Age Sex Reaction time Attitudes Thrill-seeking Risk Acceptance Hazard perception Alcohol level
Ownership of vehicle Circumstances of journey Occupancy of vehicle
Source: World Report on Road Traffic Injury Prevention (World Health Organisation, 2004)
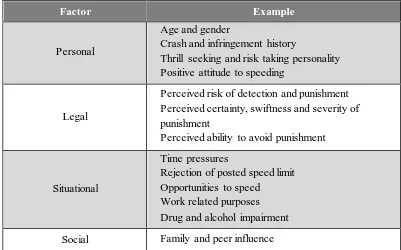
[image:24.596.98.498.74.369.2]Fleiter et al. (2016) further discusses driver related factors in an individual’s decision-making and choice of speed. There are four main groups of personal, legal, situation and social factors. Some of these factors overlap with the driver related factors described in Table 2.2, and are detailed in Table 2.3.
Table 2.3 – Additional Driver Related Factors
Factor Example
Personal
Age and gender
Crash and infringement history
Thrill seeking and risk taking personality Positive attitude to speeding
Legal
Perceived risk of detection and punishment Perceived certainty, swiftness and severity of punishment
Perceived ability to avoid punishment
Situational
Time pressures
Rejection of posted speed limit Opportunities to speed
Work related purposes Drug and alcohol impairment Social Family and peer influence
[image:24.596.96.497.503.753.2]Page 16
2.1.4
Speed Limit Effects on Society
Research has shown that community attitudes towards speeding tends to be relaxed and that speeding is acceptable when exceeding posted speed limits by a small amount or when viewed in comparison to other offences that are considered worse, such as drink-driving (Fleiter et al. 2016). Furthermore, an individual’s reaction to a posted speed reduction tends to be positive when the change is within an area that directly benefits the individual (e.g. improving safety in areas of residence). The change is typically opposed when it is applied to a road used for commuting and has a minor impact to convenience. Outside of road safety and amenity, MUTCD Part 4 does not specifically address numerous issues that can affect the community. These other issues can be viewed on a whole as the benefits and costs associated with speed reductions that are not tied directly to road safety, such as reductions in vehicle operating cost and environmental and noise pollution.
A common misleading assumption made by road users is that increasing travel speed can have a significant decrease to travel time, whereas in reality, significant delays to travel time are typically caused by poor traffic signal coordination and critical lane volume to capacity ratios (Archer et al. 2008). In addition to decreased road trauma, there are significant benefits to society in reducing posted speed limits including, but not limited to, decreases in vehicle operating costs, emissions and noise. The research conducted by Archer et al. infers that the economic benefits of reduced trauma usually outweigh those of travel time. This is due to the reductions in travel time from speed limit increases typically being minor.
2.2
Speed Measuring Methods
2.2.1
Tube counts
Page 17
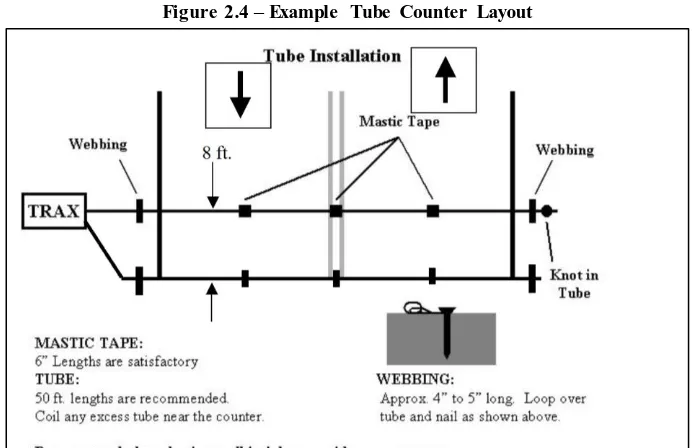
Figure 2.4 – Example Tube Counter Layout
Source: McGowen and Sanderson (2011)
Key data that can be obtained from speed surveys conducted with tube counts are the mean travel speed, 85th percentile travel speed and upper limit of the 15 km/h pace.
MUTCD Part 4 specifies that the data collection point should be at a location that is representative of the entire section being assessed. This can be an issue if the homogenous sections of a road are considered by changes in the nature of the road alignment (i.e. straight, to winding, to straight), given the potential costs of installing multiple counts. Instead, the standard practice is to lay one count per speed zone, often in a flat and straight section where speeding is most likely to occur. This practice can skew results and present inaccuracies in speed survey results as the count only considers the prevailing speed at a single point rather than the entire road section.
2.2.2
Bluetooth
Bluetooth is a communications protocol for wireless data transmission and is found in common items owned by the population such as phones and in car radios. As devices with Bluetooth capability have unique identifiers (MAC addresses), Bluetooth can be used count and track the unique addresses within a traffic stream and allow for
Page 18 Use of the technology on urban arterial roads can cause some issues due to the presence of different modes of travel. Additional work is normally required to analyse travel times and distinguish readings from motor vehicles, bicycles and pedestrians. This task can be difficult during peak hours where traffic speeds of motor vehicles and bicycles are low and similar due to congestion (Araghi, Krishnan & Lahrmann 2015). Additionally, the presence of multiple devices in a vehicle with Bluetooth enabled can produce an overrepresentation of data.
As the technology relies on Bluetooth being enabled on passing devices, sample sizes on rural roads with low traffic volumes may not be large enough to make an informed decision as to the prevailing traffic speed on the road.
2.2.3
Mobile Phone Locational Data
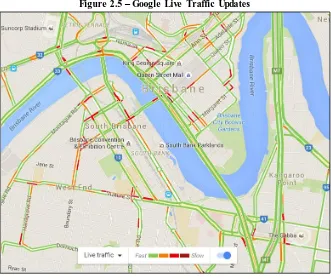
[image:27.596.133.464.448.727.2]GPS has become a common form of technology that is carried by a large portion of the population and can be found within almost all modern cars and smartphones. Locational data can be obtained from GPS enabled applications in smartphones that locate vehicles on the road network in real time. This information is typically collected by organisations such as Google to provide up to date traffic congestion reports and allows motorists to partake in route selection while driving. An example of the technology is shown in Figure 2.5.
Figure 2.5 – Google Live Traffic Updates
Page 19 With GPS forming the basis of locational data, vehicle speeds on the road network can also be recorded. This method can be an unobtrusive way (as there are no physical devices to be observed by a motorist) of determining the prevailing traffic speed on a given road, however it requires the user to have mobile tracking and GPS enabled on their smartphone. This may not be common within rural areas and sample sizes may be too small to make a reliable determination of the prevailing traffic speed on a road. Furthermore, although locational data does not reveal the identity of an individual by their device, the community’s perception of tracking data may not be favourable which could raise issues around data privacy.
2.3
Risk Assessment Methods
2.3.1
AusRAP Data
[image:28.596.114.484.446.693.2]AusRAP is a risk assessment tool that is a subset of the International Road Assessment Program (iRAP), a program adopted in numerous countries with the aim of improving road safety. The AusRAP rating system is a star based system used to describe road safety and rates roads on a scale of one star to five star, with one star being the least safe and five star being the safest. An example of the rating system applied to a road is shown below in Figure 2.6.
Figure 2.6 – AusRAP Rating Example
Page 20 Ratings are determined through consideration of road infrastructure attributes that are known to influence both the severity and likelihood of a crash (Turner et al. 2009). These attributes are collected through analysis of video records and include, but are not limited to, traffic volumes, seal widths, posted traffic speeds, presence of roadside objects and their proximity to travel lanes.
In querying a specific road through the iRAP system, the data can be obtained and thus the safety risks on the subject road can be easily identified. Rather than using crash history to identify safety deficiencies that have caused speed related crashes, reviewing the associated risk of a road and the road environment can provide an indication as to whether the current (or proposed) speed limit is appropriate.
An advantage to using AusRAP data is that the practitioner will be able to use an inventory containing an extensive range of road attributes to make an informed decision in speed limit setting. One if the issues with this, however, is that data is typically recorded by inspection of video footage and the task of data recording can be outsourced to individuals without a technical background. This can present problems with data quality. Use of AusRAP data for speed limit setting must ensure that all data is verified, which can be a lengthy process due to the thousands of kilometres of Queensland roads.
2.4
Intelligent Transport Systems
2.4.1
Variable Speed Limits
Page 21
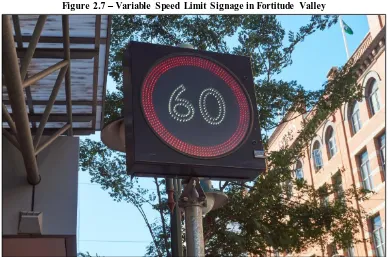
Figure 2.7 – Variable Speed Limit Signage in Fortitude Valley
VSLs are most commonly found in Queensland on arterial roads and through school zones. Speed limits are reduced to 40 km/h through school zones during morning and afternoon school peaks as a safety measure to minimise risks when there are a high amount of vehicles and pedestrians around a school. The times that the reduced speed limit is in effect are signalled on specialised signage.
When utilised in highway and motorway environments, the system is typically called a managed motorway. TMR have recently implemented a managed motorway system on the Bruce Highway to control vehicle speeds around on-ramps between the Gateway Motorway and Caboolture. The reduction of speed limits during times of congestion (or incidents and bad weather) at this location has benefits of safer merging conditions, maximisation of capacity and improved travel time reliability (The Department of Main Roads and Transport 2016).
Page 22
2.4.2
Self-driving technology
It is predicted that autonomous-driving technology will be advanced enough by 2019 that self-driving vehicles (with driver intervention as needed) will be viable under freeway conditions, and that self-driving in most conditions will be achievable by 2030 (Wadud, MacKenzie & Leiby 2016).
Self-driving vehicles are expected to make improvements to traffic operations and environmental impacts. Automation of acceleration and braking will provide benefits of congestion reduction through minimising traffic stream shockwaves, utilising shorter gaps in traffic and efficiency in platooning and route choice (Fagnant & Kockelman 2015). Environmental benefits are expected as well from reductions to fuel consumption and emissions, and brake wear.
Page 23
2.5
The Manual of Uniform Traffic Control Devices Part 4
2.5.1
MUTCD Part 4 Overview
Part 4 of the MUTCD is dedicated to the control of traffic speeds within Queensland and provides guidance on the following:
speed management and application speed zoning and Speed Limit Reviews speed limit signs and pavement markings.
The processes involved in speed management, speed zoning and Speed Limit Reviews are of particular relevance to this project. Sections 3 and 4 of MUTCD Part 4 outline the procedures to be undertaken in the establishment and review of speed limits, and are therefore the primary focus of this research project. The eighth edition, published June 2015, has been reviewed for this project.
MUTCD Part 4 is similar to the guidelines implemented in other Australian states and is closely aligned with Australian Standard 1742.4 and Austroads guidelines. It adopts the principles outlined within these documents to form guidance for practitioners in
Queensland. It should be noted that there is a supplement to the Manual. The supplement outlines additional considerations that are not covered within the main document (e.g. speed limits in special areas). The currency of the supplement at the time of preparing this dissertation was May 2016.
One of the primary goals of MUTCD Part 4 is to ensure that there is a balance between road safety, amenity and mobility on public roads. The principles and general
requirements of speed management (Clauses 2.1.2 and 2.1.3) stipulate that the posted speed of a road should not be so low as to negatively affect its amenity and must be suitable in context to its characteristics to ensure that users do not experience unnecessary delay. Unnecessary delays can have a number of negative impacts such as economic loss and incompliance with speed limits. This can introduce follow-on impacts that reduce road safety such as differential speeds. The presence of differential speeds between vehicles in the traffic stream increases the number of interactions between vehicles and therefore increases the probability for crashes to occur.
Page 24
2.5.2
Speed Management
The speed management processes within MUTCD Part 4 have been devised to facilitate road safety, mobility and amenity on public roads. This is to be achieved by providing a speed limit that appears both compatible and credible with the speed environment in the road user’s perspective.
As detailed in MUTCD Part 4, the principles of speed management are:
Speed limits should be capable of being practically enforced by reducing amounts of speed changes, ensuring zones are of adequate length and clarified by frequent and adequate sign posting.
Speed limits need to be credible i.e. not set so low that road users ignore them. Speed limits should not be applied to address geometric deficiencies on a road. Only general urban, rural and school zone speed limits should be applied to
unsealed roads and roads with narrow seals. All posted limits should be in multiples of 10 km/h.
As outlined previously, it is expected that posted speed limits that are implemented on Queensland roads must maintain a certain standard of road safety and amenity while being appropriate for the road user’s perception of the environment. In setting appropriate speed limits, the potential for crashes resulting from a speed differential (where two vehicles are travelling at different speeds) can be reduced, as the prevailing traffic speed will be in alignment with the posted speed limit.
Page 25
2.5.3
Speed Zoning and Speed Limit Reviews
2.5.3.1
MUTCD Part 4 Section 3
Section 3 of MUTCD Part 4 details criteria based speed limits and the requirements for their application.
As the name infers, a criteria based speed limit is a speed limit that can be applied to a road if certain criteria are met. Criteria specified within the Manual consider road characteristics that include, but are not limited to:
roadway width daily traffic volumes
intersection spacing on the road and surrounding land uses.
In the current version of MUTCD Part 4, the utility of criteria based speed limits is restricted. They can only be implemented in the following road environments:
special zones and local streets (40-50 km/h) 110 km/h zones
approaches to rural intersections rural residential areas
foreshores (covered within Part 4 supplement Clause 3.5.3) bridges (covered Part 4 supplement Clause 3.7-1).
This limited utility means that, to be in conformance with MUTCD Part 4, if the
Page 26
2.5.3.2
MUTCD Part 4 Section 4
Section 4 of MUTCD Part 4 details the Speed Zoning and Speed Limit Review procedures that are undertaken on existing roads in Queensland.
Speed Zoning is the action of determining appropriate posted speeds for an existing length of road. The current posted speed limit may not align with the prevailing traffic speed and thus is inappropriate for the conditions, or there history of speed related crashes warranting a review. The process may also be undertaken after the opening of new roads when traffic patterns have been established.
Speed zoning is undertaken on roads where general and criteria based speed limits cannot be applied (or are ineffective) under the guidelines outlined within MUTCD Part 4. As the opportunity to apply criteria based speed limits is restricted to a small range of speed limits and road environments, a Speed Limit Review must be undertaken in most
assessment scenarios.
As outlined in Clause 4.2.1 of MUTCD Part 4, three elements are considered when conducting speed zoning or a Speed Limit Review:
road function
prevailing traffic speeds speed environment.
The process should also consider other aspects such as crash history and safety risks (confirmed with site inspections) on the assessed corridor.
2.5.3.3
Road Function
In considering the road function, the road environment should be consistent with its function. For example, the road environment on a rural road may be high speed with minimal development and few accesses every kilometre, whereas the road environment in an urban area may be low speed with dense development and numerous accesses every kilometre. The road classification can dictate road environment, mobility levels and safety for users, and speed limits are heavily influenced by the road
Page 27
2.5.3.4
Prevailing Traffic Speed
The prevailing traffic speed is considered as what the public perceives as an acceptable travel speed for the section of road being analysed. Two speed statistics can be used to define the prevailing traffic speed on a section of road:
The 85th percentile speed or,
The upper limit of the 15 km/h pace.
Either of these statistics can be found from traffic speed survey data and, if the collected speed data shows an ideal distribution, the 85th percentile speed and upper limit of the 15
km/h pace will be similar. As outlined in Appendix C of MUTCD Part 4, TMR use the upper limit of the 15 km/h pace for review processes.
2.5.3.5
Speed Environment
The speed environment consists of factors that can influence a road user’s driving
behaviour and perception of safe travel speed. These elements are external and cannot be changed by the road user, consisting of:
The presence, or absence, of roadside development.
Road characteristics such as the width of the carriageway and allocated lanes, the alignment of the road, the presence and frequency of accesses, the presence of roadside hazards such as trees and their proximity to the travel path.
Traffic characteristics such as volume and activity fluctuations, the composition of the road traffic (heavy vehicle, pedestrians, cyclists) and the driving behaviour of other road users.
2.5.3.6
Crash History
A high occurrence of speed related crashes could highlight that a posted speed limit on a road is inappropriate. As higher speeds tend to increase injury severity, which in turn can the mask the significance of road deficiencies and roadside hazards, the crash history of the road section being reviewed can play a critical part in the speed zoning and Speed Limit Review process.
Crash data analysis considers the previous five years of crash data for the road section being assessed. The data is used to calculate the casualty crash rate as an Equivalent Risk Unit (ERU) per 108 vehicle kilometres travelled using formulas given in Appendix E of
Page 28 As of 2012, Queensland crash data is recorded only for Fatal or Seriously Injured (FSI) crashes; crashes of lesser severity are no longer recorded by the Queensland Police Service. The lessening availability of data is an issue as the crash data analysis equations outlined in MUTCD Part 4 presently consider all casualty crashes on the subject road to calculate the risk for future crashes. From 2018, five year period crash data for all roads will shrink and may lead to an under representation of crash risk if the current method continues to be utilised. This scenario is illustrated in Figure 2.8.
Figure 2.8 – Crash Data Collection
2.5.3.7
Procedure for Determining Speed Limits
The Speed Limit Review process is undertaken when the criteria based approach outlined in Section 3 of MUTCD Part 4 cannot be applied. It consists of the speed zoning
assessment of a road and the subsequent actions required to implement (or reject) the revised speed limit recommended in the speed zoning assessment. The Speed Limit Review process outlined in MUTCD Part 4 has been established for the following reasons:
To provide guidance for practitioners in data collection and analysis.
To provide a methodology for consistent application across different jurisdictions and practitioners.
To ensure consistent correlation of speed environments with speed limits. To produce standard documentation for the process, ensuring accountability and
quality control.
To reserve integrity and credibility of speed limits.
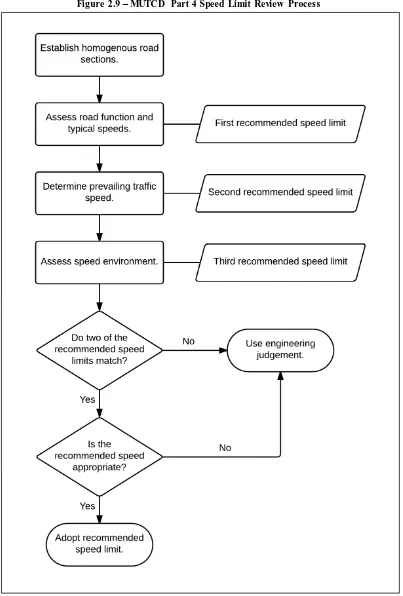
Page 29 ensuring that reviews can be completed with consistency by different practitioners. It requires data inputs such as the road characteristics, speed survey details and crash history to determine an adequate speed limit for the road section. The steps detailed below give an overview of the speed zoning assessment process:
1. Establishment of homogenous sections of road. The review should only be undertaken on segments of road that are homogenous in terms of characteristics and speed environment i.e. same speed length and carriageway width for the entire corridor. If the road has distinct changes in environment or speed, it should be divided into multiple homogenous sections.
2. Assessment of the road function to allow comparison of the existing speed limit to the typically assigned speed limit for the road function. In the event of a discrepancy, amending the road function should be considered.
3. Assessment of prevailing traffic speeds. A traffic speed survey should be conducted to determine the 85th percentile or upper limit of the 15 km/h pace on
the assessed road section. If the existing speed limit correlates with the prevailing traffic speeds, then the existing limit is retained, otherwise speed data is analysed to determine an alternative speed limit.
4. Assessment of speed environment to understand the suitability of the existing speed against the surrounding environment (roadside objects, number of accesses etc.)
Each of the assessment stages is conducted as a singular process in QLIMITS and a recommended speed limit is provided for each stage, independent of what details have been provided for the other stages. A correlation of two recommended speed limits indicates what the review process considers as an appropriate speed limit for the assessed road section. If no correlation is achieved or if the QLIMITS recommendation is not suitable for the assessed road, engineering judgement is used to determine an appropriate speed limit for recommendation. Figure 2.9 outlines this process (on next page).
Page 30
Page 31
2.6
Australian Standards and Guidelines
2.6.1
Victoria
The Victorian speed zoning guidelines are outlined within VicRoads’ Traffic Engineering Manual Volume 1 Chapter 7 and have been written to supplement the Australian
Standard and Austroads guidelines. Although its principles of speed management align with those that form MUTCD Part 4, the guidelines largely differ in that they have been written in a fashion to avoid large sections of complex content. Diagrammatic
representations of speed zoning processes are also provided for clarification. This is advantageous over MUTCD Part 4 as the simplification removes ambiguity for the practitioner and facilitates consistency in application. Another notable difference between Victoria and Queensland is that Victoria does not implement 70 km/h and 90 km/h zones on its road network (i.e. speed zones on the road network are only in values of 40, 50, 60, 80, 100, 110).
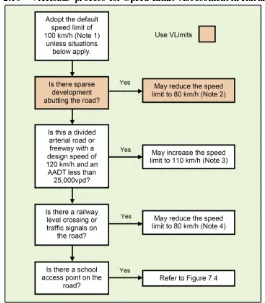
[image:40.596.165.430.460.763.2]Assessment of speed limits is undertaken by assuming a default speed (urban or rural) and following a mapped process to determine if the default speed should be reduced or increased. The process for rural areas is shown in Figure 2.10. As shown in the figure, a branch in the decision tree requires the practitioner to use VLimits, a similar decision making platform to QLIMITS.
Figure 2.10 – VicRoads process for Speed Limit Assessment in Rural Areas
Page 32 It is possible to assess a speed limit for a rural environment using only the mapped
process shown previously; however, VLimits must be used for any deviations from the urban default limit of 50 km/h in urban environments.
2.6.2
New South Wales
The New South Wales Speed Zoning Guidelines (maintained by Roads and Maritime Services) are based off the principles outlined in AS1742.4 and Austroads guidelines, and thus follow the same principles outlined within MUTCD Part 4.
The assessment procedure follows a 10-step process that differs from the Queensland process through undertaking multiple site inspections and solely depending on the use of engineering judgement to determine an appropriate speed limit (as opposed to use of a platform such as QLIMITS). The process requires the following actions:
A crash history analysis to understand if speed is a determinant in the severity or outcome of all crash types.
An initial site inspection to understand the road environment.
A seven day speed survey to obtain and review statistics such as mean speed, 85th
percentile speed and percentage exceeding the current speed limit.
Following these steps, the practitioner should form an opinion on an appropriate speed limit by comparing the assessed road against typical speed environments described within the guideline. Consultation with relevant stakeholders and a second site visit to confirm additional devices and works required to accommodate the speed limit is undertaken before the authorisation process.
Page 33
2.6.3
Western Australia
Main Roads Western Australia have prepared guidelines in which a particular speed limit can be assigned to a road of a particular function and characteristics. This system is similar to the application of criteria based speed limits outlined in MUTCD Part 4, albeit the criteria is less specific in terms of road characteristics. The guidelines require the practitioner to identify the function of the assessed road and then refer to a table that specifies the speed limit for that function. An allowance is given for deviations of 10km/h increases or decreases to the assigned speed, providing the opportunity to adjust a speed limit to suit the road environment.
Speeds can be further increased or reduced outside of the 10 km/h deviation if certain criteria are met or if the 85th percentile speed is more than 10 km/h different from the
determined speed. Criteria that is considered in speed reductions includes roadside development (frequency of accesses), hazards within 3 km of consecutive road and the road crash history.
2.7
International Guidelines
2.7.1
United States of America (California)
In some states, particularly on the west coast, the USA road network shares similar characteristics with the Australian road network. The country is expansive with localities separated by large distances and connected by high-speed highways. It is appropriate to understand the Speed Limit Review processes undertaken in the USA as some aspects may be applicable to Queensland roads. Similar to Australia, there are different road authorities for different states, who have different guidelines. The California Manual for Setting Speed Limits prepared by the California Department of Transportation has been considered in this review due to the weather conditions and topography of California being similar to that of Queensland.
The prevailing speed limit is typically assigned as the posted speed limit on Californian roads. This is considered as the 85th percentile speed as determined by an Engineering and
Traffic Survey. Roadway safety is also a primary consideration in establishing speed limits. The speed environment and crash history must be assessed in addition to the prevailing traffic speed.
Page 34 zones. Although this is a simple method to ensure consistent speed zoning, it does not account for elements such as driver impatience in low speed areas.
2.7.2
Sweden
Jurewicz et al. (2014) detail that in Sweden, depending on the tier of road, speed limit setting can be undertaken by authorities at all levels (national, regional and local). The process of speed zoning is similar to other countries in that speed limits can be increased if the road and roadside environment are considered to be at an acceptable standard for the proposed speed limit. Speed reductions aimed at improving safety in small villages and high-volume intersections can be undertaken at the discretion of regional councils. It is important to note that in Stockholm, a speed limit of 30km/h has been adopted on residential streets in order to provide a safer environment for pedestrians and cyclists, and that no negative impacts to average speeds and flows have been observed while recorded maximum speeds have decreased.
Guidelines translated to English could not be found. From all available documentation on the subject that could be understood, it appears that Sweden do not implement any additional or have any discernible differences in assessment procedures from those used by Australian road authorities.
2.7.3
United Kingdom
The Setting Local Speed Limits guidelines prepared by the Department for Transport in the United Kingdom place an emphasis on considering crash history when assessing the speed limit of the road. Like Australian guidelines, the other factors to be considered in the assessment process are the road function and speed environment. An appraisal tool can be used to estimate the effects of implementing a speed limit; however, it is not for the same purpose as the QLIMITS platform and appears to be for economic analysis. It considers inputs of vehicle operating costs and emissions alongside traffic characteristics. The UK guidelines deviate from Australian guidelines and suggest that the mean speed determined from traffic surveys should be adopted for local speed limits (as opposed to the 85th percentile or upper limit of the 15 km/h pace). Adopting this sort of change in
Australia may pose an issue given that the 85th percentile speed is considered as what
Page 35 There are also other differences with the guidelines in that the length of speed zones should be a minimum 600m regardless of the posted speed limit (lengths of 300-400m are permitted in exceptional circumstances). Effects on air quality is also another factor that is detailed within the guidelines, implying that reductions to the posted speed limit should be considered at locations where air pollution is of concern.
2.7.4
New Zealand
The New Zealand Transport Agency requires assessment of speed limits to be conducted in accordance with its Speed Limits New Zealand (SLNZ) guidelines. Like the Australian guidelines, the SLNZ method has been developed with the principles of road function, speed environment and crash history in mind. Default limits of 50 km/h and 100 km/h are used in urban and rural areas and may be changed between 20 km/h to 100 km/h
dependant on the function of the road.
The process of assessing whether a speed limit is appropriate is completed through typical methods (i.e. site investigations, crash history analysis etc.) however the decision-making process in calculating a speed limit is undertaken with a rating system. The system considers a collection of survey data to arrive at a rating that is used as an input on a flow chart that determines the appropriate speed limit for the road. An example of one of the SLNZ flow charts is shown in Figure 2.11 (on next page).
The input rating considers the assessed road in separate 100m segments and is the
Page 36
Figure 2.11 – SLNZ Flow Chart for Urban Roads
Source: New Zealand Transport Agency (2004)
Page 37
Table 2.4 – Example SLNZ Roadway Rating Criteria (Geometry)
Type of Roadway
Alignment
Open Visibility Average Visibility
Limited Visibility Divided carriageway
(solid median or barrier) or one way
0 0 0
4 or more lanes (flush
median or undivided) 0 1 1
2 or 3 lanes (flush median
or undivided) 0 1 2
1 lane (two way) 3 4 5
Source: New Zealand Transport Agency (2004)
This methodology requires a large input of data and appears to utilise more precision in decision-making than the Speed Limit Review process outlined in MUTCD Part 4. The calculations required to determine development and roadway ratings provide a degree of transparency, showing the practitioner what particular elements of the assessed road affect the speed limit recommendation given by SLNZ. This contrasts to QLIMITS, which does not provide feedback on the effect of data inputs.
As shown in Table 2.4, the rating system considers each element in specific detail and in the case of geometry, adds to the road rating (resulting in a lower speed) based on available carriageway width and visibility. Although there is an option to note substandard elements in the QLIMITS system, it does not consider those inputs to determine final recommendations like the SLNZ system.
2.8
Guideline Summary
[image:46.596.98.498.85.317.2]Page 38
Table 2.5 – Guideline Observations: Application and Outcomes
Region Application Outcomes
Queensland
The Speed Limit Review process outlined in Section 4 is easy to apply, but the written content can be difficult to follow.
The mandatory use of QLIMITS can be an
unnecessary consumption of time.
Establishment of homogenous sections can be inconsistent and/or incorrect, depending on the practitioner’s level of experience.
QLIMITS can produce inappropriate
recommendations for speed limits, requiring engineering judgement to be applied to correct it. Experience is required to ensure suitable corrections.
Although engineering judgement is permitted, it is not something that is
emphasised within MUTCD Part 4 and is not mentioned within the main body of the document. Practitioners may assume that QLIMITS results are final and inappropriate speed limits may be recommende