Shewhart Control Chart for Individual Measurement: An Application in
a Weaving Mill
Raaj Kishore Biswas*
Institute of Statistical Research and Training, University of Dhaka, Dhaka, Bangladesh
Mohammad Shahed Masud
Institute of Statistical Research and Training, University of Dhaka, Dhaka, Bangladesh
Dr Enamul Kabir
School of Agricultural, Computational and Environmental Sciences, University of Southern Queensland,
Queensland, Australia
2
Shewhart Control Chart for Individual Measurement: An Application in a Weaving
Mill
Abstract
Control Chart is a very common quality control tool in Industrial sector. Statistical quality control
technique is used to determine the control limits and for exploring the changes that require improving
the process. In real life there are many situations where the sample size used for process monitoring
is one and then control chart for individual measurement is used. The data collected from a weaving
mill provided six months of data on four characteristics for each bale of thread namely Fiber Fineness
(Mic), Whiteness (Rd), Yellowness (+b) and Spinning consistency index (SCI). Moving Range Chart
and Individual Measurement Chart has been applied on each of the characteristics to find out quality
of bales of thread on those months and to determine a standard range for each parameter. After
evaluating around 70 quality control charts the suggested range for Fiber Fineness, Whiteness,
Yellowness and Spinning Consistency index should be 3.162075 to 4.396583, 75.08009 to 81.50754,
6.953162 to 9.434838 and 116.4203 to 185.8005 respectively. Garments industry is the largest export
industry for Bangladesh constituting 75% of total export accumulating 10.5% of the country’s GDP
but still they lack in terms of quality control. In this paper an overview of quality control process is
done on a leading garments industry in Bangladesh, specifically a weaving mill. This also paves a
way to use other quality control processes and a chance to compare with these processes to determine
a more suitable process for garments industries.
Keywords: Textile, Thread quality, Fiber Fineness, Whiteness (Rd), Yellowness (+b), Spinning Consistency index
Statistical quality control refers to the use of statistical methods in the monitoring and
maintaining of the quality of products and services. Statistical quality control is applied in order to monitor and control a process. Monitoring and controlling the process ensures that it operates at its full potential (Montgomery, 2007).
W. A. Shewhart first proposed the use of control charts in 1931, which commonly bear his name as Shewhart control charts (Shewhart, 1931). Control charts are commonly used in production environments to analyze process parameters to determine if a controlled process is within or out of control, i.e. to distinguish between assignable and common, also called chance, causes (Smith, 1994). Samples collected from the process are prospectively used to monitor departures from the in-control process, hence deeming the system is in control or not (Jensen, Jones-Farmer, Champ and Woodall, 2006). In addition, data from the process can be used to predict the future performance of the process. If the chart indicates that the monitored process is not in control, analysis of the chart can help determine the sources of variation, as this will result in degraded process performance. A process that is stable but operating outside of desired (specification) limits. There is a need to understand the causes of current downgrading performance and ways to fundamentally improve the process.
4
situation the Shewhart control chart for individual measurement is used (Montgomery, 2007). There are many applications of Shewhart control chart for individual measurement. In recent years one study examined the effects of non-normality as measured by skewness and provided an alternative method of designing individuals control chart with non-normal distributions (Kan and Yazici, 2005). Another application was in the control system of the combustion process and protection from explosions in the boiler furnace of thermal power plant using the techniques of control charts including shewhart control chart for individual measurement (Kisic, Petrovic, Jakovljevic and DJurovic, 2013).
This papers deals with quality measurement process in Bangladesh. Garments industry is the largest export industry for Bangladesh constituting 75% of total export accumulating 10.5% of the country's GDP, and contributing 40% of its manufacturing output (Mottaleb and Sonobe, 2011). In spite of rapid growth over last three decades textile industry has been lacking in terms of quality control. In this paper an overview of quality control process is done on a leading garments industry in Bangladesh, specifically a weaving mill. Here two specific control techniques have been used: Moving Range Chart and Individual Chart, which are explained in methodology part. Hence this project is suggesting parameters of quality characteristics using Shewhart control chart of individual measurement for this industry paving a way to use statistics for maintaining quality control.
2. Methodology
2.1Control Chart:
Control charts, also known as Shewhart charts (after Walter A. Shewhart) or process-behavior charts, in statistical process control are tools used to determine if a manufacturing or business process is in a state of statistical control (Montgomery,2007)
Figure 1: A typical Control Chart From the given chart in Figure 1, we realize the chart has a center line (CL) and upper and lower
control limits (UCL and LCL). The center line represents where this process characteristic should fall if there are no unusual sources of variability present.
Control chart can be of different types. Depending on researcher’s demand, different charts are used (Wheeler and Chambers, 1992). Individual Measurement Charts have been used in this paper.
2.2Individual Measurement Chart
6
corresponding moving range chart. Moving Range charts displays moving ranges of two successive measurements.
An assumption of using moving range chart is the data must be normally distributed. The difference between data, , and its predecessor, , is calculated as Moving Range
| – 1|, for individual values, there are 1 ranges.
Next, the arithmetic mean of these values is calculated as,
MR ∑ MRi
1
If the data are normally distributed with standard deviation σ then the expected value is
2 2 /√
The upper control limit for the range (or upper range limit) is calculated by multiplying the average of the moving range by D4:
UCL = D4
In this paper, the value 3.267 is taken from the sample size-specific D4 anti-biasing constant for n=2, as given in most textbooks on statistical process control (for example, Montgomery).
The lower control limit for range is calculated by multiplying the average of the moving rage by D3
LCL = D3
In this paper, the value 3.267 is taken from the sample size-specific D3 anti-biasing constant for n=2, as given in most textbooks on statistical process control.
To calculate the individuals control limits,
First, the average of the individual values is calculated:
̅ ∑
upper and lower natural process limits) are calculated by,
UCL = (3 /d2)
LCL = (3 /d2)
The value d2 = 1.128 is obtained for n=2, as given in most textbooks on statistical process control (for example, Montgomery 2007)
3. Data Description
To accomplish the objectives, collection of data was very important. As most industries in Bangladesh do not have quality control system and those who do have do not want to share data for confidentiality issues, collecting practical raw data was a great challenge. The authors were able to collect data with assurance of full confidentiality and anonymity. Data was entered into Microsoft Excel 2010 and analyzed after cleaning data. The data discussed here is from the Weaving Mill where they produce bales of threads from cottons imported from India and the industry collects data on the quality of the thread. They need to give reports on the thread for every delivery. From there the data was collected. These data shows four characteristics, among many, of threads that are produced in that Factory. All of them are tested in machines and shows the characteristics for each bale of thread (Majumdar, Sarkar and Majumdar, 2005). Details of the parameters of quality measurement are given in the subsequent sections.
3.1Fiber Fineness(Mic)
8
maturity ration is calculated using a sophisticated algorithm based on several HVI™ measurements.
3.2Whiteness (Rd)
Color is an important component of measuring the quality of thread. Determination of cotton color requires measurement of two properties: the grayness and yellowness of the fibers. The grayness is a measure of the amount of light reflected from the mass of the fiber. It is called this the reflectance or Whiteness value in the industry.
3.3Yellowness(+b)
The yellowness is measured on Hunter’s +b scale, named after the man who developed it. It is the other quality of the color property of thread.
3.4Spinning consistency index (SCI)
The Spinning Consistency Index (SCI) is a calculation for predicting the overall quality and spin ability of the cotton fiber. The main use of Spinning Consistency Index in selecting bales is to gain the advantage that all major cotton properties have been selected in a controlled way, and a consistency in fiber properties exist between fibers obtained from the selected bales throughout a season.
4. Analysis of The Results
In this section the results of the control chats will be shown and they will be interpreted in terms of the parameters of the threads.
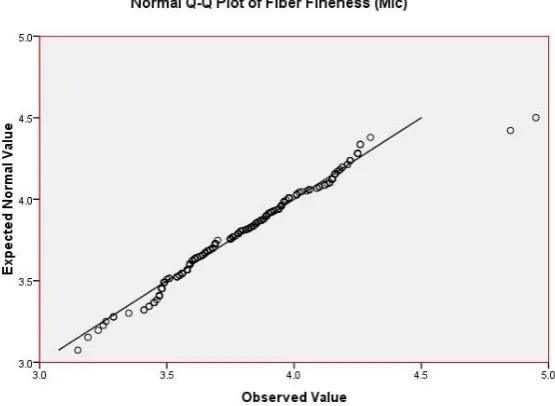
To check the assumption of normality distributions we performed the following Q-Q plot in Figure 2 and found out that this variable satisfies normality assumption:
Figure 2: The Q-Q plot for Fiber Fineness (Mic)
10
(a) MR Chart for December Mic Test (b) Individual Chart for December Mic Test
(c) MR Chart for January Mic Test (d) Individual Chart for January Mic Test Figure 3: MR and Individual chart for December and January for Fiber Fineness (Mic)
In figure 3, from the first two charts we get that the MR Chart and Individual Chart of Fiber Fineness Test in December is in control. Hence the process of production of in terms of Fiber Fineness is of export quality in December. In the latter two charts we get that the MR Chart is not in control although the Individual Chart of Fiber Fineness Test in January is in control. Hence the process of production of in terms of Fiber Fineness is not of export quality in January.
Now if the results of the Fiber Fineness Test are plotted over six months, for both Moving Range and Individual Chart, then we receive:
For Moving Range Chart,
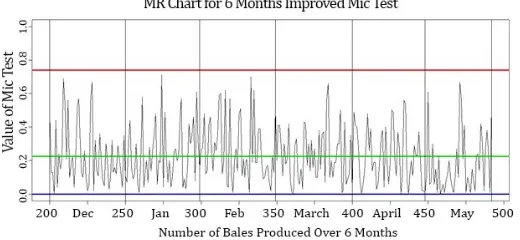
(a) MR Chart for Mic Test (b) Improved MR Chart for Mic Test
[image:11.595.174.434.384.504.2](c) Final MR Chart for Fiber Fineness Test
Figure 4: Moving Range Charts for Fiber Fineness (Mic) Test
Form the first Graph (a) in Figure 4 it can be interpreted that some values of Fiber Fineness test out of control range. Hence they are not of export quality. If the chart is revised, that is the out of range values are excluded and then new plot is constructed with new range we attain another graph (b). And if it not still within range the process is continued till the proper range is attained in the final graph(c). Here we attain a chart that shows the values of Fiber Fineness test are within range. Here,
12 For Individual Chart,
(a) Individual Chart for Mic Test (b) Individual Chart for Mic Test
Figure 5: Individual Charts for Fiber Fineness Test
Form the first Graph (a) of Figure 5 it can be interpreted that some values of Fiber Fineness test out of control range. Hence they are not of export quality. If the chart is revised, that the out of range values are excluded and then new plot is constructed with new range we attain another graph (b). And if it not still within range the process is continued till the proper range is attained. Here we attain a chart that shows the values of Fiber Fineness test are within range. Here,
UCL= 4.396583, CL= 3.779329 and LCL= 3.162075
Similar process has been applied to the other three characteristics to find out the precise limit using both MR chart and Individual Chart. Only the final revised charts are shown.
4.2Results of Whiteness (Rd), Yellowness(+b), Spinning consistency index (SCI)
(a) The Q-Q Plot for Whiteness (Rd) Test (b) The Q-Q Plot for Yellowness (+b) Test
(b)The Q-Q Plot for Spinning consistency index (SCI) Test
Figure 6: Q-Q Plots for checking the Normality assumption
14
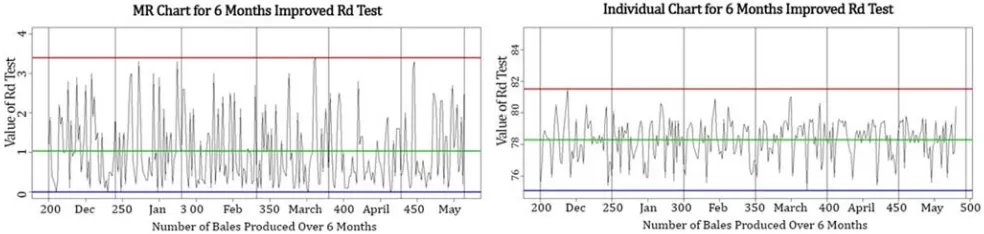
(a) MR Chart for Whiteness (Rd) Test (b) Individual Chart for Whiteness (Rd) Test
(c) MR Chart for Yellowness (+b) Test (d) Individual Chart for Yellowness (+b) Test
[image:14.595.67.559.108.225.2](a) MR Chart for SCI Test (b) Individual Chart for SCI Test Figure 7: MR and Individual Charts for Whiteness (Rd), Yellowness (+b) and SCI Test
Moving Range Charts Result Individual Charts Result
Topic UCL CL LCL UCL CL LCL
Whiteness (Rd) 3.392831 1.0385 0 81.50754 78.29381 75.08009 Yellowness (+b) 1.489884 .45604 0 81.50754 78.29381 75.08009
SCI 40.67692 12.450 0 185.8005 151.1104 116.4203
5. Conclusions
This paper presents the process of quality control in industrial sector that is done in Bangladesh. In this paper the target was to estimate the proper range of the parameters for the Weaving Mill to maintain statistical quality control. From the charts it is clear that the parameters of the thread are not completely in control. Hence upon applying Moving Range Chart and Individual Chart it can be concluded that for production to be of export quality the four parameters' value should have specific ranges. The suggested Range for Fiber Fineness, Whiteness, Yellowness and Spinning consistency index should be 3.162075 to 4.396583, 75.08009 to 81.50754, 6.953162 to 9.434838 and 116.4203 to 185.8005 respectively.
For further studies there could be a chance to compare with these processes with other quality control processes. Hence to determine a suitable process for garments industries, specifically weaving mills.
Reference list:
[1] A Majumdar, B Sarkar, and PK Majumdar. Determination of quality value of cotton fibre using hybrid ahp-topsis method of multi-criteria decision-making. Journal of the Textile Institute, 96(5):303-309, 2005.
[2] Alice E Smith. X-bar and r control chart interpretation using neural computing. The International
Journal of Production Research, 32(2):309-320, 1994.
[3] Betul Kan and Berna Yazici. The individuals control chart in case of non-normality. Journal of Modern
Applied Statistical Methods, 5(2):28, 2005.
16
[6] Emilija Kisic, Vera Petrovic, Miroslav Jakovljevic, and Zeljko DJurovic. Fault detection in electric power systems based on control charts. Serbian Journal of Electrical Engineering, 10(1):73-90, 2013.
[7] Khondoker Abdul Mottaleb and Tetsushi Sonobe. An inquiry into the rapid growth of the garment industry in Bangladesh. Economic Development and Cultural Change, 60(1):67-89, 2011.
[8] Mark Best and Duncan Neuhauser. Walter a shewhart, 1924, and the hawthorne factory. Quality and
Safety in Health Care, 15(2):142-143, 2006.
[9] Walter Andrew Shewhart. Economic control of quality of manufactured product. ASQ Quality Press, 1931.