NJF Report • Vol 3 • No 4 • Year 2007
NJF Seminar 405
Production and Utilization of Crops
for Energy
Vilnius, Lithuania, 25-26 September 2007
Nordic Association
A method to include machine manufacturing energy in energy balance
analysis
Ahokas J & Mikkola H.
University of Helsinki, department of Agrotechnology, PL 28, 00014 Helsingin yliopisto, Finland
1. Introduction
There is only some information available of indirect energy inputs of agricultural machinery i.e. energy consumption during machinery production and maintenance. Tractors as most other machines today consist of components which have been manufactured by subcontractors. This is why an energy analyses is a time consuming and troublesome duty, the information needed is scattered and hard to find. Energy use for repairs and maintenance is a still more challenging subject because after sale services contain mostly other energy consuming activities than manufacturing e.g. transports, packaging, storage and human work. Assessments made are based on an evaluation or on a monetary value of repair and maintenance activities.
A further problem is, how this energy should be allocated for biomass products.
Tractors and agricultural machines have their planned lifetime and there is no problem if the planned lifetime and real lifetime meet each other. The energy can be simply divided by the hours of the lifetime use. If machines are used less than what their planned lifetime is, a part of the manufacturing energy leaves unused and this should be taken into account in the analysis.
2. Manufacturing energy requirements
An energy analysis procedure should be used to define the energy needed to
manufacture agricultural machines. Unfortunately such analyses are not made, but the analysis of Berry & Fulton Fels (1972) from car industry proves to be the source of many reference chains (e.g. Bowers 1992, Conforti & Giampietro 1997, Ortiz-Cañavate & Hernanz 1999). Berry & Fulton Fels made an energy analysis of the manufacture, discard and reuse of the automobile and its component materials. The data was from the automobile industry in Chicago in 1967. A popular target of references in
steps of primary materials recovery, materials finishing and fabrication. They resulted that 37275 kWh primary energy was needed for the fabrication and transport of an average car which weight was 1563 kg, i.e. 85.9 MJ/kg. Some fifteen years later a life cycle assessment made in Carnegie Mellon University in 1998 evidenced that 86.6 MJ/kg was needed to manufacture a Ford Taurus of the year 1990 (MacLean & Lave 1998). A third example from the car industry is the environmental report of the Volkswagen factory, which showed that nearly the same amount of primary energy was needed to fabricate a Volkswagen Golf (Schweimer & Levin 2002). The energy consumption of the fabrication of a petrol model was 80.8 MJkg-1 and that of a diesel model 74.9 MJkg-1.
Any comparative analysis of the use of materials and energy for tractor and automobile manufacturing has not been made, but an energy analysis of car manufacturing process is certainly a good choice for tractor manufacturing energy calculations. Tractors have many heavy components made of cast iron while a car body is made of steel sheet. The share of synthetic materials should be nearly the same because tractors have big wheels, fuel tanks are mainly made of plastic, cabin surfaces have been upholstered like in cars.
3. Tractor manufacturing energy and fuel consumption
The direct energy demand (fuel consumption) of tractor usage is measured per working hour and it varies from work to work depending on the engine loading. In agricultural energy analysis's fuel consumption in field work has been normally given in units l/ha. This is a way to
simplify calculations, because different tractor and implement sizes do not have to take into account. If the tractor is optimal in relation to the power
requirement of the implement, the size of the tractor and
implement has only a minor affect on the fuel consumption per
[image:3.612.270.506.523.688.2]this reason it would be easier to tie the manufacturing energy also to the fuel consumption. To do this we must estimate the total fuel consumption of a tractor during its lifetime and divide the manufacturing energy with this. In this way we will get the proportion of manufacturing energy per consumed fuel consumption.
Tractor fuel consumption depends on the engine load and its working point. A good fuel economy is typically achieved with high torque and relatively low engine speed i.e. 55 -85% of the nominal engine
speed. Specific fuel consumptions curves show the efficiency of the tractor engine, Fig. 1.
In order to estimate the fuel
consumption of the tractor lifetime we need to know the mean engine power during the life time. This figure of course depends on the work done. In northern European conditions the
mean engine power has been 25-35 % of the nominal power and engine speed 50-70 % of the nominal speed (Traktoreiden ryhmäkoetus 1984). This corresponds typically to 227 – 240 g/kWh specific consumption. The lifetime fuel consumption can then be calculated with equation 1.
(1)
m l s f
q
T
P
V
=
⋅
⋅
In the equation 1 Vf is the total fuel consumption during lifetime, qs is the specific
mean consumption, Tl is the lifetime in hours and Pm is the mean engine power.
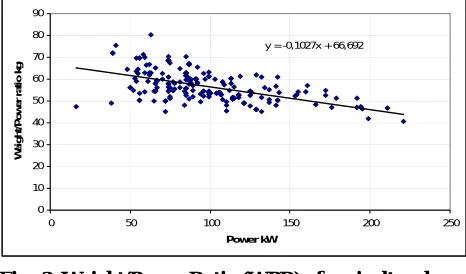
Manufacturing energy is given per weight, this can be changed to per engine power basis with weight per power ratio (WPR) figure, which is for tractors quite constant. The most popular power class in the Finnish market in 2002 was 81 - 100 kW, this corresponds to about 57 kg/kW weight/power ratio (WPR) Fig. 2. The mass based
manufacturing energy EmW can now be changed to engine power based energy EmP by
using equation 2.
y = -0,1027x + 66,692
10 20 30 40 50 60 70 80 90 200 250 W e ight /P ow er r a ti o k g 0
0 50 100 150
Power kW
[image:4.612.287.520.227.364.2]/
Fig. 2. Weight/Power Ratio (WPR) of a tractors gricultural
(2)
WPR
E
E
mP=
mW⋅
When the fuel consumption of the tractor lifetime is known, then the manufacturing
equation P
nis the nominal power of the tractor.
(3)
f n mP mE
V
P
E
q
=
⋅
We have typical fuel consumption figures for agricultural machine works (J. Ortiz-Canavate and J. L. Hernanz). When we calculate with these figures the manufacturing energy figures, the manufacturing energy is divided to different works according to their fuel consumption, i.e. it is divided by the energy consumption.
Conclusion
Manufacturing and also maintenance and repair energy demand is hard to find, there are only few research data available and this data seems not to be very reliable. Manufacturing energy demand can be calculated by estimating the mean tractor usage and calculating the manufacturing energy per consumed fuel liter. In this way it is easy to estimate the manufacturing energy, because it can be calculated with the liter/ha figures. Fuel consumption for different works in the form of liter/ha can easily be found in literature.
References
Berry, R. C. & Fulton Fels, M. 1972. The production and consumption of automobiles. An energy analysis of the Manufacture, Discard and Reuse of the Automobile and its Component Materials. A Report to the Illinois Institute for Environmental Quality, july 1972. 74 p.
Bowers, W. 1992. Agricultural Field Equipment. In: Stout, B. A. (ed.). Energy in World Agriculture. In: Fluck, R. C. (ed.). Energy in Farm Production, Vol. 6. Elsevier. pp. 117-129
Conforti, P. & Giampietro, M. 1997. Fossil Energy Use in Agriculture: An International Comparison. Agriculture. Ecosystems and Enviroment, Vol 65. pp. 231-243
Goering C. Engines. CIGR Handbook of Agricultural Engineering. Volume III. American Society of Agricultural Engineers, ASAE 1999. p. 41-54.
Maclean, H.& Lave, L. 1998. A Life-Cycle Model of an Automobile. Environmental Policy Analysis v.3 n.7 (1988), pp. 322A-330A.
Ortiz-Cañavate, J. & Hernanz, J. L. 1999. Energy for Biological Systems. pp. 13-24. In: Kitani, O., Jungbluth, D, Peart, R. M. & Ramdani, A. (eds.). Energy and Biomass Engineering. Vol V. In: CIGR – The International Commission of Agricultural
Society of Agricultural Engineers, ASAE 1999.
Pimentel, D., Hurd, L. E., Bellotti, A. C., Forster, M. J., Oka, I. N., Sholes, O. D. & Whitman, R. J. 1973. Food Production and the Energy Crisis. Science 2 November 1973: Vol. 182. no. 4111, pp. 443-449
Traktoreiden ryhmäkoetus. [Group test of tractors]. Valtion maatalouskoneiden tutkimuslaitos, Koetusselostus 1132. 65 p. (State Research Institute of Engineering in Agriculture and Forestry, Test Report 1132. 65 p.)
Whitman, R. J. 1973. Food Production and the Energy Crisis. Science 2 November 1973: Vol. 182. no. 4111, pp. 443-449
Rinaldi, M., Erzinger, S., & Stark, R. 2005. Treibstoffverbrauch und Emissionen von Traktoren bei landwirtschaftlichen Arbeiten. FAT-Schriftenreiche Nr. 65. 92 p.