Dominic Woolf January 2008
Biochar as a soil amendment:
A review of the environmental implications.
Introduction
The term 'biochar' refers to black carbon formed by the pyrolysis of biomass i.e. by heating biomass in an oxygen-free or low oxygen environment such that it does not (or only partially) combusts. Traditional charcoal is one example of biochar produced from wood. The term 'biochar' is much broader than this however, encompassing black carbon produced from any biomass feedstock. The use of biochar as a soil additive has been proposed as a means to simultaneously mitigate anthropogenic climate change whilst improving agricultural soil fertility. This paper provides a review of what is known about both of these claims and also about the wider environmental implications of the adoption of this process. The intention of this review is not just to summarise current knowledge of the subject, but also to identify gaps in knowledge that require further research.
Climate change is now widely recognised as a serious threat to both human society and natural ecosystems. The IPCC (Forster et al 20071, 131) state that “since 1750, it is extremely likely that humans
have exerted a substantial warming influence on climate”, where the term ‘extremely likely’ is defined to mean “with a confidence limit of 95% or greater”. If this anthropogenic warming trend continues, we may face impacts that are “abrupt and irreversible” (IPCC 20072, 13). And Stern (2007) concluded that the economic impact of climate change under a ‘business as usual’ scenario would exceed the combined cost of the great depression and the two World Wars.
Stern (2007) further
concludes that while the economic costs alone of continuing business as usual will amount to between 5% and 20% of global GDP every year, the cost of avoiding this by investment in mitigation strategies may be as little as 1% of GDP.
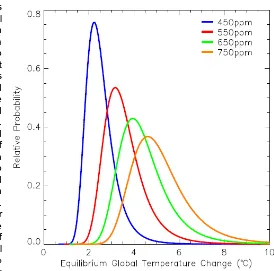
[image:1.595.232.506.357.628.2]It is becoming increasingly accepted that a limit of 2.0 °C above current global mean temperature represents an upper bound upon the temperature rise we can allow before
we face an unacceptable risk of incurring dire consequences (Commission Of The European Communities, 2007). As the graph in figure 1 shows (data from Hadley centre for climate prediction and research, reproduced from King, 2007), even if we manage to stabilise atmospheric CO2 concentration at 450 ppm, it is far from certain (approximately 20% probability of success) that this limit will not be exceeded in time. However, since time lags in reaching equilibrium temperature are long (in the order of centuries), it is more common amongst policy makers to discuss the measures required to keep climate within safe bounds this century, in the hope that longer timescales will allow us greater latitude in the development and deployment of novel mitigation and adaptation measures.
In a study of the long-term (500 years) implications of various greenhouse gas emission scenarios, Weaver et al (2007) concluded that a minimum of 60% global reduction in emissions by 2050 will be needed to keep temperature rises this century below the 2.0°C threshold “that some have argued represents an upper bound on manageable climate warming”. However, Weaver et al (2007) also found that even if emissions are stabilised at 90% below current levels by 2050, the 2.0°C temperature rise will still be exceeded eventually. They argue therefore that “if a 2.0°C warming is to be avoided, direct CO2 capture from the air, together with subsequent sequestration, would eventually have to be introduced in addition to sustained 90% global carbon emissions reductions by 2050”.
But how might this direct capture from the air and sequestration of CO2 be achieved? Most of the proposed methods of carbon capture and storage (CCS) are aimed at capturing CO2 directly from exhaust emissions before they have entered the atmosphere (IPCC 2005). As such, they can be considered as strategies to reduce emissions rather than to remove CO2 from the atmosphere. There is one exception to this - where CCS is used to capture and sequester CO2 emissions from biomass combustion. In this case, the complete system, including photosynthesis to provide the biomass, becomes a net carbon sink. Rhodes and Keith (2003) calculate that biomass energy with CCS could produce competitively priced electricity once carbon emission prices exceed 54.5 US $/tCO2. Obersteiner et al (2001) estimate that between 240 to 450 GtC from biomass energy conversion could potentially be available for capture and storage over the course of the century (based on the IPCC SRES scenarios). This is equivalent to in the order of 35% of the cumulative emissions in the scenarios considered.
At present, few other plausible methods for the large scale removal of CO2 from the atmosphere are known: one possibility is to increase the size of the earth’s biomass carbon pool (for example by reforestation, reduced tillage or other land-use changes); a second is fertilisation of oceans; and a third is the production and sequestration of biochar.
carbon sequestered in forests can be rapidly returned to the atmosphere by fire or a resumption of deforestation, and soil carbon stocks accumulated by reduced tillage can be quickly lost by a resumption of tillage.
The ease with which soil organic carbon stores may be lost is highlighted by a study of the National soil Inventory of England and Wales over the period from 1978 to 2003 which showed an average loss rate of soil carbon of 0.6 %yr-1, and a loss rate as high as 2%yr-1 in high carbon soils (Bellamy et al 2005). Bellamy et al (2005) suggest that these losses of soil carbon may be attributable to climate change as they occur across both England and Wales independently of land use. This conclusion is questioned, however, by Smith et al (2007) who calculate that it is physically implausible that observed temperature rises alone could account for more than 10-20% of this carbon loss. Smith et al (2007) suggest four other possible mechanisms that may account for the loss in agricultural soil carbon: reduced spreading of animal manure, increased removal of agricultural residues, deeper ploughing, and possible legacy effects from pre 1978 changes in land use. Smith et al (2007) also suggest some possible mechanisms to account for carbon losses from organic soils (such as peat bogs) such as lowering water table, recovery from acidification, enhanced atmospheric nitrogen deposition, or increased use of muirburn.
In addition to terrestrial ecosystems, ocean ecosystems may also provide possibilities for enhanced carbon sinks. There is a downward export of carbon in the oceans (sometimes referred to as “the biological pump”) due to the sinking of biologically derived organic matter (Boyd and Trull, 2006). Currently, the biological pump transfers between 5 – 15 GtCyr-1 to the deep sea (Falkowski et al., 1998). It has been proposed that fertilisation of the ocean to encourage phytoplankton growth may enhance the rate at which this process of organic carbon deposition occurs, and thus provide a useful means to remove atmospheric CO2 (Martin et al, 1990).
One method by which this might be economically achieved is the use of iron fertilisation. Iron fertilisation of the oceans relies on the fact that large areas of ocean exist which are rich in macronutrients, yet a lack of the micronutrient iron is the limiting factor in the growth of phytoplankton (Coale et al 2004). Models predict that if all of the unused N and P in Southern Ocean surface waters were converted to organic carbon over the next 100 years (an unlikely extreme), 15% of the anthropogenic CO2 could be hypothetically sequestered (Chisholm et al 2001).
Another possible method to enhance phytoplankton growth has been suggested by Lovelock and Rapley (2007), which is to place vertical pipes in the ocean that utilise wave energy to pump cooler nutrient-rich water up to the surface where it will encourage algal blooms.
Aside from sequestering carbon, enhanced phytoplankton productivity may have another, possibly greater, effect on the climate by increasing emissions of dimethyl sulphide (Wingenter et al 2007). Increased dimethyl sulphide concentrations in the atmosphere may lead to an increase in cloud condensation nuclei, that in turn will lead to smaller cloud droplet size, an increase in cloud reflectivity, and thus a cooling effect on the climate (Charlson et al, 1987).
potential for harmful side-effects such as hypoxia, the growth of toxic algae, or the confiscation of nutrients from downstream ecosystems (Shrope 2007, Chisholm 2001), it was agreed at the recent London Convention that large-scale eutrophication of the oceans should be treated with utmost caution and is not yet justified (Schiermeier 2007).
It would appear, then, that removal of excess CO2 from the atmosphere will form an important part of an overall climate change mitigation strategy alongside a portfolio of measures to reduce greenhouse gas emissions. Furthermore, it would appear that strategies such as enhanced net primary production of the terrestrial biosphere (for example by afforestation) and enhanced carbon deposition in oceans by fertilisation may not alone be up to the task of wholesale removal of atmospheric carbon. So, let us now turn our attention to another strategy by which removal of atmospheric CO2 might be achieved – the production and sequestration of biochar.
1. The Carbon Cycle
There are two main ways that biochar can influence the global carbon cycle. The first is that, if biochar is produced from material that would otherwise have oxidised in the short to medium term, and the resultant carbon-rich char can be placed in an environment in which it is protected from oxidation, then it may provide a means to sequester carbon that would otherwise have entered the atmosphere as a greenhouse gas. The second is that gaseous and liquid products of pyrolysis may be used as a fuel that can offset the use of fossil fuels.
1.1. Carbon sequestration
It has been suggested by numerous authors (see for example Sombroek et al 2003, Lehmann 2006) that the use of biochar as a soil additive meets the requirements specified above that the char be protected from oxidation, and that it may be produced from material that would otherwise have degraded to release carbon dioxide into the atmosphere. Despite this, the carbon sequestration potential of adding biochar to soils has been widely overlooked. Freibauer et al (2004), for example, make no mention of it in their review of the potential for sequestration in European soils. Neither has provision been made under the Kyoto Protocol for carbon sequestered in this manner.
To assess the carbon sequestration potential of adding biochar to soil, we must consider four factors: the longevity of char in soil; the avoided rate of greenhouse gas emission; how much biochar can be added to soils; and how much biochar can be produced by economically and environmentally acceptable means.
1.1.1.Stability of biochar in soils
If biochar is to be useful for the purposes of sequestering carbon, it is necessary that it must be long-lived and resistant to chemical processes such as oxidation to carbon dioxide or reduction to methane.
sediments”. Large accumulations of charred material with residence times in excess of 1000 years have also been found in soil profiles (Forbes et al 2006, Glaser et al 2001, Saldarriaga, et al 1986). Glaser et al (2003) attribute the presence of large stocks of pyrogenic black carbon in Amazonian dark earths, several hundred years after the cessation of activities that added it to the soil, to its chemical recalcitrance. Also, 14C ages of black carbon of 1000 to 1500 years from Amazonian Dark Earths suggest that it is highly stable (Glaser, 1999). Deposits of charcoal up to 9500 have been found in wet tropical forest soils in Guyana (Hammond et al, 2007), up to 6000 years old in Amazonia (Soubies 1979), and up to 23,000 years old in Costa Rica (Titiz & Sanford, 2007).
The conclusion that BC is long-lived is supported by Bird and Gröcke (1997) who found that a component of charred material is highly oxidation resistant under laboratory treatment both with acid dichromate and basic peroxide. The fraction of biochar that will exhibit such oxidation resistance will of course depend upon both the feedstock and pyrolysis conditions.
These observations do not, however, rule out the possibility that char may decompose more rapidly in other environments. Indeed there is evidence that it may do so.
Masiello (2004) argues that there must be some, as yet unknown, large scale loss process for black carbon. Firstly, there is a discrepancy between known rates of black carbon production and loss. Kuhlbusch (1995) estimates annual BC production to be 0.05-0.27 Gt/year. The rate at which organic carbon is deposited to the sea floor on the other hand is estimated at 0.16 Gt/year (Hedges & Keil, 1995). According to Masiello (2004), “the only documented loss process for BC is deposition in ocean sediments”. This implies, according to Masiello, that BC should account for at least 30% of sedimentary organic carbon, whereas it is only observed to provide about 3 – 10%. Furthermore, at least some of this sedimentary BC is thought to come from petrogenic graphite adding to the discrepancy between terrestrial rates of production and sedimentary loss of BC. So, if BC is not being removed from the soil as fast as it is being produced, might it simply be accumulating there? According to Masiello (2004), this possibility is also ruled out by a calculation of how much BC there would be in the soil organic carbon pool assuming it had been produced at current rates since the last glacial maximum. Masiello (2004) calculates that this would imply between 25 – 125% of total soil organic carbon would be BC which, Masiello (2004) states, is implausibly high even if we take the lower limit and account for losses by erosion. Stallard (1998) offers a possible explanation for this discrepancy between the rate of production of BC and the rate at which it is deposited in ocean sediments. According to Stallard (1998, 231), “The terrestrial sediment cycle is not in equilibrium. Agriculture, civil engineering, and mining mobilize vast quantities of soils, unconsolidated sediment, and bedrock, perhaps more than all natural geomorphic processes combined.” Stallard (1998, 232) goes on to state that “Much of this sediment is stored in a variety of deposits, often near the site of erosion, and does not get to the ocean.” Whilst the precise amount of carbon thus buried in terrestrial sediments can not be known “without considerable additional work”, Stallard (1998) calculates that human-induced burial of 0.6 - 1.5 Gt C yr-1 is entirely plausible.
fire compared to the amount that might be expected to have been produced. They offer a number of hypotheses to explain this discrepancy, including either a low conversion of OC to BC in the fire; or BC losses due to erosion, translocation within the soil profile and degradation. Of particular interest here is the possibility that the BC was lost by degradation. Two possible mechanisms for this suggested by Czimczik et al (2003) are oxidation by subsequent fires or by microbial action.
Both of these possible loss mechanisms should be of concern to us. If fire is able to oxidise a large percentage of the black carbon in underlying soils, then we should be cautious about deploying biochar in either forestry soils or in arid regions. If microbial action is able to oxidise char, we need to know what microbes can achieve this, the mechanism by which it occurs, and under what conditions and at what rate this will take place. Waldrop (2007) of the US Geological Survey states “Black carbon, resulting from the oxidation of wood and forest floor carbon following wildfire, is thought to be largely biologically unavailable, but this has not been thoroughly examined. Utilizing 13C isotope
techniques, I am determining whether black carbon can be decomposed by soil organisms, whether the extent of decomposition is affected by microbial species, and whether the mechanism of action is via extracellular oxidative enzymes”. Should microbial oxidation of char arise as an epiphenomenon from extracellular microbial secretions, then it is unlikely that there will be an evolutionary pressure to exploit the widespread availability of biochar. If, however, there are micro-organisms that can utilise char as either an energy or carbon source, then the creation of large reserves of soil biochar may create an ecological niche that evolution can exploit. In a study on the effect of glucose on microbial decomposition of black carbon in soils, Hamer et al (2004) found that “apparently, some microorganisms were able to live with BC as sole C source”. In the same study, Hamer et al (2004) found that BC in soils may enhance the rate of decomposition of labile C compounds.
It is worth noting that the longevity of BC in soils cannot be characterised by a single number. Pyrogenic BC is not a homogeneous substance (Hedges et al, 2000), and different fractions of it will decompose at different rates under different conditions. As Preston & Schmidt (2006) say, “Except for anoxic peats or permanently frozen soil, the high end for the half-life of PyC may be expected to be in the kY region (maybe 5–7 ky), for cold, wet environments, and for the PyC fraction with more recalcitrant structure. At the other extreme, a half-life in the order of 100 y (Bird et al., 1999) may be not unrealistic for some fraction of PyC from boreal wildfire, with less thermal alteration and especially with surface exposure (unpublished field observations from Canadian and Siberian boreal forest sites)”.
accumulations of BC in some soils and BC resistance to chemical oxidation, suggests that black carbon is stable over at least such a timescale. Nonetheless, considerable uncertainties remain about just how fast biochar may decompose under different soil conditions. The rate at which biochar may decompose in any conditions in which its use is contemplated for the purpose of carbon sequestration must be established beyond doubt before we may gamble the future climate upon this uncertainty.
1.1.2.At what rate would carbon have entered the atmosphere had it not been converted to char?
It is generally the case that technologies intended to reduce greenhouse gas emissions will have an upfront cost in terms of money, energy and carbon emissions that will only be recouped over time. For example, the construction of a wind farm may involve large carbon dioxide emissions to produce cement for the foundations. This upfront cost will we paid back over time as electricity from the wind farm offsets production from fossil fuels. A similar logic applies to biochar production. The initial pyrolysis process will produce carbon dioxide. This initial carbon cost will be recouped over time as it offsets the carbon dioxide (and possibly methane) emissions that would have occurred if the biomass had instead decomposed or been oxidised by other means. How quickly this greenhouse gas payback occurs will depend upon the rate at which the biomass would have released greenhouse gases were it not pyrolysed.
We can illustrate this with a simple model.
If we assume that the rate of decomposition of biochar is negligible, then the total amount of avoided CO2 emissions as a function of time is given by
where,
DecompCO2rate = the rate at which CO2 would have been produced if the biomass were allowed to decompose,
PyroCO2 = the amount of CO2 released by pyrolysis, t = time
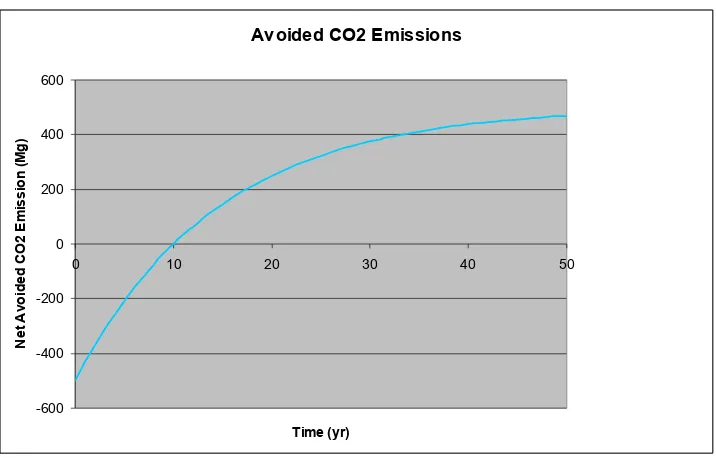
For illustrative purposes only, let us make the simplifying assumption that the rate of decay of biomass follows an exponential decay curve. Making the further assumption that 50% of the carbon in the biomass is released as CO2 during pyrolysis, we can plot the CO2 emissions as a function of time for both pyrolysis and biomass decay. Figure 2 shows such a plot for 1000 Mg of biomass with a decay half-life of 10 years. Figure 3 then shows the avoided CO2 emissions as a function of time (using equation 1).
2 2
2 0DecompCO rate.dt PyroCO
Figure 2: CO
2emission rate for decomposition / pyrolysis of
1000 Mg of biomass
Figure 3: Avoided CO
2emission by biochar production
In this case, since we assumed that half of the carbon content of the biomass was released during pyrolysis, the carbon emission break-even point occurs at the half-life of the biomass decay curve i.e. once decay processes would also have released half the original carbon content. Before this time, biochar production has led to an increase rather than a decrease in carbon dioxide emissions into the atmosphere.
CO2 Emission Rate
0 200 400 600 800 1000 1200
0 10 20 30 40 50
Time (yr) C O 2 e m is si o n ( M g /y r) Decomposition Pyrolysis
Avoided CO2 Emissions
-600 -400 -200 0 200 400 600
0 10 20 30 40 50
[image:8.595.137.495.384.613.2]It is quite apparent from this simplified analysis that the rate at which any biomass feedstock would have decayed had it not been pyrolysed is a critical factor in determining the usefulness of biochar production in climate change mitigation in the short term. If we wish to achieve an 80% reduction in greenhouse gas emissions by 2050, then we cannot really expect the pyrolysis of feedstocks that have an expected half-life much beyond decadal timescales to aid us in achieving these targets. Moreover the pyrolysis of feedstocks that have significantly longer life expectancies (for example woodlands or plastics) would be highly detrimental to achieving carbon dioxide emission reduction targets by mid-century. More detailed analysis will be required in order to comprehensively evaluate the net greenhouse gas emissions as a function of time for different potential feedstocks. Our cursory analysis however strongly suggests that we should limit ourselves to the use of fast-cycling carbon pools for the provision of biochar feedstocks.
1.1.3.
How much biochar can be added to soil?The amount of biochar that can be added to soils before it ceases to function as a beneficial soil amendment and becomes detrimental will be the limiting factor in the use of biochar as a soil additive. The strongest evidence that high concentrations of black carbon in soil may be beneficial under some conditions comes from the Amazonian Dark Earths (ADEs) such as terra preta and terra mulata – charcoal rich soils which contain approximately three times more soil organic matter, nitrogen and phosphorus than adjacent soils and have twice the productivity (Glaser, 2007). A hectare of terra preta can contain up to 250 Mg of soil organic carbon (SOC) in the top 30cm (compared to 100 Mg in unimproved soils from similar parent material), and up to 500 Mg ha-1 in the top 1m (Glaser, 1999). Of this total SOC, as much as 40% may be black carbon (Lehmann, 2007), though the mean value in the most charcoal rich layer - the top 40cm - is around 20% (Glaser 2001).
The mean total amounts of black carbon found in terra preta soils were 25±10 Mg ha-1and 25±9 Mg ha–1at 0–30 cm and 30–100 cm soil depths, respectively
(Glaser 2001). These values do not necessarily represent a ceiling on how much black carbon may be beneficially added to soils. Indeed, Lehmann et al (2003) found that cation exchange capacity (CEC) of ADEs increased linearly with increasing SOC – a trend that continued up to the highest SOC values studied. Lehmann et al (2007), report increasing yields with increasing biochar applications of up to 140MgCha-1 (at which rate, the maximum yield had not yet been reached) on highly weathered soils in the humid tropics, for most of their tests. This was not true for all crops however – Rondon et al (2004) found that biomass growth of beans (Phaseolus vulgaris L.) rose with biochar applications up to 60MgCha-1 but fell to the same value as for control plots when biochar application was increased to 90MgCha-1 (although yield of beans still increased). Lehmann et al (2007) conclude that “crops respond positively to bio-char additions up to 50MgC ha−1 and may show growth reductions only at very high applications.”
carbon, it is imperative that its effects in all major agricultural soil types be investigated. Biochar addition at 140MgCha-1 to the 1600 Mha of cropland and 1250 Mha of temperate grass lands globally would result in a total of 400 Pg of carbon sequestration potential (Lehmann, 2007). This is approximately 50 times the current anthropogenic carbon emissions of 7.8 PgCyr-1 (Marland et al 2006). There is no absolute reason that use of biochar need be limited by the ratio at which it can be added to the A soil horizon. It may under some circumstances also be both desirable and practical to add charcoal to lower horizons. An extreme example is a proposal (Radlein, 2007) to fill entire valleys with biochar, covering this with a layer of topsoil. There may be other possibilities though, that are more useful and less devastating to the landscape. For example, biochar might be used for the terracing of sloping agricultural land or for raising ground level in flood zones. It is not envisaged that such uses of biochar will become widespread in the near future. Nonetheless, if faced by catastrophic, ‘abrupt and irreversible’ climate change, ambitious responses may become appropriate.
1.1.4.How much biochar can be produced?
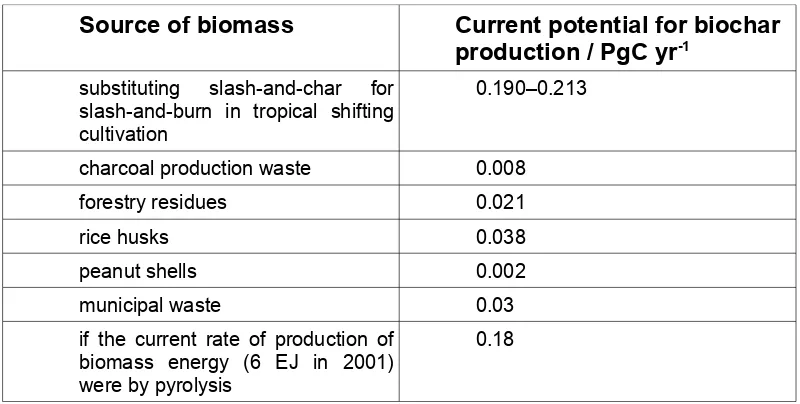
Lehmann et al (2006) estimate that the current global potential for biochar production is 0.6 ± 0.1 PgCyr−1 rising to 5.5 – 9.5 PgCyr−1 by 2100 (comparable to current total anthropogenic carbon emissions from fossil fuels and cement production, estimated by Marland et al (2006) to be 7.8 PgCyr−1).
The breakdown of Lehmann et al’s (2006) calculation of current potential is shown in Table 1 below.
Source of biomass
Current potential for biochar
production / PgC yr
-1substituting slash-and-char for slash-and-burn in tropical shifting cultivation
0.190–0.213
charcoal production waste 0.008
forestry residues 0.021
rice husks 0.038
peanut shells 0.002
municipal waste 0.03
if the current rate of production of biomass energy (6 EJ in 2001) were by pyrolysis
[image:10.595.98.498.403.605.2]0.18
Table 1: current biochar production potential (from Lehmann et al , 2006)
From this list, we can ignore charcoal production waste as a means of sequestering carbon, as this is an existing production of char – simply adding this char to soils will not create a new carbon sink, although it may have other benefits. Of the other sources, shifting cultivation and biomass energy account for over 80% of the total.agricultural residues may be seriously underestimated as they consider only rice husks and peanut shells – as they state, “actual values including all possible waste materials not listed here may be significantly higher.” Lal (2005) estimates the world production of crop residues to be 4x10⁹Mgyr-1. Taking a mean carbon content of 48% (see section 1.2.1) and a pyrolysis yield of 48% of this carbon in the char (Lehmann et al 2006, 413) this translates to a maximum possible 1PgCyr-1 from crop residues. The actual potential will be lower than this, as not all crop residues will be suitable or recoverable, some of this total biomass will be required for incorporation into soil, and there will other competing demands for useful residues such as straw.
Another notable omission from Lehmann et al’s (2006) estimates is sewage sludge which was not discussed because it “may contain heavy metals or organic pollutants that pose the challenge of environmental contamination” (Lehmann et al 2006, p405). Shinogi et al (2003) found, however, that biochar produced from sewage sludge in Japan did not show harmful levels of heavy metals. Further research will be required to investigate the possibility of using sewage sludge in different locations as its level of contamination may be quite variable at different locations and at different times. Over the course of time, it may be possible to develop the necessary infrastructure and social practices to make collection of ‘clean’ sewage for biochar production a possibility.
Lehmann et al's (2006) figure of 5.5 – 9.5 PgCyr−1 biochar production by 2100 is almost entirely accounted for by dedicated cropping for biomass energy, and is based on a projected 180–310 EJyr−1 biomass energy production (from Berndes et al, 2003). The true potential for global biomass energy production is a highly debated topic. At the high end of estimates, Smeets et al. (2007) calculate that, ultimately, energy cropping on current agricultural land could produce 1.5 x 10³ EJyr-1 without jeopardizing the world’s food supply. This calculation assumes that all agriculture uses the highest yielding industrial agriculture systems possible (including high levels of irrigation) with projected increases in agriculture productivity of 25% above today's values (through technologies such as genetic modification to increase yield index). The greatest increase in yield per acre in Smeets et al (2007) comes from the replacement of all pastoral livestock with landless livestock. Smeets et al (2007) do not consider how much of the biomass energy thus made available will be required to supply their highly industrialised food production system, nor do they consider whether there is sufficient water availability for all the irrigation they assume. It is also worth noting that although the analysis of Smeets et al (2007) assumes no deforestation, it does not afford such protection to other wild areas such as grasslands, which it is assumed will be brought into production. At the other end of the debate on how much biomass production is possible, Sims et al (2006), using more conservative dry matter and energy yield estimates and an assessment of the impact on non-CO2 greenhouse gases, estimate the realistically achievable potential for energy crops by 2025 to be between 2 and 22 EJ yr−1,
damage by greenhouse gas emissions has been internalised into the carbon market, the market might be left to decide the most efficient allocation of these biomass resources. There are some problems with this approach though – notably that this model assumes that people have complete information about the various options, and that they will behave in a rational manner to maximise the benefit that can be obtained from these resources. There is considerable evidence however (see for example Basu 1994), that people do not act in a purely rational manner in economic decisions. It is often the case that people will act in a way to maximise short term benefits at the expense of longer term costs only to regret this decision later on. This tendency is exacerbated by the fact that we do not have perfect information about the future. A relevant example of this may be found in the current impetus to deal with the waste disposal problem. There is considerable political pressure at present, embodied for example in the EU Landfill Directive (1999, Directive 99/31/EC), to divert waste away from landfill. As a result, it is likely that a considerable infrastructure of anaerobic digesters and composting facilities will be built over the next few years (‘More than Waste’ , 2007) before the option of biochar pyrolysis has been properly investigated. Even if biochar production should prove to be a superior option, once large capital investment in alternative facilities has been made, most large biomass waste streams may already be tied into long term supply contracts, precluding the option of processing them into biochar for many years.
1.2. Biomass energy production
1.2.1. Co-production of biochar and energy
It is possible to obtain energy or fuels at the same time as producing biochar. A number of plants are already under development to produce liquid / gaseous fuels by pyrolysis of biomass that produce biochar as a by-product. For example BEST energies Inc. (www.bestenergies.com) have a slow pyrolysis system that converts biomass to syngas and 35 wt% char. Dynamotive use a fast pyrolysis process for the production of liquid biofuel, with yield of 60-75 wt% oil, 15-20 wt% char and 10-20 wt% gases. “BioOil and char are commercial products and non-condensable gases are recycled and supply a major part of the energy required by the process” (http://www.dynamotive.com/en/technology/index.html accessed 10/12/07).
Since pyrolysis requires heat, at least some of the energy in the product streams of the process will be required to drive the reaction. We can calculate the maximum amount of energy that may be available from biomass pyrolysis from the enthalpies of combustion of the biomass feed and of the biochar product using equation 2, where Higher Heating Value (HHV), is defined as the enthalpy of complete combustion of a fuel including the condensation enthalpy of the formed water.
Maximum energy from pyrolysis = biomass HHV – (char HHV * char yield) Eq. (2)
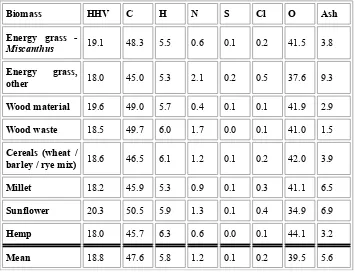
(Demirbas, 2001). Table 4 gives us the HHV of a range of chars (Demirbas, 2001).
Table 2:
mass % (in dry sample) of C, H, N, S, Cl, O, and ash in
dif-ferent types of biomass; and HHV in MJ/kg (Friedl
et al,
2005).
Biomass HHV C H N S Cl O Ash
Energy grass -
Miscanthus 19.1 48.3 5.5 0.6 0.1 0.2 41.5 3.8
Energy grass,
other 18.0 45.0 5.3 2.1 0.2 0.5 37.6 9.3
Wood material 19.6 49.0 5.7 0.4 0.1 0.1 41.9 2.9
Wood waste 18.5 49.7 6.0 1.7 0.0 0.1 41.0 1.5
Cereals (wheat /
barley / rye mix) 18.6 46.5 6.1 1.2 0.1 0.2 42.0 3.9
Millet 18.2 45.9 5.3 0.9 0.1 0.3 41.1 6.5
Sunflower 20.3 50.5 5.9 1.3 0.1 0.4 34.9 6.9
Hemp 18.0 45.7 6.3 0.6 0.0 0.1 44.1 3.2
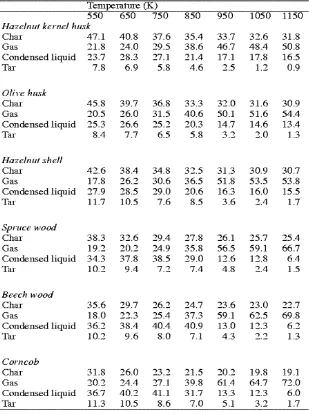
Table 3. Yields (mass %) of gas, char, tar and condensed liquid from the biomass samples at carbonization temperatures (Demirbas, 2001).
[image:14.595.139.513.610.710.2]The following calculations are based on a biochar HHV of 29 MJkg-1 (the mean value of chars produced at 675K), and on the mean biomass HHV of 19 MJkg-1. If we assume that the process is optimised for a high yield of char (say 45% - i.e. close to the maximum char yield in table 3), then this gives us a maximum possible energy production from pyrolysis of 6 MJkg-1 (or 32% of the biomass HHV). If, however, the pyrolysis is optimised for greater energy recovery with lower char yield (say 20% as in the Dynamotive process), then the maximum energy output per kg of feedstock becomes 13 MJkg-1 (or 72% of the biomass HHV). An intermediate yield of char of 35% (commensurate with BEST energies’ value) gives us an maximum energy output of 8.7 MJkg-1 (46% of biomass HHV). As this demonstrates, there is a competition between optimising for either maximum energy or char production. As discussed in 1.2.2 below, a greenhouse gas mitigation strategy would in most cases favour optimisation for maximum char. Whether economics and engineering will also favour this strategy is a subject for further study.
In practice, engineering losses will likely reduce the achievable energy recovery below these theoretical maxima. How much energy may in practice be recovered from the pyrolysis process will depend on many engineering constraints and is beyond the scope of this report.
1.2.2. Competition between biochar and biomass energy production
As noted in 1.1.4 above, one factor determining how much biochar may be produced is the existence of competing demands for biomass feedstock. Once environmental costs of carbon-based greenhouse gas emissions have been suitably internalised, we can expect market forces and the price mechanism to be the dominant factor in apportioning use of biomass resources between competing demands. However, as Fowles (2007, 429) notes, “when the alternative uses of biomass are likewise aimed at carbon reduction, the trade-offs become more complex”. Perhaps the most important example of this dilemma arises from the trade-off between using biomass for energy generation and using it to produce biochar.
generation from coal, then the reduction in carbon emissions will be greater for bioenergy generation than for biochar sequestration.
When it comes to evaluating specific projects, a more detailed analysis will be needed that takes account of more factors such as the energy costs of transport and processing, and whether any energy co-production with biochar is feasible. Despite ignoring such factors, Fowles’ analysis seems robust as a general guideline, since energy requirements for transport and processing may not differ considerably between use of biomass for energy or biochar, and any energy co-production will shift the balance further in favour of biochar.
Perhaps the weakest aspect of Fowles’ analysis is that he neglects the possibility of combining CCS with biomass energy. Where this option is economically and technically feasible, it has the potential for a greater reduction in atmospheric CO2 than biochar production as it may simultaneously sequester a greater proportion of the biomass carbon than biochar whilst also offsetting a greater amount of fossil fuel use.
2. Non-CO
2Greenhouse gases
2.1. Emissions from soils
In addition to CO2 abatement, emissions of other greenhouse gases from soil may also be reduced. Rondon et al (2005) found a reduction in nitrous oxide emissions of 50% from soy bean plots and almost complete suppression of methane emissions from soil by adding biochar at a rate of 20 Mgha-1 to acid soil savannah in the Eastern Colombian Plains . According to Lehmann et al (2007), “these low emissions may be explained by better aeration (less frequent occurrence of anaerobic conditions) and possibly by greater stabilization of C. The lower nitrous oxide evolution may also be an effect of slower N cycling”. Further study will be required to ascertain the precise mechanism to account for these lower emissions and under what soil conditions we can expect it to occur.
2.2. Indirect GHG emissions
According to Crutzen et al (2007),direct emissions of N2O from fields represent only a small part of the total conversion of applied mineral nitrogen fertilizers to N2O. Direct measurements from fields show that about 1% of applied nitrogen is emitted from fields in the form of N2O, whereas global measurements indicate that the total figure is 4+/-1% (Crutzen et al 2007), indicating that a greater amount of the N2O emission occurs downstream once soluble nitrates have left the soils to which they were applied. If this is so, then the IPCC (2006) underestimates the contribution of nitrogen fertiliser to GHG emissions by a factor of 3-5 (the IPCC, 2006, use a figure of 1%). This would more than negate any benefit that biofuels such as rapeseed biodiesel or ethanol from maize might have in offsetting fossil fuel use, as the conversion of fertiliser used to grow these crops to N2O would cause a net increase in GHG emissions (Crutzen et al 2007).
3. Land use
As Mark Twain said, "The problem with land is that they stopped making it some time ago". With global human population already at 6.6 billion and growing (CIA, 2007), and with a total ecological footprint already 1.3 times the world’s carrying capacity (Global Footprint Network 2007), productive land is a scarce resource, and is set to become more so. Balancing land requirements for food, biofuel, fibre, timber, soil organic carbon, biodiversity and ecological services will become increasingly challenging. So, where might biochar fit into this balancing act? Will it be another competing demand on land use, or will synergies between biochar and other land uses mean that biochar can help us to fulfil these needs?
The most obvious potential for competition will occur in the case of dedicated cropping for biochar. In this case, land used for biochar production will be
unavailable for other uses. According to Nilsson and Fischer (2007), once we take into account land that is biologically unproductive, built-up, forested, protected, already cultivated, or excessively steep, then there is insufficient remaining land to meet projected demands for food, fuel and fibre by 2030. Nilsson and Fischer (2007) calculate that in total there may be an additional 250-300 million ha of land that can be brought into production, but that this must be apportioned between land
requirements for projected increases in food (200 million ha), biofuels (290 million ha) and forestry (25 million ha). If this is the case, then it may be hard to find land that can be dedicated to biochar cropping. Moreover, if food production is given priority, then there may be insufficient land for biofuel production even if these biofuels were to be produced by pyrolysis with a biochar by-product that can be returned to the soil. These problems may be ameliorated by increased agricultural yields per acre due to biochar production. How much so depends on how much yields may be increased, and also on how much otherwise unproductive land might be brought into crop production through the use of biochar amendment – further research will be required before we can put firm figures on these values.
If, instead of dedicating land to biomass production, we were to utilise agricultural and forestry residues for biochar (with or without co-production of energy) there is still a competition between this and the need for bio-available soil organic carbon to support soil biota, maintain soil quality and to combat erosion. Lal (2005) claims that “even a partial removal (30–40%) of crop residue from land can exacerbate soil erosion hazard, deplete the SOC pool, accentuate emission of CO2 and other GHGs from soil to the atmosphere, and exacerbate the risks of global climate change”. These conclusions do not necessarily follow, however, if biochar is subsequently returned to the soil. In this case, the SOC pool will increase and GHG emissions fall. Some of the crop residue will still have to be incorporated directly into the soil to provide a food source for soil biota and to reduce erosion. It may be that increased mycorrhizal fungi in the soil as a result of biochar amendment (section 4 below) will provide increased bioavailable SOC without the need for as much plant debris to be
incorporated. This remains to be proven though. What percentage of crop residues can reasonably be extracted when biochar is being returned to the soil will likely vary with local conditions, and is a matter for further research.
increasing the over-consumption of food that has led to the one billion people who are overweight outnumbering the 800 million that are hungry (Patel 2007). Thus, we may be able to limit increasing demand for food by tackling
over-consumption. Also, if cultural preferences for particular food types can be altered, there may also be considerable scope for optimising land use through increasing adoption of agroforestry practices (Swaminathan 1987, Wallace 2000, Tilman et al 2002, Lal 2004).
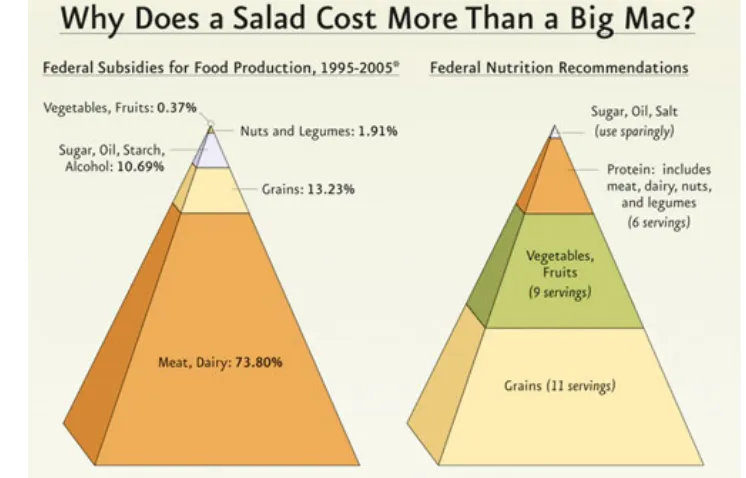
Perhaps the most important change we could make, though, would be to alter the balance of different food types that we produce. This is highlighted by Figure 4 (Physicians Committee for Responsible Medicine 2007) which juxtaposes nutritional recommendations for what we should eat against what farmers are encouraged to produce and what people are encouraged to eat through the manipulation of the price signal by farm subsidies (in the USA).
[image:18.595.104.477.286.525.2]The emphasis of subsidies towards meat and dairy products compared to the relatively small part of a healthy diet they are recommended to provide is striking. Globally, livestock uses 30% of all land area (barren desert, polar areas, and high mountain areas account for another 40-45%), 70% of agricultural land, and it is responsible for 18% of total GHG emissions (FAO 2007). In the US, livestock are responsible for 55% of erosion and sediment, and in the Amazon, “70% of previously forested land is occupied by livestock, and feedcrops cover a large part of the remainder” (FAO 2007, xxi). Given these statistics, it is hardly surprising that the FAO (2007, xxiv) conclude that “the livestock sector has such deep and wide-ranging environmental impacts that it should rank as one of the leading focuses for environmental policy: efforts here can produce large and multiple payoffs”.
In a recent report published by the Centre for Alternative Energy (CAT 2007), considering how Britain might move towards a low carbon economy, it is noted that “Despite historical preferences, Britain’s citizens are unlikely to spend their entire carbon allowances on beef, mutton and cheese. It is inevitable that the number of ruminants will be greatly reduced. This implies a significant move away from permanent pasture, and a freeing of large land areas for other purposes”. If a large reduction in livestock numbers can indeed be made politically and socially
acceptable, then the land freed up would indeed make the job of providing for all our needs from a limited amount of land much easier.
4. Soil Fertility
The greatest suggestion that biochar may be beneficial to soil fertility comes from studies of the Amazonian Dark Earth (ADE) soils known as terra preta and terra mulata which contain high levels of black carbon (Glaser 2001). ADEs are prized for their high nutrient levels and high fertility (Lehmann et al, 2003). The high cation exchange capacity (CEC) of ADEs compared to adjacent soils is due to its black carbon content (Liang et al 2006). The obvious question then is whether adding black carbon to other soils might have a similar beneficial effect on their fertility.
There is a long tradition in Japan of using charcoal as a soil improver. Nishio (1996) states “the idea that the application of charcoal stimulates indigenous arbuscular mycorrhiza fungi in soil and thus promotes plant growth is relatively well-known in Japan, although the actual application of charcoal is limited due to its high cost”. The relationship between mycorrhizal fungi and charcoal may be important in realising the potential of charcoal to improve fertility. Nishio (1996) reports that charcoal was found to be ineffective at stimulating alfalfa growth when added to sterilised soil, but that alfalfa growth was increased by a factor of 1.7-1.8 when unsterilised soil containing native mycorrizal fungi was also added. Warnock et al (2007) suggest four possible mechanisms by which biochar might influence mycorrhizal fungi abundance. These are (in decreasing order of currently available evidence supporting them): “alteration of soil physico-chemical properties; indirect effects on mycorrhizae through effects on other soil microbes; plant–fungus signalling interference and detoxification of allelochemicals on biochar; and provision of refugia from fungal grazers.
Data on the effect of charcoal on crop yields is still rudimentary – only a limited number of crops grown on a limited number of soils have been investigated. The interactions between crop, soil type, local conditions, and biochar feedstock, production method and application rate will have to be studied in far more detail before large scale deployment of biochar as a soil amendment can be contemplated. Nonetheless, there is evidence that at least for some crop/soil combinations, addition of charcoal may be beneficial.
Steiner et al (2007) investigated the effect of 15 different combinations of chicken manure, charcoal, compost, leaf litter, and burned leaf litter amendments on a highly
receiving NPK mineral fertilisation and the other without NPK. Steiner et al reported a doubling of maize grain yield on plots using a combination of NPK fertilizer with charcoal compared to use of NPK fertilizer alone. Whilst yield fell over the course of four cropping cycles on all of the plots, the rate of decline in yield was significantly lower on charcoal amended plots than on those which received only mineral fertiliser. Also, the quantity of nutrients P, K, Ca, Mg remained higher in charcoal amended plots despite larger amounts of these nutrients having been removed from the soil in the form of harvested plant matter. Nonetheless, the declining yields distinguish these charcoal amended plots from true terra preta which is reported to maintain its fertility over many cropping cycles (Glaser 2001). Creation of terra preta thus clearly requires more than just charcoal addition. As yet, attempts to replicate terra preta soils have been unsuccessful. According to Glaser (reported in Casselman 2007), “the key to making agrichar behave like terra preta lies in the biological behavior of the original Amazonian dark earths” a difference he attributes to their age, suggesting it may take 50 to 100 years for biochar amended soils to acquire the characteristics of terra preta. As noted above, the work of Nishio (1996) suggests that mycorrhizal fungi may be an important factor in the creation of anthrosols that perform as well as terra preta.
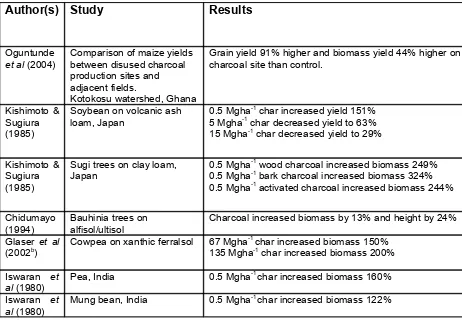
[image:20.595.94.556.364.684.2]A number of other studies have also investigated the effect of charcoal on crop yields. The results of some are summarised in table 4 below.
Table 5: Studies of effect of biochar on crop yield
Author(s) Study
Results
Oguntunde
et al (2004) Comparison of maize yields between disused charcoal production sites and adjacent fields.
Kotokosu watershed, Ghana
Grain yield 91% higher and biomass yield 44% higher on charcoal site than control.
Kishimoto & Sugiura (1985)
Soybean on volcanic ash
loam, Japan 0.5 Mgha
-1 char increased yield 151% 5 Mgha-1 char decreased yield to 63% 15 Mgha-1 char decreased yield to 29%
Kishimoto & Sugiura (1985)
Sugi trees on clay loam,
Japan 0.5 Mgha
-1 wood charcoal increased biomass 249% 0.5 Mgha-1 bark charcoal increased biomass 324% 0.5 Mgha-1 activated charcoal increased biomass 244%
Chidumayo
(1994) Bauhinia trees on alfisol/ultisol Charcoal increased biomass by 13% and height by 24% Glaser et al
(2002b) Cowpea on xanthic ferralsol 67 Mgha
-1 char increased biomass 150%
135 Mgha-1 char increased biomass 200%
Iswaran et
al (1980) Pea, India 0.5 Mgha
-1 char increased biomass 160%
Iswaran et
al (1980) Mung bean, India 0.5 Mgha
5. Soil Water Retention
Hydrophobicity of soils can have severe adverse effects such as reduced plant growth and increased overland flow leading to increased soil erosion (Doerr et al 2000). It is therefore important to consider the possibility that biochar applications may introduce hydrophobic compounds into the soil.
Water repellency of soils is sometimes observed to increase after fires (Martin & Moody 2001). In part, this may be due to physical changes in the soil whereby small particles of ash and char block soil pores and reduce water infiltration rates (Martin & Moody 2001). Of more concern in the context of biochar, is the mechanism whereby hydrophobic organic compounds are produced during combustion and coat soil particles (DeBano 1981). According to Doerr et al (2000), organic coatings are a common cause of water repellency in soils. The possibility of such compounds occurring in biochar is therefore a cause for concern.
The processes involved in distributing volatile organic compounds (VOCs) within the soil will be different in the case of biochar application compared to fires occurring directly on the soil. In the first instance, the VOCs will be adhered to the char particles only. In the second case, the heat of the fire will distribute the VOCs throughout the soil structure allowing it to also coat non-char soil particles. Thus, even if the same hydrophobic compounds were present in both cases, we may expect the effect on soil water repellency to be different. Nonetheless, the introduction of recalcitrant hydrophobic compounds into the soil with biochar would leave open the possibility of their subsequent redistribution within the soil by physical, chemical or biological processes.
Two areas of research will need to undertaken to resolve whether this is indeed an issue for concern. Firstly the question of what hydrophobic compounds (if any) are present in biochar and in what concentrations will need to be investigated. This will likely vary depending on both pyrolysis conditions and feedstock. The second research question that will need to be addressed is what the fate of such compounds may be once they are incorporated into the soil with the biochar. Even if they have no immediate adverse effect on soil water retention, there may be a danger that they could subsequently be redistributed within the soil (for example by fire) leading to deleterious water repellency. The danger of hydrophobic compounds being transported away from the char particles and redistributed within the soil may be mitigated somewhat by the fact that, as Smernick (2007) notes, “charcoal has a very high sorption affinity for hydrophobic organic contaminants (HOC)—in fact charcoal can be orders of magnitude more sorptive than soil organic matter. For this reason, the addition of charcoal to soil has been considered as a method for limiting the mobility, toxicity and transport of xenobiotics in contaminated soils”.
may make biochar a useful tool in the reversal of desertification. Further research will be required to determine just which soils may be suited to charcoal amendment with regard to the effect on their water retention properties.
6. Agricultural Nutrient leaching
It has been suggested that biochar may have the potential to reduce leaching of pollutants from agricultural soils (Lehmann et al 2006). This possibility is suggested by the strong adsorption affinity of biochar for soluble nutrients such as ammonium (Lehmann et al. 2002), nitrate (Mizuta et al. 2004), phosphate (Beaton et al. 1960), and other ionic solutes (Radovic et al. 2001). If this affinity of biochar for ionic solutes can in fact be utilised to reduce run-off in agricultural watersheds, then it will have important benefits in terms of reducing hypoxia of inland and coastal waterways caused by eutrophication.
There is some cause to doubt how effective this may prove however. When measuring leaching from unfertilised soil samples, Lehmann et al (2003b) found that “cumulative leaching of mineral N, K, Ca, and Mg in the Amazonian Dark Earth was only 24, 45, 79, and 7%, respectively, of that found in a Ferralsol”. When the same test was performed on mineral fertilised soil samples, however, leaching from ADEs exceeded that from the ferralsol.
7. Albedo
Greenhouse gas emissions are not the only means by which human activity may influence climate change. Another mechanism that may be of some importance in altering the radiative forcing of Earth’s climate is changing the albedo. If not handled with care, the widespread land deposition of black carbon from biochar could significantly alter the Earth’s albedo. We can get some feel for the possible extent of this problem by comparing it to the effect of black carbon from soot that has already been created by human activity. According to Hansen (2007), the total positive radiative forcing attributable to black carbon (from both fossil fuel and biomass burning) is 0.5 Wm-2 compared to a figure from the same source of 1.5 Wm-2 due to carbon dioxide emissions. The contribution to climate forcing due to black carbon may be even more significant in the cryosphere where depositions of black carbon on snow and ice can significantly alter the albedo. The IPCC (20071) give the radiative forcing due to black carbon deposition on snow as 0.1 Wm-2. According to Jacobsen (2007, 1), “Soot particles containing black carbon, from fossil-fuel and biofuel burning sources, have a strong probability of being the second leading cause of global warming after carbon dioxide and ahead of methane”. At present, this positive forcing due to black carbon is balanced by negative forcings such as the aerosol indirect effect (Hansen 2007) whereby soot particles in the atmosphere alter cloud cover. We can not assume that this will remain true if the large scale production and land application of black carbon were to be adopted. At least we can say that great care will have to be taken in the production, storage, transport and application of biochar, and also during agricultural operations such as tillage to ensure that minimal amounts are blown around as dust. It may also become necessary to ensure that soil which has been treated with biochar maintains a dense vegetation canopy for most of the year. The practicality of ensuring that such precautions are adequately implemented may be an important factor in deciding whether biochar production should become a policy objective.
8. Cost
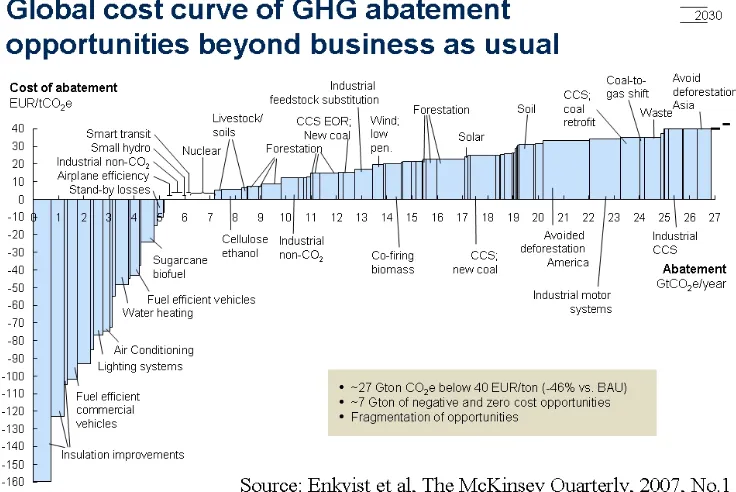
[image:23.595.114.482.268.514.2]The economic cost of implementing biochar production and use is important not just because it determines how readily and rapidly we might deploy the technology, but also because it must compete for finance and resources with other technologies that may likewise be aimed at climate change abatement. From an economic perspective, it makes sense to invest first in those technologies that have the largest impact per unit of money on climate change mitigation. To do otherwise would be to make inefficient use of available finance, and would overall achieve less abatement. Figure 5 (from Enkvist et al 2007), shows the global greenhouse gas (GHG) abatement potential and cost for a range of potential strategies.
Figure 5: Global cost curve for greenhouse gas abatement opportunities
Overall, Enkvist et al (2007) identify 27 GtCO2e yr-1 abatement potential at a costs of under US$40 per tonne of CO2 equivalent (where CO2e means 'CO2 equivalent' and is calculated as a weighted sum of greenhouse gas emissions multiplied by their global warming potential). Of this the first 7 GtCO2e yr-1 has negative (i.e. saves more money than it costs) or zero cost.
also a high cost. Somewhere between these extremes will lie slash-and-char agriculture with a small cost and intermediate GHG abatement potential. It is too early in the development of biochar technology to put firm figures on the costs of different production methods, but Lehmann (2007b) estimates that “biochar sequestration in conjunction with bioenergy from pyrolysis becomes economically attractive, under one specific scenario, when the value of avoided carbon dioxide emissions reaches $37 per tonne”. At time of writing, $37 is equivalent to 25 Euros, which would place this method of biochar production just below carbon capture and storage for new coal power stations on Enkvist et al’s (2007) graph, with an abatement potential of 0.18 PgCyr-1 (0.66 GtCO
2eyr-1) now, rising to 9.5 PgCyr-1 (35 GtCO
2eyr-1) by 2100 (figures from Lehmann, 2006, as discussed in section 1.1.4).
9. Summary
In conclusion, we can say that biochar appears, given the current state of knowledge, to have potential both for greenhouse gas mitigation and as a soil improver. Considerable uncertainties remain, however, about its applicability to different soils and crops and about how much biochar production is feasible with respect to constraints on economics, land availability and competing demands for biomass (including direct incorporation into the soil). The uncertainties and areas requiring further research are outlined below:
• A maximum of 1 PgCyr-1 biochar might be produced from agricultural residues (if
all current global agricultural residues were converted to biochar). In practice, this figure will be constrained by cost, suitability of different residues, requirements to incorporate residues into the soil, and other competing demands. How much biochar might be produced from agricultural residues once such constraints have been taken into account is a matter for further research.
• Estimates of how much biomass might be produced by dedicated cropping
remains a highly debated question. At the low end, figures from Sims et al (2006) suggest that between 0.06 - 0.7 PgC yr-1 might be realistically achievable by 2025. At the high end, figures from Smeets et al (2007) suggest that up to 46 PgC yr-1 might be achievable if we were to transform the planet into a large factory farm. More detailed studies at the local level will be required to ascertain the true potential for dedicated production of biomass.
• Other potential sources of biomass include shifting cultivation, forestry residues,
sewage and waste streams such as food waste and paper/cardboard. Further research will be required to ascertain the combined potential of all possible sources of biomass for biochar production.
• How rapidly biochar may oxidise in different environments is still largely unknown,
although its observed recalcitrance under many conditions gives reason for optimism that the rate of decay of black carbon in soil will be sufficiently slow to make it a useful form of carbon sequestration.
• Co-production of biochar and energy is clearly possible (as demonstrated by the
• Whilst a beneficial effect of biochar soil additions on crop yields has been
demonstrated for a small number of soil/crop combinations, its utility in a wide range of soil/crop types (particularly in temperate zones) remains to be demonstrated. This will require consideration not just of its effect on nutrient cycles, but also on hydrology.
• The effect of biochar production on nitrous oxide emissions is largely an unknown
factor. Although there is a possibility that biochar additions may reduce N2O direct emissions from soils, and may also reduce indirect N2O emissions by reducing nitrate run-off, neither of these possibilities has been adequately demonstrated under a range of different agricultural conditions. There is also the possibility that, if biochar is produced by dedicated cropping with application of mineral nitrogen fertiliser, the direct and indirect N2O emissions from this fertiliser will lead to an increase rather than a decrease in net N2O emissions.
• Biochar has the potential to either alleviate pressure on land use (by increasing
crop yields) or to become a competing demand for land (in the case of dedicated cropping for biomass feedstock). Either way, the role of biochar in establishing a comprehensive land use strategy that meets the environmental, social and economic needs of the 21st century is in need of further consideration.
• It is possible that biochar may help to reduce nutrient run-off from soils and the
associated problems of eutrophication and hypoxia of both inland and coastal waters. In what soils and under what conditions this might in fact be achieved remains to be shown. There is evidence that under some conditions, biochar may have the opposite effect of increasing leaching of applied mineral fertilisers.
• Despite its potential to reduce greenhouse gas emissions, the widespread land
application of biochar might also have a detrimental effect on global warming by increasing the radiative forcing due to albedo. The extent to which this may be a problem, and the extent to which this may be mitigated by strategies such as maintaining a dense vegetation canopy over darkened soils requires further research.
References
Barker T., I. Bashmakov, L. Bernstein, J. E. Bogner, P. R. Bosch, R. Dave, O. R. Davidson, B. S. Fisher, S. Gupta, K. Halsnæs, G.J. Heij, S. Kahn Ribeiro, S. Kobayashi, M. D. Levine, D. L. Martino, O. Masera, B. Metz, L. A. Meyer, G.-J. Nabuurs, A. Najam, N. Nakicenovic, H. -H. Rogner, J. Roy, J. Sathaye, R. Schock, P. Shukla, R. E. H. Sims, P. Smith, D. A. Tirpak, D. Urge-Vorsatz, D. Zhou, 2007: Technical Summary. In: Climate Change 2007: Mitigation. Contribution of Working Group III to the Fourth Assessment Report of the Intergovernmental Panel on Climate Change [B. Metz, O.R. Davidson, P. R. Bosch, R. Dave, L. A. Meyer (eds)], Cambridge University Press, Cambridge, United Kingdom and New York, NY, USA.
Basu K. (1994), “The Traveler's Dilemma: Paradoxes of Rationality in Game Theory” The American Economic Review, Vol. 84, No. 2, Papers and Proceedings of the Hundred and Sixth Annual Meeting of the American Economic Association.(May, 1994), pp. 391-395. Stable URL:
http://links.jstor.org/sici?sici=00028282%28199405%2984%3A2%3C391%3ATTDPOR%3E2.0.CO %3B2-I
Beaton, J.D., Peterson,H.B. and Bauer,N.: 1960, ‘Some aspects of phosphate adsorption by charcoal’, Soil Science Society of America Proceedings 24, 340–346.
Bellamy, P. H., P. J. Loveland, R. I. Bradley, R. M. Lark, and G. J. D. Kirk. 2005. Carbon losses from all soils across England and Wales 1978-2003. Nature 437, no. 7056: 245-248.
Berndes, G., Hoogwijk, M. and van den Broeck, R.: 2003, ‘The contribution of biomass in the future global energy supply: A review of 17 studies’, Biomass and Bioenergy 25, 1–28.
Boyd, P.W., and T.W. Trull. 2007. Understanding the export of biogenic particles in oceanic waters: Is there consensus? Progress In Oceanography 72, no. 4 (March): 276-312.
Casselman , A. (2007), “: Special Report: Inspired by Ancient Amazonians, a Plan to Convert Trash into Environmental Treasure. Scientific American May 15.
CAT (2007), “Zero Carbon Britain: An Alternative Energy Strategy”, Centre for Alternative Technology, Machynlleth, Wales, http://www.zerocarbonbritain.com/images/zerocarbonbritain.pdf
(accessed 7/11/07)
Charlson, Robert J., James E. Lovelock, Meinrat O. Andreae, and Stephen G. Warren. 1987. Oceanic phytoplankton, atmospheric sulphur, cloud albedo and climate. Nature 326, no. 6114 (April 22): 655-661.
Coale, Kenneth H., Kenneth S. Johnson, Francisco P. Chavez, Ken O. Buesseler, Richard T. Barber, Mark A. Brzezinski, et al. 2004. Southern Ocean Iron Enrichment Experiment: Carbon Cycling in High- and Low-Si Waters. Science 304, no. 5669 (April 16): 408-414.
Commission Of The European Communities (2007) “Limiting Global Climate Change to 2 degrees Celsius - The way ahead for 2020 and beyond”, Communication From The Commission To The Council, The European Parliament, The European Economic And Social Committee And The Committee Of The Regions, Brussels, 10.1.2007 COM(2007) 2 final,
http://europa.eu/press_room/presspacks/energy/comm2007_02_en.pdf (accessed 12/12/07)
Chidumayo E.N. (1994), “Effects of wood carbonization on soil and initial development of seedlings in miombo woodland, Zambia”, Forest Ecological Management 70:353–357
Chisholm, Sallie W., Paul G. Falkowski, and John J. Cullen. 2001. OCEANS: Dis-Crediting Ocean Fertilization. Science 294, no. 5541 (October 12): 309-310.