STUDIES ON THE GRANULOCYTE CELL SURFACE OXIDASE
A thesis submitted for
the Degree of
Doctor of Philosophy
in the
University of Tasmania
by
Catharine Lynne DEWAR
Department of Medicine
/Aes/s
kcCE1
(
THE I
UN
IVERSITY Or T&SMANIA1.
CONTENTS PAGE
SUMMARY vii
STATEMENT REGARDING ORIGINALITY ix
ACKNOWLEDGEMENTS
DEDICATION xi
PUBLICATIONS xii
ABBREVIATIONS USED IN THIS THESIS xiii
CHEMICALS AND EQUIPMENT xv
Section 1 INTRODUCTION
1.1 Introductory Remarks
1.2 The Granulocyte
1.3 Phagocytosis - associated metabolic events 3
1.4 The oxidase responsible for superoxide production
1.5 The plasma membrane oxidase 5
1.6 The fluid mosaic model of the membrane
1.7 Movement of proteins within the membrane
1.8 Outline of the Thesis 9
Section 2 SEPARATION of GRANULOCYTES from PERIPHERAL BLOOD
2.1 INTRODUCTION 11
2.2 METHODS (sections 2.2.1 - 2.2.13) 12
2.3 RESULTS
2.3.1 Yield after 30 min or 40 min centrifugation 18
2.3.2 Volume of plasma used in the dextran sedimentation step
2.3.3 Autologous versus AB-Rh-negative plasma_ 19
2.3.4 Dextran
2.3.4.1 Volume of dextran in the sedimentation step
2.3.4.2 Concentration of dextran
2.3.4.3 Erythrocyte contamination of the granulocytes in
the sedimentation step 20
2.3.5 Inner diameter of the sedimentation step tube
2.3.6 Viability
2.3.7 Granulocyte functional tests
2.3.7.1 Phagocytic assay
ii
PAGE
2.3.7.3 NBT dye reduction assay 21
2.3.8 Differential counts of whole blood and isolated
granulocytes
2.3.9 Recoveries of isolated granulocytes
2.3.9.1 Recoveries using the quotient G 1/G0 x 100 22
2.3.9.2 Recoveries calculated using BOyum's method
2.3.10 Isolated granulocytes
2.4 DISCUSSION 22
2.5 SUMMARY 25
2.6 FIGURES AND TABLES
Section 3 ASSAY of PLASMA MEMBRANE OXIDASE ACTIVITY
3.1 INTRODUCTION 26
3.2 METHODS (sections 3.2.1 - 3.2.4.4) 28
3.3 RESULTS
3.3.1 NBT dye reduction by granulocyte monolayers 31
3.3.2 Experiments to establish the initial rate of NBT
reduction
3.3.2.1 Time course of NBT reduction
3.3.2.2 The effect of granulocyte concentration on NBT reduction
3.3.2.3 The effect of NBT concentration on reduction
3.3.2.4 The kinetics of the initial rate of NBT dye
reduction 32
3.4 DISCUSSION 32
3.5 SUMMARY 35
3.6 FIGURES and TABLES
Section 4 MICROFILAMENT and MICROTUBULE DISRUPTION AND OXIDASE ACTIVITY (non-phagocytic granulocytes)
4.1 INTRODUCTION 36
4.2 METHODS (sections 4.2.1 - 4.2.7.2) 36
4.3 RESULTS 42
4.3.1 The initial rate of NBT reduction by drug-treated granulocytes
4.3.1.1 The effect of drug dose upon reduction 43
4.3.1.2 The effect of incubation time with the agents
4.3.1.4 Colch (or VBL) pre-incubation followed by cyto B
4.3.1.5 Cyto B pre-incubation followed by colch (or VBL)
4.3.2 Incubation of NBT dye with the drugs
4.3.3 Generation of lumicolchicine
4.3.4 The reduction of NBT by lumicolchicine-treated
granulocytes
4.3.5 Protein measurements of granulocyte monolayers
4.4 DISCUSSION
4.5 SUMMARY
4.6 FIGURES and TABLES
Section 5 MICROFILAMENT and MICROTUBULE DISRUPTION and OXIDASE ACTIVITY (phagocytic granulocytes)
55
5.1 INTRODUCTION
5.2 METHODS (sections 5.2.1 - 5.2.7) 55
5.3 RESULTS
5.3.1 Phagocytosis of polystyrene latex beads 60
5.3.2 Scanning electron microscopy
5.3.3 NBT reduction by phagocytic, drug-treated
granulocytes
5.3.3.1 Cytochalasin B-treated granulocytes 61
5.3.3.2 Colch and VBL-treated granulocytes 62
5.3.4 Protein content of drug-treated phagocytic
monolayers
5.4 DISCUSSION 62
5.5 SUMMARY 70
5.6 FIGURES and TABLES
Section 6 ASSAY of the PRESENCE or ABSENCE of MICROTUBULES in DRUG-TREATED GRANULOCYTES
6.1 INTRODUCTION 72
6.2 METHODS (sections 6.2.1 - 6.2.5) 73
6.3 RESULTS
6.3.1 Post-incubation viability 77
6.3.2 The surface distribution of con A-FITC on drug-
treated granulocytes
6.3.3 Time course of con A receptor redistribution 78
6.4 DISCUSSION 78
6.5 SUMMARY 83
6.6 FIGURES and TABLES
iv
PAGE
Section . 7 EXPERIMENTS with the FLUORESCENT MEMBRANE PROBE, ANS
85
7.1 INTRODUCTION
7.2 METHODS (sections 7.2.1 - 7.2.6) 87
7.3 RESULTS
7.3.1 Fluorescence intensity of ANS-labelled granulocytes 90
7.3.2 The fluorescence intensity of drug-treated
granulocytes 91
7.3.3 Experiments with phagocytic granulocytes
7.4 DISCUSSION 91
7.5 SUMMARY 96
7.6 FIGURES
Section 8 MICROFILAMENT and MICROTUBULE DISRUPTION and HMPS ACTIVITY
8.1 INTRODUCTION 98
8.2 METHODS (sections 8.2.1 - 8.2.5) 99
8.3 RESULTS
8.3.1 Pre-incubation with cytochalasin B 104
8.3.2 Pre-incubations with VCR, VBL or colchicine
8.3.3 The effect of incubation time with the agents
or controls
8.3.4 The effect of potassium cyanide 105
8.4 DISCUSSION 105
8.5 SUMMARY 110
8.6 FIGURES and TABLES
Section 9 ULTRASTRUCTURAL STUDIES of NBT REDUCTION by GRANULOCYTES
9.1 INTRODUCTION 111
9.2 METHODS (sections 9.2.1 - 9.2.7) 112
9.3 RESULTS
9.3.1 Untreated granulocytes 117
9.3.2 Phagocytic granulocytes 118
9.3.3 Non-phagocytic granulocytes exposed to NBT dye
9.3.4 Colchicine-treated non-phagocytic granulocytes
9.3.5 Cyto B-treated non-phagocytic granulocytes 119
9.3.6 Phagocytic granulocytes incubated with NBT
PAGE
9.3.8 Cyto B-treated phagocytic granulocytes
9.4 DISCUSSION
9.5 SUMMARY
9.6 FIGURES
Section 10 DISCUSSION
10.1 Introductory Remarks
10.2 The problems of studying the granulocyte
plasma membrane oxidase
10.3 The relevant experimental findings
10.4 Conclusions to be drawn from these studies
10.5 The relevance of these findings to in vivo
studies
10.6 FUTURE WORK
Appendix I THE OXIDASE RESPONSIBLE for the METABOLIC BURST
1.1 Introduction
1.2 Studies with CGD and normal granulocytes
1.3 Arguments for and against an NADPH oxidase
1.3.1 The link between the oxidase and the HMPS
1.3.1.1 The glutathione peroxidase/glutathione reductase
1.3.1.2 A transhydrogenase 147
1.3.1.3 A lactate dehydrogenase 148
1.3.2 Evidence supporting the NADPH oxidase from studies
with G6PD-deficient patients
1.3.3 Studies of the changes in NAD(P) + /NAD(P)H
levels after phagocytosis
1.3.4 The problem of competition for NADH as substrate
1.3.5 The Km of the NAD(P)H oxidase towards its substrate 151
1.3.6 The Mn+2 requirement of the NADPH oxidase
1.3.6.1 The oxidase of the granule-containing fractions
1.3.6.2 The Mn+2-catalyzed oxidation of NADPH by MPO 152
1.3.7 The levels of the oxidase in granulocytes 156
1.3.8 The rate of oxidase activity
The intracellular location of the 0
2 producing
oxidase 158
Recent studies on the plasma membrane of CGD
granulocytes 160
vi
PAGE
Appendix II THE PREPARATION of the HEPES PHYSIOLOGICAL SALINE SOLUTIONS
11.1 HEPES physiological saline solution (HSS) 163
11.2 Ca+2 and Mg+2 free physiological saline solution (CMFH)
11.3 Ca+2 free physiological saline solution (CFH)
11.4 Concentrated salt solutions 164
11.5 Glucose, 155 mM
11.6 HEPES buffer solution, 58.5 mM
Appendix III ENZYME KINETIC ANALYSIS
Introduction and description of methods used 165 Table 111.1 : Kinetic parameters for the
reduction of NBT by intact granulocytes
Appendix IV MICROTUBULES and MICROFILAMENTS
IV.1 Microtubules 170
IV.1.1 Microtubule - disrupting agents 172
IV.1.2 Microtubule-mediated cellular functions 175
IV.1.3 Models depicting a contractile activity of
microtubules 176
IV.2 Microfilaments 178
IV.2.1 Microfilaments as contractile structures 180
IV.2.2 Microfilament-disrupting agents 181
IV.2.3 Microfilament-mediated cellular functions 182
IV.3 Figures
SUMMARY
This thesis examined the possible role of the microfilaments and
microtubules in controlling the activity of the granulocyte plasma membrane
oxidase. There - have not been any detailed investigations of this topic
published to date.
The conflicting literature on the nucleotide specificity and
location of the oxidase within the granulocyte was examined. In vitro
techniques for isolating granulocytes from human peripheral blood and for
quantitating the initial rate of plasma membrane oxidase activity were
de-veloped and used for these investigations. The involvement of microfilaments
and microtubules in oxidase activity was studied by using pharmacological
agents known to disrupt these structures in vitro (cytochalasin B, and
colchicine, vinblastine and vincristine, respectively). Control experiments
were also performed to ensure that microfilament and microtubule disruption
by these agents provided the best explanation for the results presented
here-in. Correlative experiments were conducted to determine if a change in
hexose monophosphate shunt activity was associated with the observed
changes in plasma membrane oxidase activity brought about by the drug
treatments.
Experiments on non-phagocytic granulocytes showed that microfilament
disruption led to enhanced oxidase activity, while microtubule disruption
pro-duced a dual effect : a paradoxical enhancement (with low doses or brief
exposures to the agents) and an impairment in oxidase activity. These
results suggested that microfilaments act as a constraint against, while
microtubules are required for plasma membrane oxidase activity. The
re-quirement for microtubules was highlighted in experiments where the usual
viii
granulocytes were concomitantly incubated with a microtubule-disrupting
agent. (With phagocytic granulocytes qualitatively similar results were
observed. However, those experiments were not suitable for studying cell
surface oxidase activity because the presence of ingestable. Particles made
it impossible to determine whether plasma membrane and/or granule oxidase
activity was being measured.)
Based on the spectrophotometric and electron microscopic results
presented and the relevant findings from other investigators, a scheme
concerning the participation of the cytoskeletal elements in granulocyte
plasma membrane oxidase activity was devised. In this scheme the
micro-filaments physically constrain the oxidase within the plasma membrane,
and thereby hold the activity of the oxidase in check. Thus, microfilament
disruption is envisaged to result in enhanced oxidase activity by freeing the
enzyme. However, the oxidase is viewed as optimally active only as long as
the microtubules are present to maintain the plasma membrane topography
STATEMENT REGARDING ORIGINALITY
This thesis contains no material which has been
accepted for the award of any other degree or diploma in any
University or College, and to the best of my knowledge and belief
contains no copy or paraphrase of material previously published
or written by another person, except where due reference is made
in the text.
Signed:
Date:
Z4beivA
,
%-
June, 1979
ACKNOWLEDGEMENTS
I would like to express my sincere appreciation to
Dr. R. M. Lowenthal (my supervisor), Professors G. W. Boyd and
J. Norelle Lickiss of the University of Tasmania, and Dr. M. W. Wolowyk
of the University of Alberta, Canada who gave me the opportunity and
inspiration to conduct my research.
I must also thank my colleagues at the Clinical School who
provided me with a congenial atmosphere in which to work. Dr. Roger Harlow
in particular is to be acknowledged for many helpful suggestions
through-out the course of this work.
Special thanks are also due to Professor R. Rodda of the
Department of Pathology (for use of the electron microscope suite);
Dr. A. McKee, Central Science Laboratory (for help with scanning electron
microscopy); Dr. J. Bremner, Chemistry (for help in generating
lumicolchicine); David Lees, Photography (for the use of his photographic
equipment and darkroom); Judy Wolfe and Mediha Kernot (for assistance
with medical literature searches); and Dr. C. S. Hosking and staff in the
Pathology Department, Royal Children's Hospital, Melbourne (for teaching
me the procedure for assaying granulocyte HMPS activity).
In addition, I must express my appreciation to Sandra Petrie
for cheerfully (and skillfully!) typing my thesis.
Finally, I would like to thank my husband John, whose constant
encouragement and love made it possible for me to undertake and complete
this work.
During the course of these studies I received financial
support from the University of Tasmania, The Tasmanian Cancer Committee,
a Commonwealth Post-Graduate Research Award; and my supervisor and
myself received research grants from the National Health and Medical
TO MY PARENTS
PUBLICATIONS
1. Dewar CL, Wolowyk MW, and Hill JR (1976). A simple method for
processing erythrocytes for scanning electron microscopy.
Amer. J. din. Pathol. 66: 760-765.
2. Dewar CL (1978). An improved method for isolation of granulocytes
from peripheral blood. J. Immunol. Methods 20: 301-310.
3. Dewar CL and Wolowyk MW (1979). Scanning electron microscopy of blood
cells. Microscopica Acta 81: 209-216.
4. Lowenthal RM, Marsden KA, Dewar CL and Thompson GR. Congenital
dyserythropoietic anaemia (CDA) with severe gout, rare Kell
phenotype and erythrocyte, granulocyte and platelet membrane
reduplication: a new variant of CDA Type II. Brit. J.
Haematol. (in press).
5. Dewar CL, Lowenthal RN and Marsden KA. Ultrastructural studies
of an unusual variant of congenital dyserythropoietic anaemia
type II. (submitted for publication).
6. Dewar CL and Lowenthal RM. The role of microtubules and
micro-filaments in granulocyte plasma membrane oxidase activity.
(submitted for publication).
7. Dewar CL. The oxidase responsible for the granulocyte metabolic
ABBREVIATIONS USED IN THIS THESIS
ANS 8-anilino-l-naphthalene sulfonic acid
ATP adenosine triphosphate
con A concanavalin A
con A-FITC concanavalin A, fluorescently labelled with
fluorescein isothiocyanate
CFH calcium-free physiological saline solution
CGD chronic granulomatous disease
Ci Curie
CMFH calcium and magnesium-free physiological
saline solution
colch colchicine
cyto B cytochalasin B
DAAO D-amino acid oxidase
dextran Dextran T 500
DMSO dimethylsulfoxide
ELS erythrocyte lysing solution
FAD flavin adenine dinucleotide
G6PD glucose-6-phosphate dehydrogenase
GSH reduced glutathione
GSSG oxidized glutathione
H
202 hydrogen peroxide
HEPES N-2- hydroxyethylpiperazine-N-2-ethanesulfonic
acid
HMPS hexose monophosphate shunt
HSS HEPES physiological saline solution
xiv
K
m the kinetically defined Michaelis constant :
the concentration of substrate at which the
reaction proceeds half-maximally
KCN LDH MPO NAD NADH NADP+ NADPH potassium cyanide lactate dehydrogenase myeloperoxidase
nicotinamide adenine dinucleotide
nicotinamide adenine dinucleotide
nicotinamide adenine dinucleotide
(oxidized)
nicotinamide adenine dinucleotide
(reduced)
(oxidized)
(reduced)
phosphate
phosphate
NAD (P) NAD and/or NADP
NAD(P)H NADH and/or NADPH
NBT nitroblue tetrazolium
0 2
superoxide
OD optical density
PHA phytohaemagglutinin
TH transhydrogenase
Tris Tris (hydroxymethyl) aminomethane
V
max the maximal velocity of the reaction
VCR vincristine
VBL vinblastine
water glass-distilled, deionized water
STATISTICS
P value = probability value between means (Student's paired
CHEMICALS
ANS Sigma Chemical Co., St. Louis
Mo.,i1SA
Bovine albumin (fraction V) Commonwealth Serum Laboratories,
Melbourne, Victoria, Australia
Colchicine Sigma, and more recently Boehringer
Mannheim Australia Pty. Ltd.,
Mount Waverley, Vic., Australia
Con A-FITC Calbiochem, La Jolla, Calif.,
USA
Cytochalasin B Sigma
Dextran T 500 Pharmacia, Uppsala, Sweden
Dioxane (spectral grade 1, Hopkin and Williams, Essex,
4-dioxan) England
DMSO Sigma
Eosin y (= eosin yellowish) George T. Gurr, London, England
Ficoll (M. Wt. - 400,000) Sigma
Folin and Ciocalteu's Phenol Sigma
Reagent
Glucose (14C-1-glucose) The Radiochemical Centre,
Amersham, Bucks., England
Glutaraldehyde EM (25% TAAB Laboratories, Reading,
aqueous solution) England
HEPES Calbiochem
Hyamine Hydroxide IOX Packard Instrument Pty. Ltd.,
(= Hyamine IOX) Mount Waverley, Vic., Australia
Lead nitrate Ajax Chemicals, Sydney, Australia
Methylene blue George T. Gurr, London, England
NBT (grade III, crystalline, Sigma
lemon yellow)
Packard liquid scintillation Packard
fluid (Permablend III)
Polystyrene latex beads Sigma
Propylene Oxide B.D.H. (Australia), Boronia,
Vic., Australia
Pyridine (analytic reagent B.D.H. (Australia)
grade)
Siliconizing solution (Siliclad) Clay Adams, Parsippany, N.J.
USA
Sodium cacodylate B.D.H. (Australia)
[(CH
3) 2 As02 Na x 3 H20]
Sodium citrate
(Na
3C6HSO7 x 2 H20) B.D.H. (Australia)
Sodium deoxycholate B.D.H. (Australia)
(C
24H3904Na)
Sodium metrizoate (32.7% w/v) Nyegaard and Co., Oslo, Norway
Spurr's resin (all components) Ladd Research Industries,
Burlington, Vermont, USA
Tris (Trizma) Sigma
Tris maleate (Trizma maleate) Sigma
Trypan blue George T. Gurr, London, England
Uranyl acetate
[U0
2 (C2H302)2 x 2H20] B.D.H. (Australia)
Vinblastine (Velbe) Eli Lilly and Co., Indianapolis,
Indiana, USA
Vincristine (Oncovin) Eli Lilly and Co.
xvii
MINOR EQUIPMENT USED
BEEM capsules
Copper grids for electron
microscopy
Better equipment for Electron
Microscopy Inc., Bronx, N.Y.,
USA
Athene-type by VECO, ordered
from LADD Research Industries
Burlington, Vt., USA
Millipore filters Millipore Corporation, Bedford,
Mass., USA
Mini-scintillation vials Filtrona Plastics, Thomastown,
(plastic) N.S.W., Australia
Petri dishes (plastic, Falcon, Oxnard, Calif., USA
35 x 10 mm style)
Test-tubes (polycarbonate) Nalge Sybron Corp., Rochester,
N.Y., USA
Universal containers Johns Professional Products,
Cheltenham, Vic., Australia
MAJOR EQUIPMENT USED
Baird Atomic Fluorimeter
Hitachi HS-7S Electron Microscope
JEOL scanning Electron Microscope
Leitz Orthoplan Fluorescence Microscope (with Ploemopak)
LKB III Utramicrotome
MSE Mistral 4L refrigerated centrifuge
Packard 2450 Tri-Carb liquid scintillation spectrometer
SECTION 1
1
1.1 Introductory remarks
This thesis is concerned with the human granulocyte
plasma membrane oxidase responsible for superoxide production.
Specifically it sets out to examine the possible role Of the
cytOskeletal elements (the microfilaments and microtUbules) in
the control of the activity of this enzyme.
1.2 The Granulocyte
The neutrophilic polymorphonuclear leucocyte (granulocyte)
is able to engulf and subsequently kill ingested macro-organisms
and for this reason these cells have been called "professional
phagocytes" (Rabinovitch, 1968) and recognized as an important
first line of defence against infection. The role played by
phagocytic cells in higher organisms was first recognized by
the Russian zoologist, Metchnikoff, in 1883 (cited by Stossel,
1974; Murphy, 1976). Phagocytosis by unicellular organisms had
been understood as a process whereby single cells obtained food,
but it was Metchnikoff who postulated that the same process in
eukaryotes could protect the higher organism from invasion by
pathogens.
Intense study of the granulocyte since Metchnikoff's
work has shown that the cell is capable of directed movement
towards a target, called chemotaxis (McCutcheon, 1946; Harris,
1954) and that phagocytosis begins as soon as the cell touches an
attractive particle.
It has also been shown that the granulocyte exhibits
discretion when it comes to ingestion: foreign but not autologous
2
while others are vigorously attacked (Mudd et al , 1934; Foley
and Wood, 1959; Rabinovitch, 1968; Maruta and Mizuno, 1971;
Richardson and Sadoff, 1977).
The target is identified as ingestable by (the
granulocyte's) recognition of a host-derived coating of
immuno-globulin and complement molecules, known as opsonin l . The role
of these proteins as molecules which interact with the surface
receptors on the granulocyte to promote ingestion has recently
been reviewed by Stossel, in 1975.
To engulf the micro-organism, the migrating granulocyte
extends hyaline ectoplasm to form pseudopodia on either side of
the particle and then the pesudopodia simply surround the particle
and fuse at its distal side. The micro-organism is then contained
within a phagocytic vacuole or phagosome, the boundary of which
is inverted plasma membrane. The phagosome pinches off from the
parent plasma membrane and moves towards the cell centre (Mudd
et al, 1934; Hirsch and Cohn, 1960).
At about this time, the cytoplasmic granules within the
vicinity of the phagosome move towards and fuse with the vacuole
membrane, discharging their cytotoxic contents into the
phago-some (Hirsch and Cohn, 1960). There is evidence that the smaller
specific granules discharge their contents first followed by the
azurophilic granules (Bainton, 1973). The act of degranulation
and lysosomal enzyme release from the cytoplasmic granules, in
3
concert with an increase in metabolic activity in the
phagocytos-ing cell serves to kill the micro-organism.
1.3 Phagocytosis-associated metabolic events
The increased metabolic activity ("respiratory burst")
following contact and phagocytosis is characterized by an
increased consumption of oxygen, an increase in glucose oxidation
via the hexose monophosphate shunt, and an increase in the
production of hydrogen peroxide and superoxide radical (Sbarra
and Karnovsky, 1959; Iyer, Islam and Quastel, 1961; Rossi and
Zatti, 1964; Selvaraj and Sbarra, 1966; Baehner and Nathan,
1968; Babior, Kipnes and Curnutte, 1973). It was found that
the increased uptake of oxygen during phagocytosis and
phagocytosis itself were insensitive to inhibitors of mitochondrial
oxidative metabolism (Sbarra and Karnovsky, 1959) and that the
energy for phagocytosis was derived from anaerobic glycolysis
(McKinney et al, 1953; Beck, 1958; Marchand, Leroux and
Cartier, 1972). The oxygen taken up by the cells during
phagocytosis was shown, at least in part, to be reduced to
hydrogen peroxide (Iyer, Islam and Quastel, 1961). Iyer et a/
were also the first to suggest that the H 2 02 generated by
phagocytosing cells was used as a microbicidal agent. The
cellular pathway for the reduction of molecular oxygen to hydrogen
peroxide has been the subject of considerable debate for many
years.
1.4 The oxidase responsible for superoxide production
Three flavoproteins (NADH oxidase, NADPH oxidase and
D-amino acid oxidase) as well as myeloperoxidase have been
4
(reviewed by Gee and Cross, 1973). It is now accepted that the
enzyme involved is a reduced pyridine nucleotide oxidase (Babior,
1978) but whether the hydrogen donor for the oxidase is NADPH or
NADH has not been resolved (See Appendix I).
The oxidase catalyzes the reduction.of oxygen by a
one-electron transfer step and therefore the unstable and highly
reactive intermediate, superoxide radical, is formed (Babior et al,
1973; Babior et al, 1976). The stoichiometry for this reaction,
with NADPH- for example, is:
20
2 NADPH
(Babior, 1978)
+ H+
20
2 + NADP
Using methods which allowed precise quantitation of the
fate of the oxygen taken up during the metabolic burst, Root and
Metcalf (1977) demonstrated that all of the oxygen taken up was
- converted to 0
2 and then 80 percent of this superoxide was
converted to H20
2 by dismutation. They showed as well that the
dismutation of two molecules of superoxide was the only important
source of the H
202 generated by the granulocyte. H202 is formed
from the superoxide radical intermediate in the following
reaction:
2H+ 0
2 2
(Fridovich, 1972)
This dismutation reaction can occur spontaneously or it can be
catalyzed by the enzyme superoxide dismutase. Interestingly, the
enzyme catalyzes the reaction at a faster rate than the spontaneous
5
The microbicidal potential of the superoxide radical
was first suggested by McCord, Keele and Fridovich in 1971 because
of the presence and distribution of superoxide dismutase in
certain microbes. Anaerobic microbes are relatively deficient
in superoxide dismutase compared to aerobes, and thus anaerobes
are more sensitive to the cytotoxic effects of superoxide. The
granulocyte's oxygen-dependent mechanisms for killing
micro-organisms involving H 2 0 2 , superoxide radical, and other
metabol-ites of oxygen such as hydroxyl radicals and singlet oxygen
have been reviewed by Klebanoff (1975), Koch (1978) and Babior
(1978).
1.5 The plasma Membrane oxidase
The oxidase responsible for catalyzing the formation
of superoxide has been found in the cytoplasmic granules (see
Appendix I). Recent evidence indicates that in addition to
the granular location of the oxidase, a plasma membrane location
also exists (Briggs et al, 1975; Segal and Peters, 1976; Tsan
et a/, 1976b; Goldstein et a/, 1977). Teleologically, it is
sensible to have the enzyme located in the plasma membrane
be-cause with ingestion the plasma membrane containing this oxidase
(Briggs et al, 1975) is internalized around the particle and
forms the limiting intracellular boundary of the phagosome. It
is self-evident that maintenance of close contact between this
enzyme in the membrane and the ingested particle would contribute
to the efficiency of superoxide and hydrogen peroxide delivery
to the phagosome (see Appendix I).
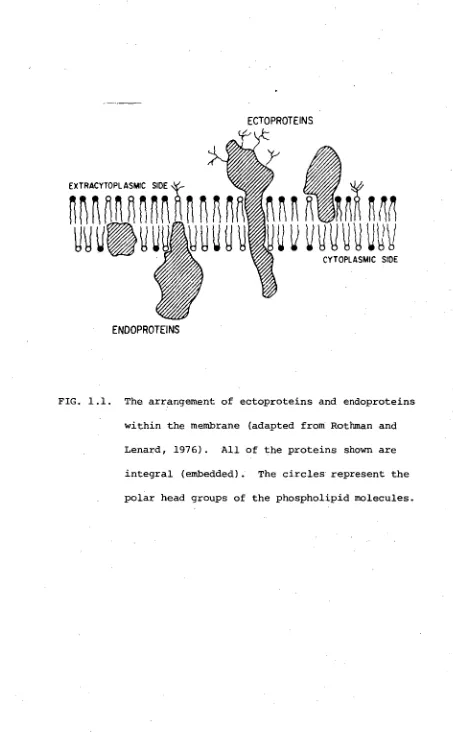
1.6 The fluid mosaic model of the membrane
6
membrane location for the oxidase, it seemed an opportune time to
study this enzyme. To begin this study of the plasma membrane
oxidase it was necessary to review the structure of the cell
membrane. The accepted model for plasma membrane organisation is
the fluid mosaic model of Singer and Nicolson (1972). In this
model of the membrane, proteins are situated in a bilayer mixture
of lipids, and the non-polar portions of both the lipids and
proteins are found within the hydrophobic interior of the bilayer.
The hydrophobic interior is sandwiched between an outer and inner
layer of hydrophilic molecules - the polar head groups of the
phospholipid molecules and the polar groups of proteins. The
proteins can extend into the membrane to different depths
depend-ing upon the distribution of the polar and non-polar groups
within the particular protein (Figure 1.1). Thus proteins are
classed as integral (embedded) or peripheral (surface-associated).
The integral proteins can be further sub-divided into ecto- and
endoproteins. Ectoproteins have a large mass projecting outside
the membrane, beyond the cell surface, while endoproteins project
away from the membrane on its cytoplasmic surface. Examples of
ectoproteins are the glycoproteins, histocompatibility antigens,
immunoglobulin molecules, and drug and hormone receptors
(Rothman and Lenard, 1977; Smith, 1978). An example of an
endoprotein is the erythrocyte membrane protein, spectrin (Smith,
1978).
The fluid mosaic model for membrane organisation
proposed that proteins would be mobile within the lipid matrix
of the membrane, and therefore with such movements the
7
Nicolson, 1972). It has often been found, however, that the
associations (lipid-lipid, lipid-protein, and protein-protein)
between components rendei. most if not all membranes non-random,
or heterogeneous, in short-range topography (Nicholson, 1977).
Nevertheless, many membrane proteins are free to move within
the plane of the membrane and assume a homogeneous or random
distribution. Definitive evidence for the mobility of proteins
within the membrane came from the experiments of Frye and
Edidin (1970). In their experiments they labelled the surface
antigens of mouse and human cells with different fluorescent dyes,
and then fused the cells with Sendai virus to form a hybrid.
They found that with time the human and mouse antigens, made
visible by fluorescence microscopy, had spread over the surface
of most of the hybrid cells. Their work validated the
Singer-Nicolson model for membranes by showing that these proteins were
able to translocate within the plane of the membrane.
1.7 Movement of proteins within the membrane
It is certain that free diffusion alone cannot
explain the ordering of cell-surface topography, especially the
long-range movements of proteins in the membrane (Nicolson, 1976).
Major factors affecting the movement of proteins within the plane
of the membrane include:-
1) the binding of a ligand to its cell membrane receptor. Such
binding can induce movement, or redistribution, of the
ligand-receptor complex within the membrane. The ligands most
extensive-ly studied are the lectins (plant proteins which bind to specific
carbohydrates on the cell surface) and antibodies to leucocyte
8
Redistribution of leucocyte surface immunoglobulin has been envisaged to be of some importance in vivo in that it could be a mechanism whereby leucocytes (especially lymphocytes) redistribute immunoglobulins to present a dense cluster of these molecules to other immuno-competent cells, thereby facilitating cell signalling, recognition and contact phenomena (Taylor et a/, 1971;
Nicolson, 1977).
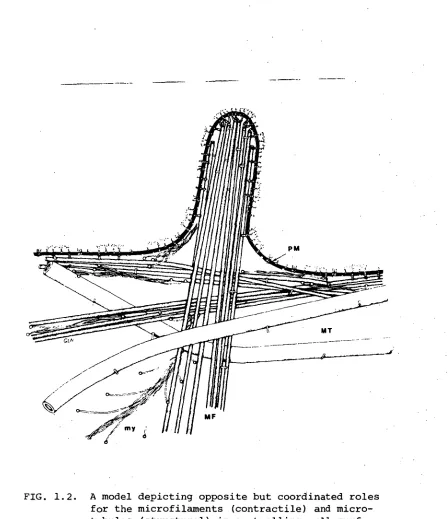
2) the cytoskeletal elements of the cell, in particular the microtubules and microfilaments. It is now established that cells can maintain a degree of topographic order within their - fluid membranes by virtue of trans-membrane associations
between proteins in the membrane and cytoplasmic cytoskeletal elements (Berlin et al, 1974; Edelman, 1976; Nicolson, 1976). These elements are located underneath the plasma membrane and include microtubules, microfilaments, intermediate filaments and possibly other filament-like structures, as illustrated in Figure 1.2. The interaction between the plasma membrane
proteins and the cytoskeletal elements has been studied by exposing cells to drugs known to impair the function of
microtubules or microfilaments, and observing the effect such treatment has upon the movement of.anti-immunoglobulin antibody or lectin-binding proteins within the plane of the membrane. These drugs can inhibit or stimulate to various degrees, and sometimes even reverse the redistribution of such surface receptors (Schreiner and Unanue, 1976).
9
This then allows the granulocyte to determine phagocytosable (internalizable) and transport (non-internalizable) sites (Ukena and Berlin, 1972; Berlin, 1975).
The work to be discussed in this thesis was prompted by the discovery of a plasma membrane location for the oxidase involved in the metabolic burst of granulocytes. In the light of reports of a role for the cytoskeletal elements in the control of plasma membrane phenomena, it seemed an opportune time to
study their possible role in the control of plasma membrane oxidase activity. This thesis describes those studies.
1.8 Outline of the Thesis
As explained above, the aim of this work was to examine the possible role of the cytoskeletal elements in the control of granulocyte plasma membrane oxidase activity. To begin these studies it was first necessary to devise an
improved method for the isolation of granulocytes from peripheral blood. This method is described in Section 2. Similarly,
in vitro techniques for quantitating the activity of the plasma membrane oxidase in intact cells had to be devised and standar-dized (Section 3). To prevent interference from the cytoplasmic
10
The effects of microtubule or microfilament disruption on
phagocy-tosis itself are also described in that section. In Section 6, the
effects of microtubule disruption on concanavalin A receptor
re-distribution were examined. Studies with the fluorescent membrane
probe, 1-anilino-8-naphthalene sulphonate, are detailed in Section
7. HMPS activity in resting (non-phagocytic) granulocytes after
exposure to agents disrupting microtubules or microfilaments was
examined and is described in Section 8. Electron microscopy was
used to study the location of the plasma membrane oxidase after
microtubule or microfilament disruption (Section 9). Finally,
in Section 10 the results and conclusions from these experiments
are discussed in relation to the published literature from
ECTOPROTEINS
EXTRACYTOPLASM C SIDE
nr\"
111 11\
Lu,
VUbl5TN
CYTOPLASMIC SIDE
[image:31.558.68.521.50.800.2]ENDOPROTEINS
FIG. 1.1. The arrangement of ectoproteins and endoproteins
within the membrane (adapted from Rothman and
Lenard, 1976). All of the proteins shown are
integral (embedded). The circles represent the
SECTION 2
SEPARATION OF GRANULOCYTES FROM
2.1 INTRODUCTION
Granulocytes are the most difficult of the leucocytes
to separate from peripheral blood. Their density is the greatest
of the leucocytes and it increases with the degree of maturation
of the cell (Zipursky et al, 1976). The density of the more
mature segmented granulocytes is similar to that of the
erythro-cyte (Tullis, 1952), making separation of the granuloerythro-cytes from
the erythrocytes the most difficult step in their isolation
from peripheral blood.
Relatively good yields of granulocytes can be obtained
from peripheral blood by simple sedimentation of whole blood
admixed with dextran or methylcellulose to aggregate the
erythrocytes (Skoog and Beck, 1956). The sedimentation rate of
the erythrocytes is increased by their aggregation but the
sedimentation of leucocytes is largely unaffected, and the
leucocytes can be harvested from the upper part of the tube after
erythrocyte sedimentation is complete. However, the gain in
yield using this method is outweighed by the impurity of the
final leucocyte preparation.
In 1964 Boyum employed, in a different way, the concept
of sedimenting erythrocyte aggregates to isolate the leucocytes.
In his modification the erythrocyte-aggregating agent was
mixed with a non-toxic compound of high density, sodium
metrizoate. The blood was then carefully layered on top of this
mixture, causing the erythrocytes to aggregate at the interface
and sediment to the bottom of the tube. The leucocytes remained
in the plasma layer above the interface because of the density
12
were the properties which made sodium metrizoate particularly
suit-Able forthis purpose (Day, 1970).
This work led into the best method to date for
separat-ing granulocytes from peripheral blood; a technique which was
also devised by Boyum. In this method the mononuclear leucocytes
were first removed from the blood by one centrifugation of diluted
blood layered onto a mixture of sodium metrizoate and a sucrose
polymer (Ficoll). Ficoll was chosen for this purpose because of
its relatively low viscosity and high solubility. The density of
the sodium metrizoate-Ficoll gradient was 1.077 g/ml, which allowed
the granulocytes to sediment to the bottom of the tube under one
centrifugation. In a second step the granulocytes were separated
from the erythrocytes by sedimentation employing dextran as an
erythrocyte-aggregating agent. The disadvantages of this
tech-nique are its relatively low yields of granulocytes, especially
in blood anticoagulated with heparin, and the erythrocyte
contamination of the final granulocyte preparation. This
feature (as discussed in section 2.4) makes the granulocyte
preparation unsuitable for functional studies. The aim of the
experiments described in this section was to devise an improved
method of isolating granulocytes from peripheral blood. In
addition the functional capacity of the isolated granulocytes
was examined with phagocytic, candidacidal and NBT-dye reduction
assays (see Dewar, 1978).
2.2 METHODS
2.2.1 Blood
was collected from 16 healthy adults for these studies.
2.2.2 Plasma
AB-Rh-negative plasma was obtained from the Red Cross
Blood Transfusion Service, Hobart, Tasmania. It was divided into
5 ml aliquots and stored at -20°C.
2.2.3 Isopaque-Ficoll density gradients (IFGs)
IFGs were prepared by mixing 30 ml Isopaque with 70 ml
Ficoll 0.09 g/ml, giving a gradient with a final density of
1.077 g/ml at 200C.
2.2.4 Dextran solution
Dextran was prepared as a 0.040 g/ml solution in
0.15 M sodium chloride.
2.2.5 HEPES-buffered physiologic saline solutions
A HEPES-buffered physiologic saline solution
containing Ca+2 and Mg+2 (HSS) was prepared for these experiments. In addition, Ca+2 free (CFH) and Ca+2 and Mg free (CMFH) +2
solutions were prepared and used where indicated (Appendix II).
2.2.6 Erythrocyte lysis
In preliminary experiments the technique of Craddock et a/
(1974) was used to lyse the contaminating erythrocytes in the
final step of granulocyte isolation. However this method
resulted in too much stroma from incompletely lysed erythrocytes,
and the stroma was impossible to separate from the granulocytes.
Therefore the erythrocyte lysing solution (ELS) of Goyle
(1968) was adopted and proved satisfactory. The ELS consisted
of isotonic NH
4C1 in Tris buffer, pH 7.4.
14
2.2.7 Total and differential leucocyte counts
Counts were performed according to the methods
out-lined in Dacie and Lewis (1968). At least 200 cells were counted
for total and 500 cells for differential leucocyte counts. In
addition, differential leucocyte counts of the final granulocyte
preparations, using slides prepared according to Hirsch and Cohn
(1960), were performed.
2.2.8 Buffy coat leucocytes
Buffy coat leucocytes were prepared by centrifuging
whole blood at 1000 x g for 15 min, collecting the buffy coat
and lysing the erythrocytes in ELS (Goyle, 1968). The granulocytes
were then washed in CFH once and resuspended in HSS to 25 x 106
cells/ml.
2.2.9 Phagocytic assay
Phagocytosis of polystyrene latex beads was measured
in a system consisting of 1.25 x 10 cells, 10% plasma, 6
and 50 x 106 polystyrene latex beads in a total volume of 500 pl
HSS. Phagocytosis was initiated by the addition of the beads and
promoted by end-over-end rotation (30 rpm) at 37 °C for 20 min.
It was terminated by adding 100 pl of 0.009 g/ml EDTA in 0.15 M
sodium chloride at 4 °C and centrifuging at 100 x g x 4 °C for
5 min to separate the uningested beads from the cells. The cell
pellet was used to prepare slides which were used to calculate
the number of cells containing 0, 1-5, 6-10, or >10 beads per
cell. At least 200 cells were counted from each slide.
2.2.10 Candidacidal assay
15
(1969), employing methylene blue to distinguish between viable
and nonviable intracellular yeast was used. The strain of
C. albicans used was originally obtained from the vaginal swab
of a patient. During the incubation the ratio of granulocytes:
Candida was 1:1, the volume 1.0 ml, and the final concentration
of added AB-Rh-negative plasma 25% v/v. Incubations were done
in triplicate using sterile technique. The reaction was stopped
after 60 min by the addition of 0.25 ml of sodium deoxycholate
(2.5%) which lysed the granulocytes without disturbing the
Candida. Methylene blue was added to facilitate the haemocyto-
meter counts of the number of viable and non-viable (blue-stained)
micro-organisms. At least 200 Candida were counted from each
sample tested and the percentage of stained micro-organisms was
determined. In addition, the ingestion and killing of the
Candida was monitored by electron microscopy (section 9.2.6.3).
2.2.11 NBT dye reduction test
A modification of Baehner and Nathan's technique (1968)
was used to quantitate NBT dye reduction as a measure of
cyanide-insensitive oxidative metabolism (Fridovich, 1974).
In this test all solutions were Millipore-filtered (0.45 pm) to
ensure a 'spontaneous' dye reduction test (Baehner and Nathan,
1968). The final test system contained between 6.25 x 10 5 and
1.25 x 10⁶ cells in a solution of 0.49 mM NBT, 1 mM KCN, 6.0 mM
glucose, 0.06 mM Ca2+ and Mg2+ in HSS to a final volume of
2.2.12 Calculating the recoveries of isolated granulocytes
2.2.12.1 Recoveries using the quotient G 1 /G 0
The recoveries were calculated by dividing the number
of granulocytes isolated from the gradients (G 1 ) by the number
of granulocytes applied to the gradients (G 0 ) and multiplying
by 100.
G
0 was determined from the total and differential
leucocyte counts and the volume of blood applied to the gradients.
At least 200 cells were counted in each half of the haemocytometer
chamber in calculating recoveries.
2.2.12.2 Recoveries calculated using Boyum's method
Boyum expressed his yield of granulocytes as
the number of granulocytes in the erythrocyte/granulocyte pellet
as a percentage of the total number of granulocytes found in the
tubes after separation (Boyum, 1968). The formula was not given
in his paper, but the formula for similarly calculating the yield
of mononuclear cells was supplied, and using the latter as a
guide the following formula was devised to express Boyum's method
of estimating yields:
100 x g, x m o - m2
g
o
ml m2where g 2 = percent granulocytes in the bottom fraction
g
0 = percent granulocytes in whole blood
ml = percent mononuclear cells in the top fraction
mo = percent mononuclear cells in whole blood
2.2.13 Isolation of granulocytes
• Using Boyum's method (1968) as a starting point, a
three-step procedure was devised for the isolation of granulocytes
from peripheral blood. In the first step, 2 ml of blood was mixed
with 4 ml of isotonic saline in siliconized test tubes (tubes
'A'). This blood plus 1 ml of saline washings from 'A' was layered
onto each 3 ml IFG at 20oC in siliconized polycarbonate test tubes ('B'). The loaded gradients were then centrifuged for 30 min at
20oC with a force of 400 x g at the blood - IFG interface.
The supernatant, containing plasma diluted with saline,
mononuclear cells, and IFG, was removed to within 1-2 mm of the
pellet (Fig. 2.1). The pellets containing the granulocytes and
erythrocytes were washed in 5 ml of CFH twice, and then mixed
with 2 ml AB-Rh-negative plasma. Dextran solution (3.0 ml) at
4oC was then added and the tubes gently mixed with a 5 ml
pipette, sealed, and allowed to sediment for 50 min at 4°C. After this time, the granulocyte-rich upper layer (Fig. 2.2) was removed
and the cells harvested by centrifugation in tubes 'C'. The cells
were washed once in CFH, and the erythrocytes lysed in ELS
(Goyle, 1968). The granulocytes were then collected by
centrifugation, washed in CFH, and resuspended in HSS at 25 x 106 cells/ml. The method is shown diagrammatically in Figure 2.3.
2.3 RESULTS
Sections 2.3.1 - 2.3.5 inclusive outline the results
of experiments preliminary to the adoption of the separation
procedure outlined in section 2.2.13.
2.3.1 Yield after 30 min or 40 min centrifugation
Pt
In Boyum's procedure the diluted blood was centrifuged
for 40 min on the IFGs, but it was suggested by Boyum that 30 min
may be sufficient if the procedure were to be used for granulocyte
isolation. Boyum also suggested however, that the change from
40 to 30 min would cause some erythrocyte and granulocyte
contamination of the mononuclear layer, and thus a slight drop
in the yield of granulocytes from the lower layer. In two
experiments where this was examined it was found that 30 min was
just as efficient in sedimenting the granulocytes as 40 min.
[Exp't 1: 2.5±0.2 x 10 6 granulocytes (40 min) versus 2.4±0.3
x 106 granulocytes (30 min) per IFG (3 IFGs). Exp't 2:• 3.2±0.1 x 10⁶ granulocytes (40 min) versus 3.2±0.2 x 10⁶
granulocytes (30 min) per IFG (3 IFGs)]. Therefore in
subsequent work a 30 min centrifugation of blood on IFGs was
adopted as the standard procedure.
2.3.2 Volume of plasma used in the dextran sedimentation step
Boyum used 1 ml of the heparinized, autologous plasma
found at the top of the tube after the centrifugation step as the
source of plasma for the dextran sedimentation (Fig. 2.1). When
1 ml of this diluted plasma was compared with 1 ml of
AB-Rh-negative plasma, it was found that the latter provided a more
efficient separation of granulocytes. Furthermore, 2 ml of
AB-Rh-negative plasma gave an improved yield over 1 ml (Table 2.1).
Increasing the volume of AB-Rh-negative plasma to 3 ml was of
no benefit (Table 2.1), therefore 2 ml of plasma was routinely
used.
19
2.3.3 Autologous versus AB-.Rh-negative plasma
On finding that whole AB-Rh-negative plasma provided a better separation of granulocytes than diluted autologous plasma
(section 2.3.2) it was reasoned that whole autologous plasma might be more efficient than AB-Rh-negative plasma. Centrifuging
the blood (as in section 2.2.8) to obtain the undiluted autologous plasma necessitated replacing the plasma with heparinized isotonic saline (10 IU/ml) to dilute the blood before separation on IFGs. This caused clumping of the reconstituted blood which interfered with the efficiency of the centrifugation (Table 2.2), as
measured by the numbers of granulocytes isolated. Therefore AB-Rh-negative plasma was used in all subsequent work.
2.3.4 Dexttan
2.3.4.1 Volume of dextran in the sedimentation step 8
In Boyum's procedure 0.4 ml of dextran, 0.045 g/ml in isotonic saline, is used with 1 ml of diluted autologous plasma in the sedimentation step. In two experiments where the volume of dextran was altered, it was found that the optimal volume for the dextran was 3.0 ml (Table 2.3).
2.3.4.2 Concentration of dextran
It was found that 0.040 g/ml and 0.045 g/ml were equally effective while 0.035 g/m1 dextran was not as
efficient in aggregation and sedimentation of the erythrocytes (Table 2.4). Therefore, 0.040 g/ml dextran was used in
20
2.3.4.3 Erythrocyte contamination of the granulocytes in the sedimentation
step
fi
Following Boyum's procedure, 0.4 ml dextran was used
in the sedimentation step and the erythrocyte contamination of
the upper granulocyte-rich layer varied from 32:1 to 66:1. When
3.0 ml dextran was used however, the erythrocyte contamination
was reduced to between 10 and 13 erythrocytes per granulocyte
(Table 2.5).
2.3.5 Inner diameter of the sedimentation step tube fi
Boyum suggested that performing the dextran sedimentation
in an 8.5 mm versus 13 mm inner diameter tube increased the yield
of granulocytes. In two experiments with 9 mm versus 15 mm inner
diameter tubes, no difference was found in the yield of
granulocytes [3.6±0.1 x 10⁶ granulocytes (15 mm) versus 3.5±0.1
x 106 granulocytes (9 mm) per IFG].
2.3.6 Viability
Viability of the isolated granulocytes as assessed by
Trypan Blue or Eosin Y dye exclusion was always > 98%.
2.3.7 Granulocyte functional tests
2.3.7.1 Phagocytic assay
The percentage of granulocytes which had ingested 0,
1-5, 6-10 or >10 polystyrene latex beads after 20 minutes was
the same whether the granulocytes had been isolated by the
procedure described in section 2.2.13 or as buffy coat (2.2.8)
21
2.3.7.2 Candidacidal assay
Buffy coat and isolated granulocytes were identical
in their ability to kill ingested C. albicans after 60 minutes
incubation (Table 2.7). Electron microscopical studies of the
assay confirmed that ingested Candida were being killed (Figure
2.4).
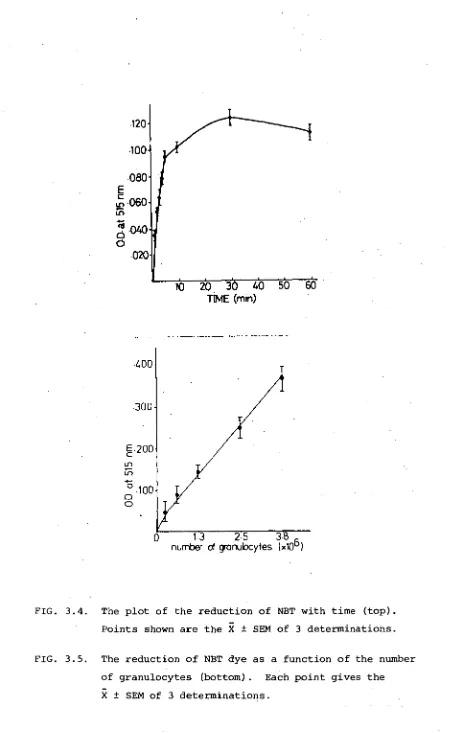
2.3.7.3 NBT dye reduction assay
The NBT dye reduction capacity of isolated granulocytes
was compared to that of buffy coat leucocytes from 4 samples.
Re-duction was identical in all cases except at 90 min, where the O.D.
of reduced dye from the buffy coat of sample 3 (Fig. 2.5) was
significantly different from that of the isolated granulocytes
from the same sample. When this test was repeated with cells
from the same individual 3 weeks later (3+, Figure 2.5), no
significant difference between granulocytes obtained from either
method could be found.
2.3.8 Differential counts of whole blood and isolated granulocytes
Differential counts of the peripheral blood (Table
2.8) showed that the granulocytes were mainly composed of
neutrophils (95.5±0.7%) with only 4.3±0.7% and 0.2±0.1% eosinophils
and basophils respectively. The isolated granulocytes showed
94.9±0.7% neutrophils which was not significantly less than in
the peripheral blood. Similarly the percentage of eosinophils
in the final preparation (3.8±0.6%) was not significantly less
than in the peripheral blood. However the percentage of basophils
in the preparation (1.1±0.3%) was significantly greater than in
2.3.9 Recoveries of isolated granulocytes
2.3.9.1 Recoveries using the quotient G1/G0 x 100
A mean of 70.9% of granulocytes applied to 8 gradients
was recovered using the technique in section 2.2.13 (Table 2.8).
2.3.9.2 Recoveries calculated using BOyum's method
Using the formula G1/G0 x 100 (section 2.2.12.1) a
mean of 69.5±2.4% of the granulocytes applied to 6 (of the original
8) IFGs was recovered. For these 6 samples full data was
obtained and therefore the formula
100 x g2 x mo
m2 (section 2.2.12.2)
g0 m l - m2
was also used to calculate the recovery of granulocytes.
With this formula the recovery rose to 79.1 -110.4% (Table 2.9).
2.3.10 Isolated granulocytes
The final granulocyte preparation is shown in
Figure 2.6
2.4 DISCUSSION
Using the two-step procedure Boyum was able to isolate
48.7% of the granulocytes from peripheral blood anticoagulated
with heparin (BOyum, 1968). He estimated the yield of granulocytes
by taking the number of granulocytes in the erythrocyte/granulocyte
fraction as a percentage of the total number of granulocytes
found in all fractions after separation. Using his method to
esti-mate the yield (section 2.2.12.2), and the improved separation
procedure described in section 2.2.13, a mean of 79.1 -110.4% of the
granulocytes was isolated from 6 peripheral blood samples.
23
calculate the recovery of granulocytes from the same 6 samples,
the yield was 69.5±2.4%. The discrepancy in recoveries is most
likely due to Boyum's inaccuracy of assuming that the total number
of granulocytes found in the tubes after separation is equal to
the number applied to the gradients. This assumption does not
take into account losses of granulocytes other than to the
mono-nuclear layer, for example, losses to glassware. Therefore
with Boyum's formula the yields can exceed 100% (Table 2.9). It
can be seen that Boyum's formula describes the efficiency of the
separation more accurately than it reflects the yield.
Neverthe-less, with the isolation procedure described in Section 2.2.13
a significant improvement in yields of granulocytes has been
achieved.
Several modifications of Boyum's technique were made
which may have contributed to the increased yields of
granulo-cytes. Firstly, collecting the saline washings from the tubes
used for dilution of whole blood ('A') minimized losses of cells
to glassware at that point. Secondly, washing the pellet from
hypertonic IFGs restored the density of the granulocytes and
may have made the sedimentation step more efficient. Thirdly, the
use of whole AB-Rh-negative plasma rather than diluted autologous
plasma (collected after separation on IFGs) was clearly
advantage-ous in the second step. The major losses of granulocytes occurred
during this step, when sedimenting aggregates of erythrocytes
trapped the granulocytes and prevented them from moving upward
into the plasma layer (Boyum, 1968). As the yields obtained with
whole plasma (70.9%) were similar to those obtained from
24
(Skoog and Beck, 1956), it was reasoned that undiluted plasma may
somehow have prevented the majority of granulocytes from being
sedimented with the erythrocytes. An attempt to further increase
the yield of granulocytes by using autologous plasma (saved from
centrifuging the blood) met with failure, however. The reason for
this is not clear, but it may be due to the observed clotting of
the centrifuged and then reconstituted blood. It can therefore
be concluded, in agreement with Boyum, that the separation is
hampered by using blood altered in any way other than by dilution.
In the second step, the increased volume, decreased
density and lowered temperature (4 °C) of dextran had a net effect
of slowing the sedimentation by 10 min and decreasing the
erythrocyte contamination. The lower erythrocyte contamination
was much easier to remove by lysis. Finally, allowing
sediment-ation to occur in the same tubes that were used for the IFGs
rather than transferring to new tubes had the effect of
eliminating another source of cell loss to glassware.
Examination of the final granulocyte preparation
showed the proportion of basophils therein to be significantly
greater than in peripheral blood. This discrepancy may be due
to the inaccuracy of determining the true percentage of the
small numbers of basophils in the blood films as opposed to the
concentrated final cell preparation. Alternatively, the
procedure may effectively isolate basophils, resulting in a
higher percentage of basophils in the final granulocyte
preparation.
25
this procedure because in early tests of granulocyte function the
erythrocytes were found to interfere. Granulocytes tended to clump
around crenated erythrocytes during extended incubations, and this
introduced inaccuracies in phagocytic and candidacidal assays where
granulocyte contact with beads or yeast, respectively, was required.
Analysis of the results of granulocyte function testing
showed the NBT dye reduction activity of buffy coat granulocytes
in sample 3 was significantly greater than that of isolated
granulocytes at 90 min. At the time of testing, monocytes
com-prised >15% of the buffy coat leucocytes in sample 3 and it was
assumed that the difference in dye reduction was due to the
mono-cytes which have been shown able to reduce the dye (Humbert et
al, 1973). This was confirmed when a repeat of the test 3 weeks
later showed no significant difference between buffy coat and
isolated granulocytes. The monocyte count at retesting was <4%.
2.5 SUMMARY
In this section, a method is described by which
granulo-cytes may be isolated from human peripheral blood. The yield of
granulocytes using this technique (70.9%) is considerably greater
than that obtained by alternative methods. The isolated cells are
mainly composed of neutrophils, but the ratio of eosinophils to
neutrophils is not significantly different from that of the
peripheral blood. The isolated cells are comparable to buffy
coat granulocytes with respect to phagocytic, candidacidal and
NBT dye reduction capacity and are representative of the
granulocyte population of whole blood. The purity of the final
FIG. 2.1 Blood which has been separated by centrifugation on
(top) an IFG. The fractions shown contain:-
(1) diluted autologous plasma
(2) mononuclear cells (lymphocytes, monocytes)
(3) IFG
(4) the pellet of granulocytes and erythrocytes
FIG. 2.2 The appearance of the blood after the erythrocyte-
(bottom) granulocyte pellet has sediminted for 50 minutes
in a mixture of AB-Rh-negative plasma and dextran.
The layers shown contain:-
(1) granulocyte-rich plasma/dextran with moderate
erythrocyte contamination
Diluted blood and washings from tubes 'A' layered onto IFGs in tubes 'B'
/
STEP 1 centrifugation 400g x 30 min x 20°C
Pellets washed twice, then plasma and dextran added and tubes mixed by vortex
/
STEP 2 sedimentation lg x 50 min x 4oC
Plasma removed into tubes 'C', then cells washed once and pelleted
/
STEP 3 lysis of erythrocytes 10 min x 4oC
[image:51.557.79.539.22.803.2]Final pellet washed once and resuspended to 25 x 106 granulocytes/ml
Fig. 2.3 The three step procedure for the isolation of granulocytes from peripheral blood, as described in detail in section 2.2.13,
FIG. 2.4 Electron micrographs of ingested Candida athicans
within the phagocytic vacuoles of isolated
granulo-cytes. Fusion of the granules with the membrane
of the vacuole is visible in the uppermost
micrograph (asterisks). The thick cell wall
surrounding the microorganism is evident in the
top and middle views (arrows). The bottom
micro-graph shows the remnants of a partially digested
microorganism, identifiable again by the thick
cell wall (arrow). Magnifications : top,
2
12,
•10,
ul
.08
it)
.06
.04
0
•02
ISOLATED GRANULOCYTES
.12
-10
.08
t • 06
ci
cs
.04
.02
0 20 40 60 80
BUFFY COAT LEUCOCYTES
[image:54.557.113.552.59.790.2]0 20 40 60 80
TIME (min)
FIG. 2.5. The NBT dye reduction capacity of isolated (top)
versus buffy coat (bottom) leucocytes. Sample 3 t
was a repeat (3 weeks later) of sample 3. Each
FIG. 2.6 The final isolated granulocyte preparation (two
views). Magnification top 1,250x, bottom
et,
11
0
TABLE 2.1 Volume of plasma used in the dextran sedimentation step
Volume (ml) Number of granulocytes (x10
6 )
recovered from IFGs ± SEM
Experiment 1 Experiment 2
1.0 a) 2.4 2.3 2.4 2.0 2.3 t 0.1
1.0 b) 2.8 2.5 2.1 2.6 2.5 ± 0.1
2.0 b) 3.5 3.1 3.0 3.6 3.3 ± 0.1
3.0 b) 3.7 3.6 3.0 3.1 3.4 ± 0.2
a)
1.0 ml diluted autologous plasma
b)
TABLE 2.2 Autologous versus AB-Rh-negative plasma
Autologous AB-Rh-negative
Expt. 1 Expt. 2 Expt. 1 Expt. 2
Granulocytes 2.9 2.2 3.4 3.2
isolated (x
per IFG
106) 2.6 2.4 3.5 3.6
± SEM 2.5 ± 0.1 3.4 ± 0.1*
* The difference between the two means is statistically significant
TABLE 2.3 Volume of dextran used in step 2
Volume (ml)
•
Number of granulocytes (x106 ) Isolated per IFG
± sEm
Experiment 1 Experiment 2
0.4 0.2 0.9 1.5 1.2 1.0 -±0.3a)
1.0 3.4 4.5 2.0 1.5 2.9
3.0 3.5 3.9 2.5 2.3 3.1±0.4c)
4.0 3.6 3.4 2.3 2.8 3.0 -±0.3d)
TABLE 2.4 Concentration of dextran used in step 2
Concentration (g/ml)
Number of granulocytes (x10 6 ) isolated per IFG
± SEM
Experiment 1 Experiment 2
0.035 2.4 2.7 2.3 2.1 2.5 2.4 ± 0.1 a)
0.040 2.7 2.8 2.5 2.3 2.6 2.6 ± 0.1
0.045 2.8 2.7 2.8 2.5 2.3 2.6 ± 0.1
a)
TABLE 2.5 Erythrocyte contamination of the granulocyte fraction
(after step 2) with 0.4 or 3.0 ml dextran
Volume Cells x 10
6
per IFG Ratio
(ml) Erythrocytes Granulocytes Erythrocytes:
granulocytes
0.4 a)
0.4 b)
3.0 a)
3.0
175.0
680.0
155.0
280.0
5.4
10.2
14.9
21.6
32:1
66:1
10:1
13:1
TABLE 2.6 Phagocytic assay. Percent granulocytes containing 0, 1 to 5, 6 to 10 or >10
beads per cell after 20 minutes
Number of latex beads per granulocyte
Sample 0 1 - 5 6-10 10
Buffy coat Isolated Buffy coat Isolated Buffy coat Isolated Buffy coat Isolated
cells cells cells cells
N.S N.S
1 2 3 4 ± SEM
P value
32.2
22.6
29.8
20.4
26.3±2.8
23.4 2.9
19.8 4.4
28.5 4.5
27.6 5.2
24.8±2.0 4.3±0.5
N.S N.S
5.3 4.9 5.9 4.3 5.1±0.3 5.1 7.3 4.7 5.2 5.6±0.6 15.0 6.3 5.7 5.9 8.2±2.3 59.8 65.7 61.0 69.2 63.9±2.2 56.3 69.0 59.9 62.2 61.9±2.7 Symbols
P value = probability value for each pair of means
TABLE 2.7 Candidacidal assay. Percent Candida organisms
killed after 60 minutes
Sample Buffy coat
leucocytes
Isolated granulocytes
5 27.5 29.4
6 19.7 16.5
7 31.2 38.2
8 45.4 42.4
± SEM 31.0±5.4 31.6±5.7
P value N.S.
Symbols
P value = probability value between the means
N.S. = the difference between the means is not
TABLE 2.8 Differential counts of whole blood and isolated granulocytes
and percent recoveries of granulocytes
Sample % Granulocytes % Neutrophils % Neutrophils % Eosinophils % Eosinophils % Basophils % Basophils % Recovery of
in whole blood in A in isolated in A in isolated in A in isolated Granulocytes
(A) granulocytes granulocytes granulocytes
1 48.8 98.1 97.8 1.9 1.5 0 0.4 66.1
2 55.8 94.4 94.9 5.6 4.2 0 0.9 70.2
3 32.0 95.5 93.9 4.4 3.2 0.1 2.7 63.0
4 41.6 94.0 93.0 6.0 5.1 0 1.9 70.3
5 47.2 93.4 94.4 6.5 5.2 0.1 0.4 80.2
6 41.1 94.5 93.4 5.2 6.0 0.3 0.5 67.2
7 52.3 95.0 93.5 4.1 4.3 0.9 1.8 77.9
8 35.3 99.1 98.3 0.7 1.2 0.2 0.5 72.2
C ± SEM 44.3±2.9 95.5±0.7 94.9±0.7 4.3±0.7 3.8±0.6 0.2±0.1 1.1±0.3 70.9±2.0
) value 0.10<P<0.20 0.10<P<0.20 P<0.01
Symbols for Table 2.8
Symbols for Table 2.9
0 • total number of granulocytes (x106) in the blood G
1 • total number of granulocytes (x106) )
g2 • percent granulocytes in the bottom fraction g0
•
percent granulocytes in whole blood
• percent mononuclear cells in whole blood 0
m2 • percent mononuclear cells in the bottom fraction 1 • percent mononuclear cells in the top fraction
a) using the quotient G1/G0 x 100 (section 2.2.12.1) b) using the formula from section 2.2.12.2:-
100 x g2
m0 - m2
TABLE 2.9 Calculating recoveries of granulocytes using the formulae
given in sections 2.2.12.1 and 2.2.12.2
Sample
0 G1 g 2 o mo m2 m1 percent
a)
recovery
percentb)
recovery
1 36.9 24.4 98.8 48.8 40.0 1.2 95.0 66.1 83.0
2 97.4 68.4 99.0 55.8 33.6 1.0 97.0 70.2 60.3
28.4 17.9 99.6 32.0 40.3 0.4 98.0 63.0 127.6
4 60.7 42.7 99.3 41.6 25.7 0.7 92.0 70.3 64.4
5 43.0 34.5 98.4 47.2 35.6 1.6 93.0 80.2 77.1
6 25.9 17.4 98.1 41.1 26.8 1.9 98.0 67.2 62.1