Testers? A Controlled Empirical Study
.
White Rose Research Online URL for this paper:
http://eprints.whiterose.ac.uk/96274/
Version: Submitted Version
Article:
Fraser, G., Staats, M., McMinn, P. et al. (2 more authors) (2015) Does Automated Unit Test
Generation Really Help Software Testers? A Controlled Empirical Study. ACM Transactions
on Software Engineering and Methodology, 24 (4). 23. ISSN 1049-331X
https://doi.org/10.1145/2699688
[email protected] https://eprints.whiterose.ac.uk/ Reuse
Unless indicated otherwise, fulltext items are protected by copyright with all rights reserved. The copyright exception in section 29 of the Copyright, Designs and Patents Act 1988 allows the making of a single copy solely for the purpose of non-commercial research or private study within the limits of fair dealing. The publisher or other rights-holder may allow further reproduction and re-use of this version - refer to the White Rose Research Online record for this item. Where records identify the publisher as the copyright holder, users can verify any specific terms of use on the publisher’s website.
Takedown
If you consider content in White Rose Research Online to be in breach of UK law, please notify us by
Does Automated Unit Test Generation Really Help Software Testers?
A Controlled Empirical Study
Gordon Fraser, Department of Computer Science, University of Sheffield, Regent Court, 211 Portobello
S1 4DP, Sheffield, UK [email protected]
Matt Staats, SnT Centre for Security, Reliability and Trust, University of Luxembourg, 4 rue Alphonse Weicker
L-2721 Luxembourg, Luxembourg, [email protected]
Phil McMinn, Department of Computer Science, University of Sheffield, Regent Court, 211 Portobello
S1 4DP, Sheffield, UK [email protected]
Andrea Arcuri, Certus Software V&V Center at Simula Research Laboratory, P.O. Box 134, Lysaker, Norway
Frank Padberg, Karlsruhe Institute of Technology, Karlsruhe, Germany
Work on automated test generation has produced several tools capable of generating test data which achieves high structural coverage over a program. In the absence of a specification, developers are expected to manually construct or verify the test oracle for each test input. Nevertheless, it is assumed that these generated tests ease the task of testing for the developer, as testing is reduced to checking the results of tests. While this assumption has persisted for decades, there has been no conclusive evidence to date confirming it. However, the limited adoption in industry indicates this assumption may not be correct, and calls into question the practical value of test generation tools. To investigate this issue, we performed two controlled experiments comparing a total of 97 subjects split between writing tests manually and writing tests with the aid of an automated unit test generation tool, EVOSUITE. We found that, on one hand, tool support leads to clear improvements in commonly applied quality metrics such as code coverage (up to 300% increase). However, on the other hand, there was no measurable improvement in the number of bugs actually found by developers. Our results not only cast some doubt on how the research community evaluates test generation tools, but also point to improvements and future work necessary before automated test generation tools will be widely adopted by practitioners.
Categories and Subject Descriptors: D.2.5 [Software Engineering]: Testing and Debugging General Terms: Algorithms, Experimentation, Reliability, Theory
This work is supported by a Google Focused Research Award on “Test Amplification”; the National Research Fund, Luxembourg (with grant FNR/P10/03); EPSRC grant EP/I010386/1, “RE-COST: REducing the Cost of Oracles in Software Testing”; and the Norwegian Research Council.
Permission to make digital or hard copies of part or all of this work for personal or classroom use is granted without fee provided that copies are not made or distributed for profit or commercial advantage and that copies show this notice on the first page or initial screen of a display along with the full citation. Copyrights for components of this work owned by others than ACM must be honored. Abstracting with credit is permitted. To copy otherwise, to republish, to post on servers, to redistribute to lists, or to use any component of this work in other works requires prior specific permission and/or a fee. Permissions may be requested from Publications Dept., ACM, Inc., 2 Penn Plaza, Suite 701, New York, NY 10121-0701 USA, fax+1 (212) 869-0481, or [email protected].
c
YYYY ACM 1049-331X/YYYY/01-ARTA $15.00
Additional Key Words and Phrases: Unit testing, automated test generation, branch coverage, empirical software engineering
1. INTRODUCTION
Controlled empirical studies involving human subjects are not common in software engineering. A recent survey by Sjoberg et al. [Sjoberg et al. 2005] showed that out of 5,453 analyzed software engineering articles, only 1.9% included a controlled study with human subjects. Buse et al., in their survey of 3,110 software engineering articles [Buse et al. 2011], highlight that specifically papers categorized as related to testing and debugging only rarely have user evaluations. Indeed, for software testing, several novel techniques and tools have been developed to automate and solve different kinds of problems and tasks. However, they have, in general, only been evaluated using surrogate measures (e.g., code coverage), and not with human testers—leaving unanswered the more directly relevant question:
Does technique X really help software testers?
This paper addresses this question in the context of automated white-box test gen-eration, a research area that has received much attention of late (e.g., [Fraser and Arcuri 2013; Harman and McMinn. 2010; McMinn 2004; Tillmann and de Halleux 2008; Tonella 2004]). When using white-box test generation, a developer does not need to manually write the entire test suite, and can instead automatically generate a set of test inputs that systematically exercise a program (for example, by covering all branches), and only need check that the outputs for the test inputs match those expected. Although the benefits for the developer seem obvious, there is little evidence that it is effective for practical software development. Manual test generation is still dominant in industry, and research tools are commonly evaluated in terms of code coverage achieved and other automatically measurable metrics that can be applied without the involvement of actual end-users.
In order to determine if automated test generation is really helpful for software testing in a scenario without automated oracles, we previously performed a controlled experiment involving 49 human subjects and three classes [Fraser et al. 2013]. This work extends this study with another, considerably larger controlled experiment includ-ing 48 human subjects and four classes. In each study, subjects were given one or two Java classes containing seeded faults and were asked to construct a JUnit test suite for each class either manually, or with the assistance of the automated white-box test generation tool EVOSUITE[Fraser and Arcuri 2013]. EVOSUITEautomatically produces JUnit test suites that target branch coverage, and these unit tests contain assertions that reflect the current behaviour of the class [Fraser and Zeller 2012]. Consequently, if the current behaviour is faulty, the assertions reflecting the incorrect behaviour must be corrected. The performance of the subjects was measured in terms of coverage, seeded faults found, mutation score, and erroneous tests produced. In total across both studies, 145 combinations of subjects and Java classes were used.
Our studies yield three key results:
(1) The experiment results confirm that tools for automated test generation are effective at what they are designed to do— producing test suites with high code coverage— when compared with those constructed by humans.
(2) The study doesnotconfirm that using automated tools designed for high coverage actually helps in finding faults. In our experiments, subjects using EVOSUITEfound the same number of faults as manual testers, and during subsequent mutation analysis, test suites did not always have higher mutation scores.
(3) Investigating how test suites evolve over the course of a testing session revealed that there is a need to re-think test generation tools: developers seem to spend most of their time analyzing what the tool produces. If the tool produces a poor initial test suite, this is clearly detrimental for testing.
These results, as well as qualitative feedback from the study participants, point out important issues that need to be addressed in order to produce tools that make automated test generation without specifications practicably useful for testing.
The rest of this paper is organized as follows. Section 2 introduces the common setup shared by the two empirical studies. In Sections 3 and 4, we present the results of each study. The initial study is presented first in Section 3, and the results of the larger study second in Section 4. In Section 5, we discuss the “why” of these results—particularly those from the second study, as it presents a larger pool of data—presenting selected additional analysis as needed. Section 6 goes into the details of the background and exit surveys completed by the subjects . Section 7 discusses the implications of our results on future work. Our study is then put into context with related work in Section 8. Finally, Section 9 concludes the paper.
2. STUDY DESIGN
The purpose of these studies was to investigate how the use of an automatic test gener-ation tool, when used by testers, impacts the testing process compared to traditional manual testing. Our studies were designed around a testing scenario in which a Java class has been developed and a test suite needs to be constructed, both to reveal faults in the newly created class and for later use in regression testing. We therefore designed our studies around the following research questions (RQs):
How does the use of an automated testing tool impact . . .
RQ1 The structural code coverage achieved during testing?
RQ2 The ability of testers to detect faults in the class under test?
RQ3 The number of tests mismatching the intended behaviour of the class?
RQ4 The ability of produced test suites to detect regression faults?
The goal of the second study was to replicate the results found in the initial study, in order to improve our confidence in the results. Accordingly, the design and imple-mentation of both studies are largely the same. Nevertheless, based on the results of the first study, we introduced small changes to improve the quality of the second study. Furthermore, to increase the number of data points available for analysis in the second study, participants were asked to perform both manual testing and tool-supported testing, and additional objects were used.
Below, we outline the study designs for both studies. In cases where the experimental design differs, we explicitly highlight such differences.
2.1. The Automated Testing Tool: EvoSuite
The automated testing tool used in our studies is EVOSUITE[Fraser and Arcuri 2013], which automatically produces JUnit test suites for a given Java class. As input it re-quires the Java bytecode of the class under test, along with its dependencies. EVOSUITE
supports different coverage criteria, where the default criterion is branch coverage over the Java bytecode. Internally, it uses a genetic algorithm to evolve candidate test suites according to the chosen coverage criterion, using a fitness function [Fraser and Arcuri 2013]. When EVOSUITEhas achieved 100% coverage or hits another stopping condition
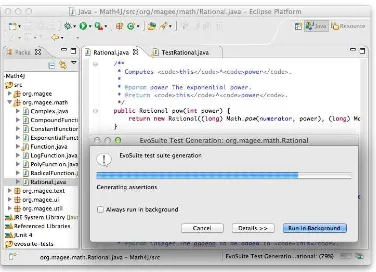
Fig. 1: The EVOSUITE Eclipse plugin, generating test cases for a
class—as used by subjects in the study.
As EVOSUITE assumes no specification, these assertions reflect theobserved be-haviour rather than theintendedbehaviour. The selection is based on mutation anal-ysis, and the assertions of the final test suite are minimized with respect to the set of mutants they can expose [Fraser and Zeller 2012]. The purpose of the assertions is to indicate to the testers what aspects of the program state are, for each test input, capable of detecting faults. They therefore act as guidelines for testers, from which correct assertions can (hopefully) be derived.
There exist several active paradigms for automatic test case generation. These ap-proaches typically differ in how the test oracle is constructed, and include: automatically inferring program invariants [Staats et al. 2012b; Wei et al. 2011]; automatically infer-ring parametrized test input assertions [Tillmann and Halleux 2008]; automatically producing concrete test input assertions (as is done by EVOSUITE) [Fraser and Arcuri 2011; Staats et al. 2012a]. Currently, there is no scientific consensus which approach is preferable, and in practice all of these approaches appear to be used infrequently by industry.
From these approaches, we have selected EVOSUITEas a representative example of a modern approach for test case generation based on generating concrete test input asser-tions. Our results may not generalize to other paradigms of automated test generation (e.g., those based on parametrized test inputs or program invariants). Nevertheless, we note that all of these approaches require the user to correct generated test oracles, and we therefore believe that our results will generalize at least somewhat to other approaches.
For large scale experimentation, EVOSUITE can be used as a command-line tool. However, for our experiment, the Eclipse plugin was used (shown in Figure 1), with which the user can produce a test suite for a class by right-clicking its name in the project explorer. The Eclipse plugin usually only exposes two of EVOSUITE’s many available configuration properties. However, in our experiments these were fixed: the time for test generation was set to one minute (this does not include time spent for minimization or assertion generation), and assertion generation was enabled.
2.2. Study Subject and Object Selection
Running an empirical study involving human subjects leads to several challenges and possible pitfalls. Guidelines exist in the literature to help researchers to carry out such type of studies (e.g., see [Kitchenham et al. 2002; Seaman 1999]). A common problem with controlled empirical studies is that, due to their cost and complexity, they are often limited in size. This reduces the power of the statistical analyses. For example, the studies surveyed by Sjoberg et al. [Sjoberg et al. 2005] involved between 4 and 266 participants (49 on average). Of these participants, 87% were students. Furthermore, in 75% of the cases, the applications used in the experiments were constructed for the sole purpose of running those experiments.
2.2.1. Object Selection: Initial Study .We restricted our experiment to three Java classes to increase the likelihood of observing statistically significant effects in our initial study. The classes were chosen manually, based on the following criteria:
(1) EVOSUITEshould be able to generate test suites with high coverage, as addressing
cases where test generation struggles [Fraser and Arcuri 2012b] is an ongoing research area. This excludes all classes with I/O dependencies and classes using Java Generics.
(2) The source code documentation needs to be sufficient to serve as a specification. In particular, we required JavaDoc comments for all methods of the class.
(3) The classes should be non-trivial, yet feasible to reasonably test within an hour. The classes should not require the subjects to learn and understand complicated algorithms. In particular, we considered classes with fewer than 50 lines of code or classes without conditional expressions as too easy. Furthermore, each class file should only involve one class definition (i.e., the class should not involve member classes).
(4) The classes should be understandable without extensively examining other classes in the same library. Notably, there should be neither many dependencies nor complex inheritance hierarchies.
(5) The classes should represent different types of applications and testing scenarios. In particular, we aimed to include one numeric class and one class dependent on string inputs.
We investigated the libraries used in our earlier experiments [Fraser and Arcuri 2013; Lakhotia et al. 2010], and identified a set of 25 candidate classes largely matching our criteria from the NanoXML, Commons CLI, Commons Math, Commons Collections, java.util, JDom, Joda Time and XOM libraries. We then identified several candidate classes of appropriate difficulty by first writing test suites for them ourselves, and ran a pilot study with volunteer subjects (who were not included later in the main
experiment) on Commons CLIOption, Commons MathFraction, and XOMAttribute.
Seeing that even seasoned programmers required significantly longer than an hour for
FractionandAttribute, we replaced these classes with the similar but simplerRational
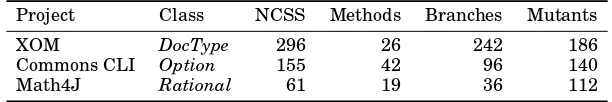
Table I: Study objects for first empirical study
“NCSS” refers to the number of non-commenting source statements reported by JavaNCSS
(http://www.kclee.de/clemens/java/javancss), “Branches” is the number of branches reported by EVOSUITE, while “Mutants” is the number of mutants created by the MAJOR tool [Just et al. 2011].
Project Class NCSS Methods Branches Mutants
XOM DocType 296 26 242 186
Commons CLI Option 155 42 96 140
Math4J Rational 61 19 36 112
Details of the classes used in the experiment can be found in Table I. XOM is a
tree-based API for processing XML documents (http://www.xom.nu), withDocType
representing an XML document type declaration, which appears at the header of an XML file (e.g., “<!DOCTYPE html>”), potentially giving further details regarding a
DTD.Optionis part of the Apache Commons CLI API (http://commons.apache.org/cli)
for parsing common line options passed to programs. The class represents a single command-line option (e.g., “-a”, “--all”, “--param <value>”, etc.), including its short name, long name, whether a parameter is mandatory, and a short accompanying descriptor. Finally,Rational, from the Math4J project (http://math4j.sourceforge.net), represents a rational number.
Andrews et al. [Andrews et al. 2005] argue that mutation faults can be representative of real faults, and that hand-seeded faults present validity issues for studies that investigate fault detection. For this reason, we applied mutation analysis to obtain a series of faults to use throughout our experiments; as have other authors, for example Do and Rothermel [Do and Rothermel 2006] in their study of test case prioritization for regression faults. Each Java class was injected with five faults prior to the experiment using the MAJOR [Just et al. 2011] mutation analysis tool. In order to ensure a range of different types of mutants, we used the following procedure to select injected faults: For each of the classes, we used EVOSUITEto produce 1,000 random test cases with assertions. We then calculated the number of test cases killing each mutant produced by MAJOR (i.e., an assertion generated by EVOSUITEfails), thus estimating the difficulty of killing the mutant. Next, we partitioned all killed mutants into five equally sized buckets of increasing difficulty of being killed. From each of these buckets, we randomly selected one mutant, while prohibiting the selection of multiple mutants in the same method. All five selected mutants were applied to the class, producing the faulty version given to the subjects. See Appendix A for details of the actual faults.
2.2.2. Object Selection: Replication Study . As noted previously, for the second study par-ticipants were asked to conduct two study sessions, one with manual testing and one with tool-assisted testing. (This is described further in Section 2.2.4.) This increase in the number of study sessions allowed us to add another object, for a total of four. However, as the second study was designed primarily as a replication study, we elected to maintain largely the same set of objects.
We used four classes in the replicated experiment. We reused the Commons CLI
Optionand Commons MathFractionclasses, as is, from the first experiment. We also
reused the XOMDocTypeclass, with changes made to correct a classpath issue found in the initial study. (This issue is outlined later in Section 3.) Finally, we added a new class, which was selected using the same selection procedure as for the original experiment.
We selectedArrayIntListfrom the Commons Primitives open source library, as
con-tainer classes are very commonly found in experimentation in the software engineering literature. The class represents a list implemented with an array, which unlike the
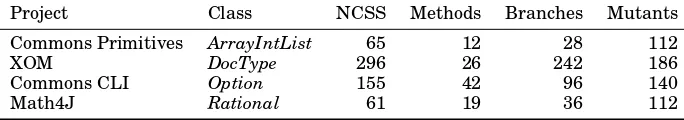
Table II: Study objects for replicated empirical study
“NCSS” refers to the number of non-commenting source statements reported by JavaNCSS
(http://www.kclee.de/clemens/java/javancss), “Branches” is the number of branches reported by EVOSUITE, while “Mutants” is the number of mutants created by the MAJOR tool [Just et al. 2011].
Project Class NCSS Methods Branches Mutants
Commons Primitives ArrayIntList 65 12 28 112
XOM DocType 296 26 242 186
Commons CLI Option 155 42 96 140
Math4J Rational 61 19 36 112
array list implementation in the Java standard library uses primitiveintvalues rather than objects. We made one modification to this class: in Java, serialization behavior of
classes can be modified by providing methodsreadObjectandwriteObject. However,
these are private methods, and cannot be called directly; instead, one needs to pass the objects to an object stream where native code calls these methods. As this may not be standard knowledge and the methods would be trivially covered, we removed these two methods from the class. Mutants of this class were created using the same procedure as for the original set of classes (see Appendix A for details of the chosen mutants).
2.2.3. Subject Selection and Assignment: Initial Study.In our initial study, email invitations to participate were sent to industrial contacts, as well as students and post-doctoral re-search assistants in the Department of Computer Science at the University of Sheffield. Due to physical laboratory space restrictions, only the first 50 people who responded were allowed to participate. One person failed to attend the experiment, leaving a total of 49, of which five were industrial practitioners and 44 from the Computer Science department. Of the five industrial developers, one was a Java programmer while the other four were web developers from a local software company. Of the 44 subjects from the Computer Science department, two were post-doctoral research assistants, eight were PhD students and the rest were second year or higher undergraduate students. Each subject had prior experience with Java and testing using JUnit (or similar, i.e., xUnit for a different programming language).
Before starting the experiment, we produced a fixed assignment of subject ID to class and technique, so that we had roughly the same number of subjects for each class and technique pairing. We assigned successive subject IDs to the computers in the lab, so that any two neighbouring subjects would be working on different classes with different techniques. Subjects freely chose their computers before any details of the study were revealed. Each subject was paid 15 GBP for their time and involvement.
2.2.4. Subject Selection and Assignment: Replication Study.To ensure that a sufficient num-ber of data points were produced we arranged three sessions of the study, each with 16 different participants for a total of 48 participants. The participants were selected from the pool of students in the Department of Computer Science at the University of Sheffield, excluding all students that already participated in the first study. Students were invited by email, and invitations were given on a first-come-first-serve basis.
Selection and assignment of subjects was performed similarly in the second study, with one key difference. To further increase the number of data points collected in our
second study, each participant performed two experiments—one with EVOSUITEand
to 30 GBP. This also had the benefit that the students’ willingness to participate was increased from the first study.
As with the initial study, the classes and treatments were assigned to work places be-fore the experiment, and participants were free to choose their computer. Experiments were started by the participants by clicking on desktop icons labeled “Tutorial”, “Ex-periment 1”, and “Ex“Ex-periment 2”, and all printed ex“Ex-perimental material was contained in unlabeled folders on these workplaces to prevent participants from choosing their laptop based on the treatment. We assigned treatments such that no two neighboring participants would be using the same treatment, i.e., every participant using EVOSUITE
would have two neighbors doing manual testing. We also made sure that no two neigh-bors would be testing the same class at the same time. Furthermore, the assignment made sure that we would get the same number of data points for all classes/treatments.
To avoid learning effects we also carefully selected all variations of the order in which treatments are applied. Specifically, for each pair of classes X andY, we aimed to have the same number of participants first testing classX with EVOSUITEfollowed by classY with manual testing; classX with manual testing followed by classY with EVOSUITE; classY with EVOSUITEfollowed by classXwith manual testing; and class Y with manual testing followed by classX with EVOSUITE. This assignment was done
manually.
2.3. Experiment Process
In both studies, each subject received an experiment pack, consisting of their subject ID, a statement of consent, a background questionnaire, instructions to launch the ex-periment, and an exit survey. In the initial study, the pack contained a sheet describing their target Java class and whether the subject was asked to test manually or using EVOSUITE. For those testing with EVOSUITE, the pack included further instructions on launching the EVOSUITEplugin. In the second study, small changes reflecting differ-ences in the study designs were made. For example, sheets describing both Java classes were used, the exit survey was updated to reflect that both treatments were done by each participant, etc.
Before commencing the experiment, each subject was required to fill in the question-naire based on their background and programming experience, such that we would receive responses about the background knowledge that are not influenced by the following tutorial session.
In both studies, subjects were presented with a short tutorial of approximately 15 minutes, which provided a refresher of JUnit annotation syntax, along with the different assertion types available, and their various parameters. The tutorial further included screencasts demonstrating the use of Eclipse and the EVOSUITEtool. The slides of the
presentation were made available as individual crib sheets for reference during the study.
Subjects were given a short warm-up exercise to reacquaint themselves with Eclipse and JUnit, and to become familiar with the EVOSUITEplugin. The exercise consisted of an artificial ATM example class, including an intentional bug highlighted with code comments. Subjects were asked to write and run JUnit test cases, and to produce test suites with the EVOSUITE plugin. During this exercise, we interacted with the
subjects to ensure that everybody had sufficient understanding of the involved tools and techniques.
After a short break the study commenced. To initiate the experiment, each subject entered their subject ID on a web page, which displayed a customized command to be copied to a terminal to automatically set up the experiment infrastructure (this process was also used for the tutorial example). In the initial study, the experimental infrastructure consisted of:
— Sun JDK 1.6.0-32 — Eclipse Indigo (3.7.2)
— The EVOSUITEEclipse plugin
— An Eclipse workspace consisting of only the target project, with the class under test opened in the editor. The workspace for subjects performing manual testing was opened with an empty skeleton test suite for the target class.
All subjects used machines of roughly the same hardware configuration, booting Ubuntu Linux. As such, the technical setting for each individual subject was identical. The replication of the experiment was performed in the “iLab” of the Information School at the University of Sheffield, a laboratory dedicated to usability testing and experiments. The lab offers 16 identical modern laptop computers running Windows 7. The setup of these machines was similar to the setup in the original experiment, although we used updated versions of software:
— Oracle Java SE Development Kit 7u45 — Eclipse Kepler (4.3.1)
— An updated version of the EVOSUITEEclipse plugin
The version of EVOSUITEin the second study differed only in terms of bugfixes; no
new features compared to the version of the initial study were activated.
The stated goal was to test the target class as thoroughly as possible using the time available, referring to its project JavaDoc documentation for a description of its intended behaviour. Subjects were not given a code coverage tool to measure the coverage achieved, as we desired a natural code testing process. We felt the addition of code coverage tooling might encourage testers to achieve higher code coverage than they typically would during testing. Furthermore, not all subjects might be familiar with the use of code coverage tools, which would potentially bias the results further.
We did not reveal the number of faults in a class to the subjects, but instructed subjects that test cases which reveal a fault in the class under test should fail. Subjects were told not to fix any of the code, unless the changes were trivial and eased the discovery of further faults.
When using EVOSUITE, subjects were asked to start by producing a test suite using
the plugin, and to edit the test cases so that they would fail if they revealed a fault on the class. They were also instructed to delete tests they did not understand or like, and to add new tests as they saw fit. As EVOSUITEuses a randomized search, each subject
using it began with a different starting test suite. Furthermore, subjects working with EVOSUITEhad to spend some of their time waiting for its results.
We modified Eclipse so that each time the test suite was run (initiated by a button-click), a copy of the test suite was saved for later analysis (presented in the following sections).
In each study session, subjects were given one hour to complete the assignment, and we asked them to remain seated even if they finished their task before the time limit. To be considered “finished”, we required them to be certain that their test cases would a) cover all the code and b) reveal all faults. All subjects continued to refine their test suite until within 10 minutes of the end of study, as evidenced by the recorded test suite executions. In the second study, a short break was given between study sessions.
2.4. Analysis of Results
Each study session resulted in a sequence of test suites, with each new test suite saved whenever the subject executed it via Eclipse. These sequences are used to conduct our analysis, with the final test suite produced by each subject being of particular interest. For each test suite produced, we computed several metrics, specifically: statement, branch, and method coverage (using Cobertura1); the number of tests which fail on the original, correct system; the number of faults detected; the mutation score; and number of (non-assertion) statements and assertions present in each test.
These statistics form the base from which subsequent statistical analysis is done and our research questions are addressed. Statistical analysis was performed using the
scipyandnumpyPython frameworks and the R statistical toolset.
To determine which of the five individual study faults were detected by the test suites, for each class, each corresponding fault was used to a create a separate version of that class. This results in a total of six versions of each class for the analysis (five incorrect and one correct). In the subsequent analysis we refer to the correct version as the
originalversion of the class. We then determined, for each faulty version of a class, if
there exists a test which passes on the correct class, but fails on the faulty version. The mutation score was computed by running the test suite using the MAJOR mutation framework, which automates the construction of many single-fault mutants and computes the resulting mutation score, i.e., the percentage of mutants detected by the test suites [Just et al. 2011]. Tests which fail on the correct system are ignored and do not count towards the mutation score. (This was facilitated by modifications to MAJOR performed by the tool’s author.) Note that these failing tests are still included when calculating coverage.
Finally, the number of statements and assertions was computed using automation constructed on top of the Eclipse Java compiler.
2.5. Threats to Validity
External: Many of our subjects are strictly students, and do not have professional
development experience. However, analysis of the results indicated subjects did not appear to vary in effectiveness according to programmer experience or student/profes-sional status. Furthermore, we see no reason why automatic test generation should be useful only to developers with many years of experience.
The classes used in our study were not developed by the subjects and may have been unfamiliar. However, in practice developers must often test the code of others, and as previously discussed, the classes chosen were deemed simple enough to be understood and tested within the time allotted through pilot studies. This is confirmed in the survey, where we asked subjects if they felt they had been given enough time for the experiment. In the initial study, only three subjects strongly disagreed about having enough time, whereas 33 subjects stated to have had enough time; there was no significant difference between EVOSUITEusers and manual testers on this question, indicating there was sufficient time for both groups. Additionally, the classes selected were relatively simple Java classes. It is possible more complex classes may yield different results. As no previous human studies have been done in this area, we believe beginning with small scale studies (and using the results to expand to larger studies) is prudent. Nevertheless, we acknowledge that our results may not perfectly generalize to scenarios where developers are also testers, and we hope to explore the impact of code ownership on testing in the future.
1Note that Cobertura only counts conditional statements for branch coverage, whereas the data given in
Table I lists branches in the traditional sense, i.e., edges of the control flow graph. See [Li et al. 2013] for a discussion of the perks of bytecode-based coverage measurement.
Our study uses EVOSUITEfor automatic test generation. It is possible that using different automatic test generation tools may yield different results. Nevertheless, EVO
-SUITEis a modern test generation tool, and its output (both in format and structural test coverage achieved) is similar to the output produced by other modern test generation tools, such asRandoop[Pacheco and Ernst 2007],eToc[Tonella 2004],TestFul[Baresi
et al. 2010],Java PathFinder[Pasareanu and Rungta 2010],Dsc[Islam and Csallner
2010],Pex[Tillmann and de Halleux 2008],JCrasher[Csallner and Smaragdakis 2004], and others.
Internal:Extensive automation is used to prepare the study and process the results,
including automatic mutation tools, tools for automatically determining the faults detected over time, tools measuring the coverage achieved by each test suite, etc. It is possible that faults in this automation could lead to incorrect conclusions.
To avoid a bias in the assignment of subjects to objects we used a randomized assignment. Subjects without sufficient knowledge of Java and JUnit may affect the results; to avoid this problem we only accepted subjects with past experience (e.g., all undergraduates at the University of Sheffield learn about JUnit and Java in the first year), as confirmed by the background questionnaire, and we provided the tutorial before the experiment. In addition, the background questionnaire included a quiz question showing five JUnit assertions, asking for each whether it would evaluate to true or to false. On average, 79% of the answers were correct, which strengthens our belief that the existing knowledge was sufficient for the experiment. As participants had to fill in the background survey before the experiment, there is the threat that identifying demographic information prior to a task and conducting that task in the presence of other people can impact performance [Inzlicht and Ben-Zeev 2000]. However, as the tutorial we gave to participants would potentially influence the answers given we wanted to have unbiased responses to the questionnaire. A further threat to internal validity may result if the experiment objectives were unclear to subjects; to counter this threat we thoroughly revised all our material, tested it on a pilot study, and interacted with the subjects during the tutorial exercise to ensure they understood the objectives. As each subject only tested one class with one technique, there are no learning effects that would influence our results in the first experiment; in the replication each subject tested two different classes with different treatments to avoid or minimize possible learning effects.
Construct: We used automatically seeded faults to measure the fault detection
ability of constructed test suites. While evidence supports that the detection of the class and distribution of faults used correlates with the detection of real world faults [Andrews et al. 2005], it is possible the use of faults created by developers may yield different results.
Conclusion:We conducted our initial study using 49 subjects and three Java classes.
Thus for each combination of testing approach (EVOSUITEand manual) and Java class, six to nine subjects performed the study. The second study consisted of 48 subjects and four Java classes. This is a relatively small number of subjects, but yields sufficient statistical power to show an effect between testing approaches. Furthermore, the total number of test suites created over the course of the study is quite high (over 1000), easily sufficient for analysis examining the correlations between test suite characteristics and fault detection effectiveness.
3. RESULTS: INITIAL STUDY
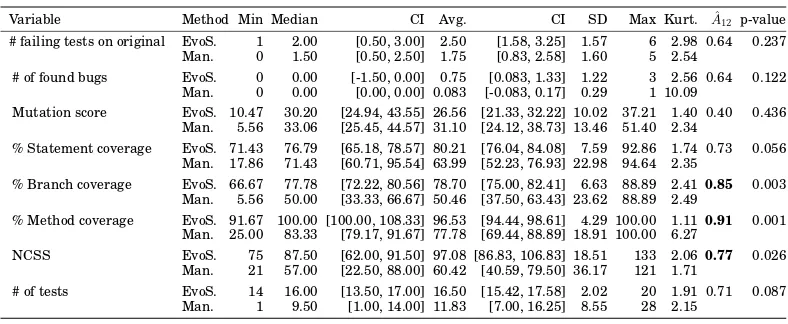
Table III: Results of the first study
For each property, we report several statistics on the obtained results, like minimum values, median, average, standard deviation, maximum and kurtosis. For some properties (i.e., median and average), we calculated confidence intervals (CI)
using bootstrapping at 95% significance level. For each property, we calculated theAˆ
12effect size of EVOSUITE(EvoS.)
compared to Manual (Man.). We also report the p-values of a Wilcoxon-Mann-Whitney U-tests. Statistically significant effect sizes are shown in bold.
(a)Option
Variable Method Min Median CI Avg. CI SD Max Kurt. Aˆ
12 p-value
# failing tests on original EvoS. 3 7.50 [3.00, 12.00] 8.50 [4.75, 11.75] 5.48 20 3.53 0.97 0.001 Man. 0 1 [0.00, 2.00] 1.22 [0.33, 2.00] 1.30 4 3.28
# of found bugs EvoS. 0 0.00 [-1.00, 0.00] 0.38 [-0.12, 0.75] 0.74 2 3.86 0.31 0.165 Man. 0 1 [1.00, 2.00] 0.89 [0.22, 1.44] 0.93 3 4.12
Mutation score EvoS. 44.44 51.69 [48.31, 54.37] 51.46 [49.13, 54.01] 3.78 55.66 2.45 0.65 0.321 Man. 0.00 37.50 [12.93, 56.82] 37.82 [24.97, 51.23] 21.75 64.10 2.00
% Statement coverage EvoS. 86.36 91.82 [91.82, 95.45] 90.68 [89.43, 92.27] 2.21 92.73 2.79 1.00 0.001 Man. 15.45 41.82 [31.82, 58.18] 37.98 [29.70, 46.36] 13.80 60.00 2.18
% Branch coverage EvoS. 80.00 85.71 [82.86, 88.57] 85.36 [83.57, 87.32] 2.93 88.57 2.40 1.00 0.001 Man. 4.29 21.43 [12.86, 32.86] 20.95 [15.08, 27.14] 9.95 35.71 2.13
% Method coverage EvoS. 90.48 94.05 [92.86, 95.24] 93.75 [92.56, 94.94] 1.77 95.24 2.26 1.00 0.001 Man. 9.52 40.48 [16.67, 57.14] 42.06 [29.37, 54.76] 20.62 73.81 2.03
NCSS EvoS. 369 418.50 [401.00, 457.50] 409.25 [390.38, 428.38] 29.08 444 1.46 1.00 <0.001
Man. 17 72 [30.00, 110.00] 67.56 [43.22, 90.11] 38.58 134 2.09
# of tests EvoS. 45 47.50 [47.00, 49.00] 47.12 [46.25, 48.00] 1.36 49 1.82 1.00 0.001 Man. 4 8 [-13.00, 11.00] 14.56 [7.33, 20.89] 11.13 35 2.26
(b)Rational
Variable Method Min Median CI Avg. CI SD Max Kurt. Aˆ
12 p-value
# failing tests on original EvoS. 1 5 [2.00, 9.00] 5.14 [2.29, 7.71] 3.98 12 2.25 0.70 0.289 Man. 0 2 [-4.00, 4.00] 2.80 [0.00, 5.20] 3.35 8 2.13
# of found bugs EvoS. 0 2 [0.00, 3.00] 2.29 [1.29, 3.29] 1.50 4 1.85 0.43 0.738 Man. 0 3 [2.00, 6.00] 2.60 [1.40, 4.00] 1.67 4 2.13
Mutation score EvoS. 5.56 66.35 [53.06, 77.14] 60.62 [45.94, 80.72] 26.19 85.19 4.01 0.37 0.530 Man. 64.29 75.49 [73.10, 86.69] 73.71 [70.40, 78.65] 5.47 77.88 2.89
% Statement coverage EvoS. 94.59 100.00 [100.00, 105.41] 98.07 [96.53, 100.00] 2.57 100.00 1.55 0.79 0.109 Man. 72.97 97.30 [97.30, 121.62] 91.35 [85.41, 101.08] 10.54 97.30 2.99
% Branch coverage EvoS. 80.00 90.00 [90.00, 95.00] 87.14 [85.00, 90.00] 3.93 90.00 2.36 0.64 0.431 Man. 70.00 85.00 [80.00, 100.00] 83.00 [77.00, 90.00] 8.37 90.00 2.13
% Method coverage EvoS. 94.74 100.00 [100.00, 105.26] 98.50 [96.99, 100.75] 2.57 100.00 1.90 0.91 0.014 Man. 57.89 94.74 [94.74, 131.58] 85.26 [75.79, 100.00] 15.96 94.74 2.82
NCSS EvoS. 68 105.00 [96.00, 117.00] 109.75 [84.50, 128.25] 34.33 187 4.55 0.52 0.948 Man. 63 103.50 [72.50, 137.50] 102.50 [79.50, 124.17] 31.13 147 1.79
# of tests EvoS. 11 16.50 [12.00, 19.00] 18.25 [13.25, 22.00] 6.96 34 4.49 0.39 0.517 Man. 14 18.50 [13.00, 22.50] 19.00 [15.83, 22.17] 4.34 25 1.65
(c) DocType
Variable Method Min Median CI Avg. CI SD Max Kurt. Aˆ
12 p-value
# failing tests on original EvoS. 0 2.00 [0.00, 2.00] 2.50 [1.50, 3.50] 1.51 5 2.61 0.83 0.026 Man. 0 0.00 [-1.00, 0.00] 0.75 [-0.25, 1.38] 1.39 4 4.97
# of found bugs EvoS. 1 1.00 [1.00, 1.00] 1.00 [1.00, 1.00] 0.00 1 NaN 0.50 <0.001
Man. 0 1.00 [0.00, 2.00] 1.00 [0.50, 1.50] 0.76 2 2.00
Mutation score EvoS. 30.00 45.31 [36.66, 52.16] 46.65 [38.46, 53.81] 11.96 70.13 3.11 0.22 0.065 Man. 41.67 55.95 [44.68, 63.66] 56.50 [50.86, 62.37] 8.87 67.69 2.17
% Statement coverage EvoS. 21.93 32.09 [25.13, 36.90] 32.75 [27.94, 37.30] 7.15 44.39 2.18 0.37 0.399 Man. 25.13 37.97 [35.83, 48.66] 36.16 [31.68, 40.91] 7.07 46.52 2.17
% Branch coverage EvoS. 6.92 12.69 [3.85, 18.46] 14.90 [9.90, 19.52] 7.47 27.69 1.99 0.19 0.040 Man. 16.15 21.92 [15.38, 26.15] 23.94 [18.37, 28.27] 7.82 40.77 3.76
% Method coverage EvoS. 57.69 76.92 [73.08, 92.21] 75.00 [68.27, 82.21] 11.07 92.31 2.33 0.70 0.178 Man. 57.69 73.08 [69.23, 88.27] 70.19 [65.87, 75.96] 7.90 76.92 2.24
NCSS EvoS. 73 101 [82.00, 114.00] 103.71 [88.71, 117.86] 21.40 136 1.98 0.60 0.562 Man. 40 81.50 [25.00, 117.50] 88.00 [59.38, 116.25] 43.63 147 1.45
# of tests EvoS. 12 17 [13.00, 20.00] 17.57 [14.71, 20.43] 4.16 23 1.51 0.62 0.449 Man. 9 13.50 [2.00, 16.00] 16.12 [11.38, 20.25] 6.90 28 2.16
EvoS uite Man ual EvoS uite Man ual EvoS uite Man ual 20 40 60 80 100 S ta tm e n t C o ve ra g e (% )
Option Rational DocType
(a) Statement Coverage
EvoS uite Man ual EvoS uite Man ual EvoS uite Man ual 0 20 40 60 80 B ra n ch C o ve ra g e (% )
Option Rational DocType
(b) Branch Coverage
EvoS uite Man ual EvoS uite Man ual EvoS uite Man ual 20 40 60 80 100 M e th o d C o ve ra g e (% )
Option Rational DocType
(c) Method Coverage
EvoS uite Man ual EvoS uite Man ual EvoS uite Man ual 0 5 10 15 20 # o f T e st s F a ili n g o n O ri g in a l
Option Rational DocType
(d) # of Tests Failing on Correct System
EvoS uite Man ual EvoS uite Man ual EvoS uite Man ual 0 20 40 60 80 M u ta ti o n S co re (% )
Option Rational DocType
(e) % Generated Mutants Killed
EvoS uite Man ual EvoS uite Man ual EvoS uite Man ual 0 1 2 3 4 # o f S tu d y M u ta n ts K ill e d (0 -5 )
Option Rational DocType
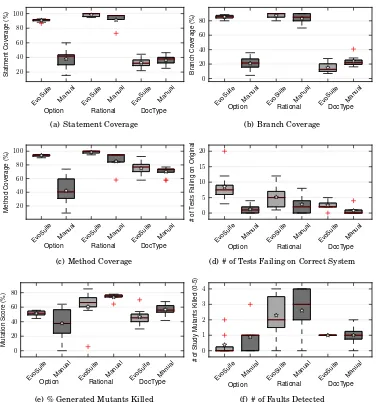
[image:14.612.119.495.97.499.2](f) # of Faults Detected
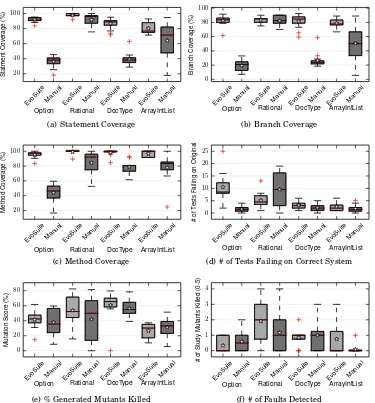
Fig. 2: Test suite properties, comparing EVOSUITEagainst manual testing (boxes spans from 1st to 3rd quartile, middle lines mark the median, whiskers extend up to1.5×the inter-quartile range, while
plus symbols represent outliers and stars signify the mean).
The results for our initial study are summarized in the form of boxplots in Figure 2, and detailed statistical analysis is presented in Table III(a) forOption, Table III(b) for
Rational, and finally Table III(c) forDocType. The Mann-Whitney U-test was used to
check for statistical difference among the stochastic rankings of these two groups for each variable, and the Vargha-DelaneyAˆ
12statistic was used to calculate standardized
this paper, we follow the guidelines presented by Arcuri and Briand [Arcuri and Briand 2014].
The data for three subjects was discarded, as one subject produced no test suites (for
DocType), and two subjects ignored study instructions and modified the class interface
(forRational). As these modifications were not captured by the EVOSUITEplugin, we
could not analyze the resulting test suite automatically.
After conducting the study, the analysis indicated unexpected results forDocType. Although per our class selection criterion, we expected EVOSUITEwould achieve high coverage withDocType, the coverage values achieved by participants using EVOSUITE
were very low (as seen in Figure 2), no greater than 44%. Upon investigation, we identi-fied a configuration problem in EVOSUITErelated to how the Eclipse plugin constructed the classpath when launching EVOSUITE during test generation; specifically, EVO -SUITEcould not load thenu.xom.Verifierclass. As it is possible to instantiateDocType even withoutVerifier, EVOSUITEsilently ignored this problem. However, many of the
methods of DocTypeindirectly depend on Verifier, and calling such a method leads
to aNoClassDefFoundError. Consequently, EVOSUITEproduced many test cases for
DocTypesimilar to the following:
String string0 = ...; DocType docType0 = ...; try {
docType0.setInternalDTDSubset(string0);
fail("Expecting exception: NoClassDefFoundError"); }catch(NoClassDefFoundError e) {
// Could not initialize class nu.xom.Verifier }
This explains the simultaneous high method coverage and low statement/branch cover-age achieved over this class. This configuration problem only affected EVOSUITE, not Eclipse itself, and consequently these test cases would fail when executed in Eclipse, as
theNoClassDefFoundErrorwould not occur.
Interestingly, none of the subjects noted this issue, and the experiment was conducted as planned. The results onDocTypetherefore do not represent the standard behaviour of EVOSUITE. However, they do represent an interesting case: what happens if the test
generation tool produces bad or misleading test cases? We therefore decided to keep the data set.
3.1. RQ1: Structural Code Coverage Achieved
As seen in Figure 2(a–c), for bothOptionandRational, the use of EVOSUITEimproves code coverage for every structural coverage criterion used. The relative increases in median coverage range from 9.4% in the case of branch coverage forRational, to 300%—
a threefold increase—for branch coverage for Option. Indeed, the improvement in
coverage when testingOptionwith the aid of EVOSUITEis particularly substantial: the
minimum coverage achieved with EVOSUITEderived test suites is 80.0% and 90.48%
for branch and method coverage, while the maximum coverage achieved by any subject working without EVOSUITEis 35.71% and 73.81%, indicating nearly all the coverage achieved during testing is likely due to automatically generated tests.
Considering the standardized effect sizes and the correspondingp-values for coverage in Table III(a), results forOptionare as strong as possible (ˆ
A12= 1andp-value close to
0.0). ForRational, there are strong effect sizes (from0.69to0.94), but sample sizes were
not large enough to obtain high confidence in statistical difference for branch coverage (p-value equal to0.247).
ForOption, where the difference in coverage is largest, this increase comes at the
price of an increased number of tests: EVOSUITE produces 47.12 tests on average,
whereas manual testing results in only 14.56 tests on average. For Rational and
DocType, however, the numbers of tests generate manually and automatically are quite
comparable: ForRationalmanual testing leads to slightly more tests (18.25 generated by EVOSUITEvs. 19.00 written manually), even though EVOSUITE’s tests have higher coverage on average. ForDocTypeEVOSUITEproduces slightly more tests with slightly
lower coverage. Thus, although more tests generally means higher coverage, this is not the only deciding factor.
The results forOptionandRationalmatched our expectations: the development of
automatic test generation tools has long focused on achieving high structural coverage, and the high coverage achieved here mirrors results found in previous work on a number of similar tools. ForDocType, however, the use of EVOSUITEresults in considerably lower branch coverage, with a relative change in the median branch coverage of -42.12% (though method coverage tends to be slightly higher). As discussed above, this is due to a configuration error; given that EVOSUITEtypically achieves around 80% branch
coverage within one minute overDocType, we expect that the behavior observed over the
RationalandOptionclasses would also apply onDocTypeunder normal circumstances.
Nevertheless, we conclude that in scenarios suited to automated test generation, generated test suites do achieve higher structural coverage than those created by manual testers.
RQ1: Automatically generated test suites achieve higher structural
coverage than manually created test suites.
3.2. RQ2: Faults Detected
For all three classes, there is no case in which the ability of subjects to detect faults improves by using EVOSUITE, and in fact detection often slightly decreases. For
exam-ple, from Figure 2(f) we seeOptionshows a slight benefit when using manual testing, with average fault detection of 0.89 compared to 0.38 (effect size 0.31). ForRationalthe data show that manually created test suites detect 2.33 faults versus the 2.12 detected with test suites derived with EVOSUITE(effect size 0.46). However, test suites created
forDocTypefind on average the exact same number of faults, 1.0 (effect size 0.5). In
no case are the differences in fault detection statistically significant atα= 0.05, as the
lowestp-value is equal to0.165(forOption). A larger sample size (i.e., more subjects)
would be needed to obtain more confidence to claim that EVOSUITEactually is worse than manual testing.
RQ2: Using automatically generated test suites
does not lead to detection of more faults.
Of the results found, this is perhaps the most surprising. Automated test generation tools generate large numbers of tests, freeing testers from this laborious process, but also forcing them to examine each test for correctness. Our expectation was that either testers would be overwhelmed by the need to examine and verify the correctness of each test, and thus be largely unable to make the necessary changes to the test to detect faults,or, that testers would be relatively effective in this task, and, free from the need to create their own test inputs, could detect faults more efficiently.
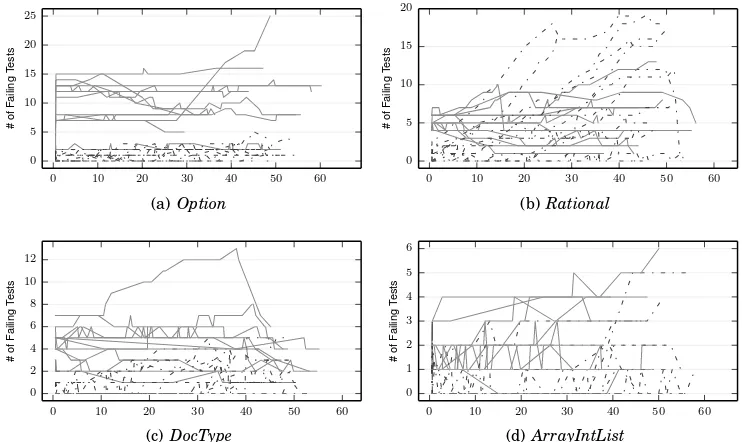
To determine if this behavior stems from the generation of poor tests suites by
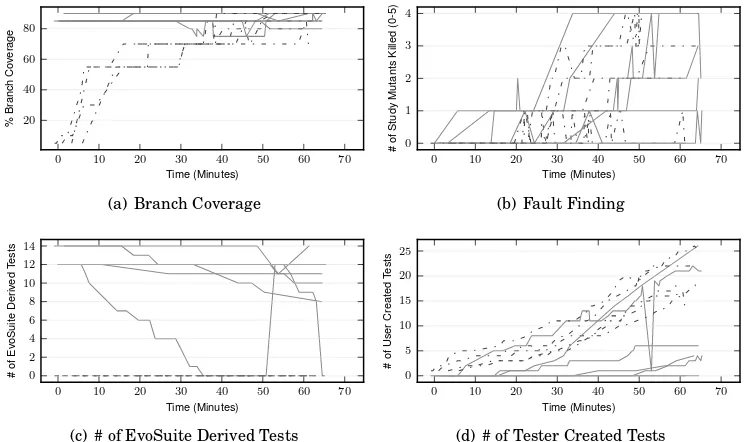
EVOSUITE, we examined how many faults subjectscouldhave found using generated
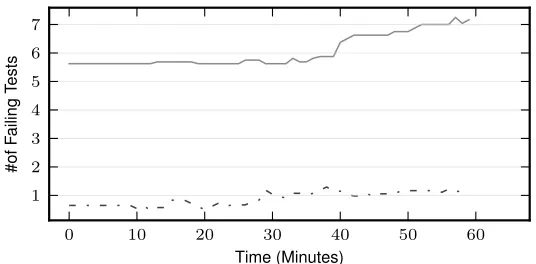
0 10 20 30 40 50 60
Time (Minutes)
1 2 3 4 5 6 7
#
o
f
F
a
ili
n
g
T
e
st
[image:17.612.178.446.94.226.2]s
Fig. 3: Average number of test cases failing on the original, correct version of the class. EVOSUITEusers are shown with dark gray solid lines, manual testers with light gray dashed lines.
initial test suites generated by EVOSUITE. We assume that a test suite can potentially reveal a fault if there exists a test which passes on the class with the fault, and fails on the original, correct class (i.e., there is a test where an assertion, if corrected, would reveal the fault). On average, test suites forOptioncould reveal 3.0 faults, test suites
forRational2.86 faults, and test suites forDocType2.6. Consequently, it would have
been possible for subjects using EVOSUITE to find more faults than manual testers
if they had identified and fixed all incorrect assertions. We take a closer look at the influence of assertions and how they vary when using EVOSUITEin Section 5.2.
3.3. RQ3: Tests Mismatching the Intended Program Behavior
For all three classes, the number of tests failing on the original version (i.e., the version of the class without the seeded faults) is larger when EVOSUITEis used (cf. Figure 2(d)). Each failing test represents a misunderstanding in how the class should operate, manifested as an incorrect assertion. ForOption, the number increases from 1.22 on average for manually written tests to 8.5 for participants using EVOSUITE; forRational
the number increases from 2.8 to 5.14; and for DocTypethe number increases from
0.75 to 2.5. The increase is statistically significant forOption(p= 0.001) andDocType (p= 0.026), whereasRational(p= 0.289) would need a larger sample size to achieve significance.
Naturally, we expect several failing tests in the initial test suite when using EVO -SUITE: assertions produced by EVOSUITEreflect the behaviour of the class they are generated from, which in the study is faulty. Over time, as the test suite evolves, we expected these failing tests to be corrected. However, Figure 3 shows that this is not the case; the number of incorrect tests remains fairly constant for both EVOSUITEusers
and manual testers, and even slightly increases for EVOSUITEusers (due toOption). The persistent number of failing tests may occur because testers struggle to under-stand the generated tests, or because in general testers struggle to correct failing tests, and the generation process merely exacerbates this. In any case, the existence of failing tests represents a potential drain on time, as these tests may fail to catch faults in the program or may signal the existence of a fault where none exists, both undesirable outcomes.
RQ3: Automatically generated test cases have a negative effect on the
ability to capture intended class behaviour.
3.4. RQ4: Regression Fault Detection
We estimate the ability of subjects’ test suites to find regression faults by examining the mutation score achieved. In contrast to the results forRQ2, the results forRQ4 are mixed: the ability of subjects to construct test suites capable of detecting faults later introduced in the class under test is impacted by the use of EVOSUITE, but
only for one class. As shown in Figure 2(e), when performing regression testing over
Option, test suites derived from EVOSUITEdetect, on average, 51.46% of mutants as
compared to 37.82% detected by manual testing alone. This indicates that the much higher structural coverage achieved over this class, while apparently not beneficial at detecting existing faults in it, nevertheless does help improve the ability to detect mutants later introduced.
However, for the other two classes,RationalandDocType, test suites constructed
with EVOSUITEseem to perform worse. For Rational, manually created test suites
killed on average 72.92% of generated mutants, a rather consistent improvement over the 60.56% of mutants found by the EVOSUITEderived test suites. ForDocType, 56.50% and 46.65% of mutants were killed by manually created and EVOSUITEgenerated test
suites, respectively. In both cases, however, the most effective test suite was created by a subject using EVOSUITE(note the outliers in Figure 2(e)). Only forDocTypethere is enough evidence to claim results can be statistically significant (p-value equal to 0.065), though this is influenced by the configuration problem discussed earlier.
We hypothesize that to some extent this difference among classes is due to the difference in method coverage achieved overOption: as noted previously, we selected independent faults to be part of each class, and some methods do not contain faults. During mutation testing, these methods are mutated, and the tests generated by
EVOSUITE targeting these methods—which are correct, as the methods themselves
are correct—will detect these mutants. As manually created test suites may not cover
these methods, they cannot detect these mutants. In contrast, for bothRationaland
DocType, test suites manually created or derived using EVOSUITEachieved similar
levels of method coverage, and this behavior is thus absent. Our results forRQ4thus reflect previous empirical studies relating structural coverage and mutation scores— higher structural coverage roughly corresponds to higher levels of mutation detection ability [Namin and J.H.Andrews 2009].
On the whole, these results indicate that the use of automatic test generation tools may offer improvements in regression testing in scenarios where testers struggle to manually generate sufficient tests to cover a system. However, the relationship between coverage and mutation score is clearly not as strong as found in previous studies (where correlations above 0.9 were common) highlighting the impact of the tester in constructing effective regression test suites [Namin and J.H.Andrews 2009]. For example, although onRationalthe coverage values are higher for EVOSUITE, its
mutation score is lower.
We provide two possible conjectures why manual testers achieved higher mutation scores with similar coverage. First, consider again the results from RQ2 and RQ3: users of EVOSUITEproduced more tests failing on the original version of a class than manual testers. Although a failing test still contributes towards code coverage, it cannot detect any mutants by definition (mutation analysis assumes that the tests pass on the original version of the class). Consequently, the mutation score is based on only the passing subset of the produced test cases. It is therefore likely that if users had managed to correct more assertions, the mutation score of the EVOSUITEtests would
Second, it is possible that the assertions generated by EVOSUITEare weaker than those written by manual testers. Both conjectures imply that assertion generation is in strong need of further research.
RQ4: Automated test generation does not
guarantee higher mutation scores.
4. RESULTS: REPLICATION STUDY
Recall from Section 3 that our second study differs only in two main respects: the systems used in the study and the subjects. Therefore, we wish to not only answer our research questions, but also highlight differences in the results with our previous study’s results. Such differences—or lack of differences—indicate how well our initial results generalize to both other systems, i.e., those not used in the initial work, and to the larger body of testers.
As before, we examine our results in the context of each research question, and apply the same analyses to answer each question. Our analyses are done using the final test suites produced by the testing processes, with analyses examining intermediate test suites shown and discussed in Section 5.1 (jointly with the analyses for the initial study). In Figure 4, we summarize the results as box plots, and in Tables IV(a)-IV(a) we list the outcome of statistical tests. Two statistical tests were used: the Mann-Whitney U-test was used to check for statistical differences between manually and tool-assisted
generated test suites, and the Vargha-Delaney ˆ
A12statistic was used to compute the
standardized effect sizes.
In contrast to our previous study, no data was discarded; all subjects wrote test suites and no modifications to the classes’ interfaces were performed. Also recall that
DocType’s EVOSUITEconfiguration in this study was corrected, and does not contain
the classpath issue found in the initial study. Thus the results when using EVOSUITE
forDocTyperepresent a testing scenario not explored in the previous study.
4.1. RQ1: Structural Code Coverage Achieved
As seen in Figure 4, without fail the use of EVOSUITE results in equal or better
structural coverage for all combinations of classes and structural coverage criteria. This is perhaps most pronounced for method coverage, where we can see relative improvements in average coverage of 17.7% to 117.2% when using EVOSUITEgenerated
test suites over manually created test suites. Indeed, for method coverage, the lowest average coverage for EVOSUITE generated test suites is 95% (for Option). Similar results are found for statement and branch coverage, with relative improvements when using EVOSUITEgenerated test suites of 6.6%-156.3% and 1.5%-329.2% for statement
and branch coverage, respectively.
Examining Tables IV(a)-IV(a) (rows for percentage “%” of statement, branch and method coverage), we see these results reflected in the statistical analysis: standardized effect sizes are consistently high, typically higher than0.8, withp-values typically below
the traditional statistical significance mark of0.05. The effect is strongest for method
coverage, with statistically significant results for every class; however, only in one case — branch coverage overRational, with ap-value of0.84— there is no strong effect on
coverage found with respect to generation strategy.
In all cases exceptRational, the number of tests generated automatically is again higher than that written manually. ForRational, the number of automatically generated tests is again lower (18.58 on average) than the number of manually written tests (23.42 on average). Thus, although within a short time an automated tool generates more tests
Table IV: Results of replicated empirical study.
(Refer to Table III for descriptions of column headings)
(a)Option.
Variable Method Min Median CI Avg. CI SD Max Kurt. Aˆ
12 p-value
# failing tests on original EvoS. 2 8.50 [4.50, 9.00] 10.50 [7.17, 13.42] 5.89 25 4.250.97 <0.001
Man. 0 1.50 [0.50, 2.50] 1.58 [0.83, 2.25] 1.31 4 2.06
# of found bugs EvoS. 0 0.00 [-1.00, 0.00] 0.33 [0.083, 0.58] 0.49 1 1.50 0.40 0.368
Man. 0 0.50 [0.00, 1.00] 0.58 [0.25, 0.92] 0.67 2 2.42
Mutation score EvoS. 14.68 42.35 [36.40, 48.89] 41.27 [35.20, 47.98] 11.73 61.67 3.69 0.56 0.644
Man. 8.57 35.47 [14.09, 47.74] 37.85 [28.30, 48.10] 18.17 59.62 1.63
% Statement coverage EvoS. 83.64 92.73 [90.45, 95.00] 92.05 [90.23, 94.09] 3.60 95.45 3.401.00 <0.001
Man. 18.18 38.18 [35.00, 45.00] 35.91 [31.89, 40.53] 8.19 45.45 2.87
% Branch coverage EvoS. 61.43 83.57 [80.71, 87.14] 82.26 [78.69, 86.90] 7.67 91.43 5.741.00 <0.001
Man. 7.14 20.71 [16.43, 29.29] 19.17 [14.64, 23.57] 8.25 32.86 1.98
% Method coverage EvoS. 83.33 97.62 [97.62, 101.19] 95.24 [93.06, 98.02] 4.54 100.00 4.981.00 <0.001
Man. 16.67 46.43 [39.29, 57.14] 43.85 [37.10, 51.19] 12.82 59.52 2.59
NCSS EvoS. 171 244.00 [224.50, 252.00] 244.25 [229.83, 261.00] 29.12 281 4.421.00 <0.001
Man. 15 76.50 [48.50, 104.00] 75.75 [56.67, 95.42] 35.67 126 1.85
# of tests EvoS. 28 36.50 [33.50, 38.00] 36.33 [33.92, 39.00] 4.68 44 2.810.97 <0.001
Man. 2 19.00 [12.00, 26.50] 18.50 [13.67, 23.67] 9.33 31 1.80
(b)Rational.
Variable Method Min Median CI Avg. CI SD Max Kurt. Aˆ
12 p-value
# failing tests on original EvoS. 1 4.50 [2.00, 6.00] 5.08 [3.17, 6.83] 3.37 13 3.60 0.35 0.234
Man. 0 9.50 [2.50, 17.00] 9.50 [5.42, 13.58] 7.56 19 1.39
# of found bugs EvoS. 0 2.00 [1.00, 3.50] 1.92 [1.08, 2.75] 1.51 4 1.62 0.65 0.223
Man. 0 1.00 [0.00, 2.00] 1.17 [0.42, 1.83] 1.34 4 2.67
Mutation score EvoS. 15.74 52.32 [31.96, 63.44] 53.70 [42.66, 65.60] 21.30 82.41 2.11 0.61 0.371
Man. 0.00 49.95 [30.87, 87.84] 41.98 [24.63, 59.37] 31.91 81.48 1.38
% Statement coverage EvoS. 91.89 97.30 [94.59, 97.30] 97.75 [96.62, 99.10] 2.26 100.00 4.89 0.73 0.050
Man. 75.68 95.95 [94.59, 106.76] 91.67 [87.39, 96.62] 8.66 100.00 2.17
% Branch coverage EvoS. 75.00 85.00 [85.00, 90.00] 83.33 [80.83, 85.83] 4.92 90.00 2.34 0.53 0.835
Man. 70.00 82.50 [75.00, 87.50] 82.08 [78.33, 86.25] 7.53 90.00 1.89
% Method coverage EvoS. 89.47 100.00 [100.00, 100.00] 99.12 [98.25, 100.88] 3.04 100.00 10.090.84 0.002
Man. 52.63 92.11 [86.84, 113.16] 84.21 [75.44, 94.30] 17.24 100.00 2.13
NCSS EvoS. 64 90.50 [73.50, 100.00] 94.08 [82.67, 105.00] 20.72 138 2.77 0.44 0.665
Man. 63 94.00 [75.50, 105.00] 100.67 [85.42, 114.25] 27.04 166 3.93
# of tests EvoS. 11 19.00 [16.50, 22.50] 18.58 [16.17, 21.17] 4.64 26 2.18 0.27 0.064
Man. 17 22.00 [17.00, 25.00] 23.42 [20.42, 26.25] 5.42 35 2.61
(c)DocType.
Variable Method Min Median CI Avg. CI SD Max Kurt. Aˆ
12 p-value
# failing tests on original EvoS. 1 3.00 [2.00, 4.00] 3.17 [2.33, 3.92] 1.47 6 2.28 0.69 0.113
Man. 0 2.00 [1.00, 3.00] 2.08 [1.17, 2.92] 1.56 5 2.15
# of found bugs EvoS. 0 1.00 [1.00, 1.50] 0.83 [0.50, 1.17] 0.58 2 2.95 0.47 0.823
Man. 0 1.00 [0.50, 2.00] 1.00 [0.42, 1.50] 0.95 3 2.64
Mutation score EvoS. 0.00 65.50 [60.84, 72.67] 60.62 [51.95, 73.18] 20.49 79.67 7.72 0.70 0.101
Man. 39.06 54.87 [45.10, 60.10] 56.51 [49.91, 62.56] 11.67 78.50 2.33
% Statement coverage EvoS. 71.66 89.04 [87.17, 95.99] 86.36 [82.40, 90.95] 7.84 95.19 2.371.00 <0.001
Man. 28.88 38.24 [35.03, 41.98] 39.35 [34.09, 43.45] 8.73 63.10 5.76
% Branch coverage EvoS. 59.23 84.62 [81.54, 92.31] 81.41 [76.35, 87.50] 10.38 92.31 2.931.00 <0.001
Man. 18.46 23.46 [20.00, 25.77] 26.54 [19.68, 31.09] 10.87 58.46 7.48
% Method coverage EvoS. 84.62 100.00 [100.00, 101.92] 98.08 [96.15, 100.96] 4.49 100.00 8.040.99 <0.001
Man. 61.54 80.77 [80.77, 88.46] 78.85 [74.36, 83.33] 8.44 92.31 3.10
NCSS EvoS. 132 172.50 [161.50, 188.00] 170.33 [159.67, 181.67] 20.29 201 2.340.99 <0.001
Man. 50 83.50 [73.50, 103.00] 82.67 [68.50, 95.42] 24.59 139 3.52
# of tests EvoS. 29 35.50 [31.50, 38.00] 36.33 [33.67, 39.00] 4.96 45 2.220.99 <0.001
Table IV: Results of replicated empirical study (continued).
(Refer to Table III for descriptions of column headings)
(a)ArrayIntList.
Variable Method Min Median CI Avg. CI SD Max Kurt. Aˆ
12 p-value
# failing tests on original EvoS. 1 2.00 [0.50, 3.00] 2.50 [1.58, 3.25] 1.57 6 2.98 0.64 0.237
Man. 0 1.50 [0.50, 2.50] 1.75 [0.83, 2.58] 1.60 5 2.54
# of found bugs EvoS. 0 0.00 [-1.50, 0.00] 0.75 [0.083, 1.33] 1.22 3 2.56 0.64 0.122
Man. 0 0.00 [0.00, 0.00] 0.083 [-0.083, 0.17] 0.29 1 10.09
Mutation score EvoS. 10.47 30.20 [24.94, 43.55] 26.56 [21.33, 32.22] 10.02 37.21 1.40 0.40 0.436
Man. 5.56 33.06 [25.45, 44.57] 31.10 [24.12, 38.73] 13.46 51.40 2.34
% Statement coverage EvoS. 71.43 76.79 [65.18, 78.57] 80.21 [76.04, 84.08] 7.59 92.86 1.74 0.73 0.056
Man. 17.86 71.43 [60.71, 95.54] 63.99 [52.23, 76.93] 22.98 94.64 2.35
% Branch coverage EvoS. 66.67 77.78 [72.22, 80.56] 78.70 [75.00, 82.41] 6.63 88.89 2.41 0.85 0.003
Man. 5.56 50.00 [33.33, 66.67] 50.46 [37.50, 63.43] 23.62 88.89 2.49
% Method coverage EvoS. 91.67 100.00 [100.00, 108.33] 96.53 [94.44, 98.61] 4.29 100.00 1.11 0.91 0.001
Man. 25.00 83.33 [79.17, 91.67] 77.78 [69.44, 88.89] 18.91 100.00 6.27
NCSS EvoS. 75 87.50 [62.00, 91.50] 97.08 [86.83, 106.83] 18.51 133 2.06 0.77 0.026
Man. 21 57.00 [22.50, 88.00] 60.42 [40.59, 79.50] 36.17 121 1.71
# of tests EvoS. 14 16.00 [13.50, 17.00] 16.50 [15.42, 17.58] 2.02 20 1.91 0.71 0.087
Man. 1 9.50 [1.00, 14.00] 11.83 [7.00, 16.25] 8.55 28 2.15
than a human tester, it seems that, if given sufficient time, manual testing will converge at a number of tests no less than automated test generation. In fact, considering that
EVOSUITE not only optimises for code coverage, but as a secondary criterion also
optimises the test suite size, it is likely that manual testing will in practice result in more tests for the same level of coverage.
These results match our expectations — depending on the structural coverage cri-teria considered, achieving high coverage is, at worst, made no more difficult by the introduction of tools for automatic test generation. Indeed, in every case except branch
coverage over the Rationalclass, the use of EVOSUITEresults in improvements in
coverage, up to 329.2%, with high statistical confidence. We therefore conclude that, as in our previous study, generated test suites do achieve higher structural coverage than those constructed manually.
RQ1: The replication confirms that automatically generated test suites
achieve higher coverage than manually created test suites.
4.2. RQ2: Faults Detected
Of the four classes used in our study, test suites generated using EVOSUITEoutperform
those manually constructed for only two classes,RationalandArrayIntList, by 64.3% and 800% on average, respectively (Figure 4(f)). In both cases this represents an improvement of roughly one fault detected more on average. Test suites constructed
for Option andDocType are slightly more effective when manually constructed, by
75% and 20%, respectively. As shown in Tables IV(a)-IV(a) however, the differences in fault detection are not strong enough within any class to be considered statistically significant. Even forArrayIntList, the class for which the difference in faults detected is most visible, the standardized effect size is only0.64and thep-value is0.122, short of
the traditionalα= 0.05mark.
These results are comparable to those in Section 3.2 with regards to the effectiveness of EVOSUITEderived test suites. As before, in most cases both sets of test suites are typically of roughly equal fault detection power. Indeed, even forDocType, which was