OF SHADE SELECTION WITH VISUAL AND
DIGITAL METHOD
Dissertation submitted to
The Tamil Nadu Dr. M.G.R. Medical University in partial fulfillment of the requirements for the degree of
MASTER OF DENTAL SURGERY
BRANCH I
PROSTHODONTICS
OF SHADE SELECTION WITH VISUAL AND
DIGITAL METHOD
S.PREETHI SUGANYA Dissertation submitted to the Tamil Nadu Dr. M.G.R. Medical University
in partial fulfillment
of the requirements for the degree of Master of Dental Surgery
in Prosthodontics
including crown and bridge and implantology
Under the guidance of Dr. P. Manimaran
HOD and Professor of Prosthodontics J.K.K.Nattraja Dental college and Hospital
Komarapalayam 2016-2019
Tamil Nadu Dr.M.G.R. Medical University
I hereby declare that this dissertation entitled
COMPARISON OF SPECTROPHOTOMETRIC EVALUATION OF SHADE SELECTION WITH VISUAL AND DIGITAL METHOD
is a bonafide and genuine research work carried out by me under the guidance of Dr. P. Manimaran, H.O.D. and Professor of Prosthodontics
J.K.K. Nattraja Dental College and Hospital Komarapalayam
by the Head of the Department and Principal
This is to certify that the dissertation entitled
COMPARISON OF SPECTROPHOTOMETRIC EVALUATION OF SHADE SELECTION WITH VISUAL AND DIGITAL METHOD
is a bonafide research work done by S.PREETHI SUGANYA
under the guidance of Dr. P. Manimaran
H.O.D. and Professor of Prosthodontics J.K.K.Nattraja Dental College and Hospital
Komarapalayam
Dr. P. Manimaran
Head of the Department of Prosthodontics J.K.K.Nattraja Dental College and Hospital
Komarapalayam Dr. A. Sivakumar
Principal
J.K.K.Nattraja Dental College and Hospital
I hereby declare that the
Tamil Nadu Dr. M.G.R. Medical University shall have the rights to preserve, use and disseminate this dissertation
in print or electronic format for academic / research purpose.
S.PREETHI SUGANYA Postgraduate student in Prosthodontics J.K.K.Nattraja Dental College and Hospital Komarapalayam
This is to certify that the dissertation entitled
COMPARISON OF SPECTROPHOTOMETRIC EVALUATION OF SHADE SELECTION WITH VISUAL AND DIGITAL METHOD
is a bonafide research work done by S.PREETHI SUGANYA
in partial fulfillment of the requirement for the degree of
Master of Dental Surgery in
Prosthodontics
including crown and bridge and implantology
Dr. Sai Sadan Co-Guide and Reader Department of prosthodontics J.K.K.Nattraja Dental College
Komarapalayam
Dr. P. Manimaran Guide and H.O.D Department of Prosthodontics J.K.K. Nattraja Dental College
This is to certify that this dissertation work titled COMPARISON OF SPECTROPHOTOMETRIC EVALUATION OF SHADE SELECTION WITH VISUAL AND DIGITAL METHOD of the candidate S.PREETHI SUGANYA with registration number 241611101 for the award of MASTER IN DENTAL SURGERY in the branch of Prosthodontics including crown and bridge and Implantology. I personally verified the urkund.com website for the purpose of plagiarism check. I found that the uploaded thesis file contains from introduction to conclusion pages and results shows 3% percentage of percentage in the dissertation.
I express my profound gratitude and respect to my guide Dr.P.Manimaran, M.D.S., Head of the Department, Post Graduate Department of prosthodontics for his invaluable council and encouragement not only for this study but throughout my postgraduate course. I will always be indebted to him for his whole hearted support in my study.
I am extremely thankful to Dr.A.SIVAKUMAR M.D.S., Principal, J.K.K.Nattraja Dental college & Hospital for his kind help and permitting me to use the facilities in the institution.
I am thankful to Dr. Saisadan M.D.S., Reader, Postgraduate- Department of prosthodontics for giving me constant guidance, support and for giving a final shape to this study. This dissertation has been the fruitful outcome of his immense patience support, expert guidance and advice from beginning to the end of this study.
I am thankful to Dr.C.Dhinesh kumar M.D.S.,Reader for all the inspiration and guidance he has provided throughout my post graduation.
I am thankful to Dr.Abirami M.D.S., Senior Lecturer, for her constant help, support and motivation rendered throughout this study.
I am thankful to Dr.Monica M.D.S., Senior Lecturer, for her support and guidance throughout this study.
Department of conservative dentistry and endodontics, J.K.K.Nattraja Dental college & Hospital for allowing me to work with spectrophotometer in their premises.
I am extremely thank Dr.Mahesh., M.D.S., Senior lecturer, Department of Public Health and Dentistry, J.K.K.Nattraja Dental college & Hospital for helping me out doing the statistical analysis of the study results.
I am highly indebted to my family and friends who have helped me in several ways during the course of the study.
S.No. Description Page No.
1. INTRODUCTION 1
2. AIM AND OBJECTIVES 4
3. REVIEW OF LITERATURE 5
4. MATERIALS AND METHODOLOGY 24
5. PHOTOGRAPHS 37
6. TABLES 40
7. STATISTICAL ANALYSIS 44
8. RESULTS 49
9. DISCUSSION 51
10. SUMMARY AND CONCLUSION 60
[image:11.595.101.531.130.556.2]Fig.No. Description Page No.
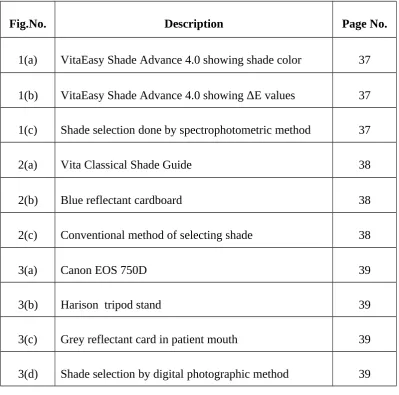
1(a) VitaEasy Shade Advance 4.0 showing shade color 37 1(b) VitaEasy Shade Advance 4.0 showing ΔE values 37 1(c) Shade selection done by spectrophotometric method 37
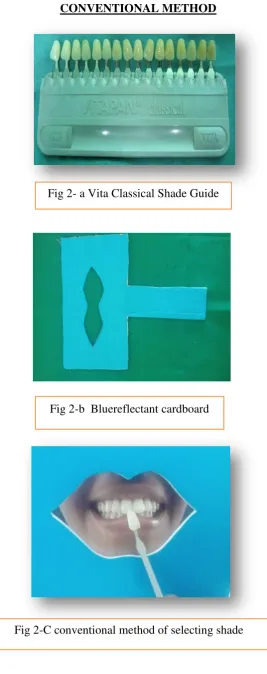
2(a) Vita Classical Shade Guide 38
2(b) Blue reflectant cardboard 38
2(c) Conventional method of selecting shade 38
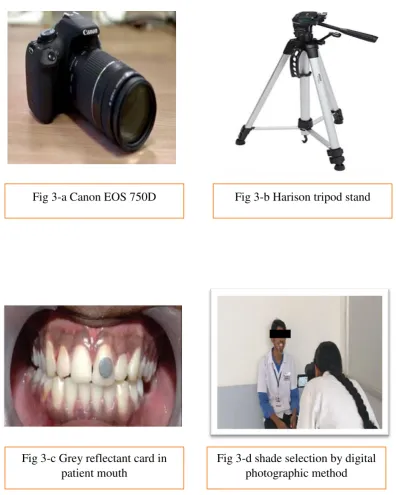
3(a) Canon EOS 750D 39
3(b) Harison tripod stand 39
3(c) Grey reflectant card in patient mouth 39
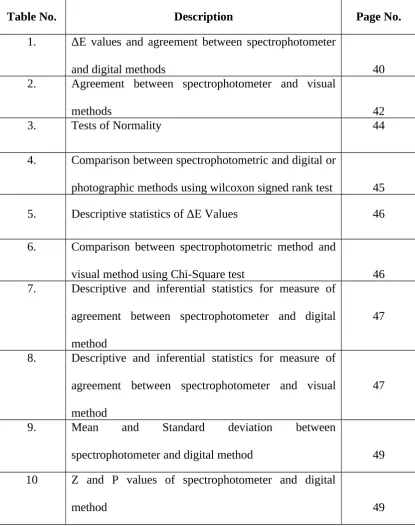
Table No. Description Page No. 1. ΔE values and agreement between spectrophotometer
and digital methods 40
2. Agreement between spectrophotometer and visual
methods 42
3. Tests of Normality 44
4. Comparison between spectrophotometric and digital or
photographic methods using wilcoxon signed rank test 45
5. Descriptive statistics of ΔE Values 46
6. Comparison between spectrophotometric method and
visual method using Chi-Square test 46
7. Descriptive and inferential statistics for measure of agreement between spectrophotometer and digital method
47
8. Descriptive and inferential statistics for measure of agreement between spectrophotometer and visual method
47
9. Mean and Standard deviation between
spectrophotometer and digital method 49
10 Z and P values of spectrophotometer and digital
method 49
1. Test of normality between spectrophotometer and digital or photographic method
44
2. Distribution of percentage of agreement between visual and spectrophotometric method and between
A smile could convey a thousand different meanings, yet it is the most easily recognized expression. A charming smile can change drowning things and can give positive aura. But every person is not blessed to have a attractive smile. The answer to the above problem is esthetic dentistry which has developed leaps and bounds with the latest technologies and materials.
Esthetic dentistry is defined as an art and science of dentistry, applied to create or enhance the beauty of an individual within functional and physiological limits. Esthetic dental treatment aims to achieve a patient’s own intensity, personal image of how he or she looks like and how he or she would like to look. A strong wish to look beautiful is no longer taken as a sign of pride. In an economically competitive world, a pleasing appearance is a prerequisite and implies the difference between success and failure in both our personal and professional lives. Esthetic dentistry primarily focuses on improvement in dental esthetics such as color, position, shape, size, alignment of teeth and overall smile appearance.
Color is best described as an abstract science and color appeals to deal with both visceral as well as emotional senses. Color is personal and each individual will view the same object differently. The basic knowledge of how the color will be perceived and reproduced will aid the clinician in evaluating and matching the shades in dentistry. Since dentistry is a demanding profession. There are many challenges that can and will appear. This is especially true with cosmetic work. Hence certain systemic guidelines in place, can make this part of esthetic dentistry rewarding for both dentist and the patient.
In dentistry, Prosthodontist is probably the best person to identify the quality of smile. Further he is able to change the quality of treatment with the recently available innovative techniques and to plan restorations.
The specific conditions that initiate a need for esthetic treatment includes discoloration due to extrinsic and intrinsic staining, anomalies due to developmental disturbances, abnormal spacing between teeth and trauma.
There are two steps in shade selection:
1. Selection of color and
The aim of the study was to compare the shade selection using two different methods namely, Visual method (VITA CLASSICAL) and Digital photography
method (CANON EOS 750D) with Spectrophotometer (VITA EASY SHADE COMPACT)
VISUAL METHOD
DIGITAL METHOD
Dean Farnsworth (1943) discussed the Farnsworth –Munsell 100 –Hue and Dichotomous test for color vision. It has been described for the evaluation of color anomaly. The importance of undergoing color test for the investigator were gleaned from the literature. So its necessary for the investigator to undergo Munsell and Dichotomous test in order to find out peculiarity.
G.Verries (1963) conducted study on color discrimination based on age and sex. From this literature it states that pseudo isochromatic principles are not quick to respond and do not identify reliable differences. Inspite, the acquired deficiencies of color discrimination are not often well delineated as the congenital ones. This article describes the occurrence of different type of ocular deficiency.
William D. Culpepper (1970) conducted comparative study on shade matching procedures. He conducted shade selection using four different shade guides under four different light sources. The selection of shade vary among the observes and he concluded the study by saying that practising dentist can select the shade according to surrounding lightening conditions and to his own fulfilments and to that of his patients.
Stanley Coren (1971) conducted an in vivo study on older age groups based on solidity of human lens pigmentation. It states that incase two metameric colors appear similar and if web ring color filter infront of them they will no longer materialize same. In order to quantify the density of pigmented lens, one must appoint the spectral transmission. The obtained points can be used to decide the density of pigment.
Stephen F. Bergen (1977) put forward how important to select the shade discrimination in dental clinic with variable lightening conditions. All colors will be revealed as the patient desires, if the spectrum of light contains all desired colors. Hence setting upon the dental clinic with proper lightening source is important for distinct shade matching. This study states that less weariness of eye is produced by full-spectrum bulb compared to a cool white.
Edwin H. Land (1977) discussed how the visual system is able to withdraw the color information from the surrounding atmosphere and how eye makes remarkable attention from the world to make interesting fact about retinx theory of color vision. This article describes about how the rods and cone cells of retina illuminates light and works as color vision in human beings.
Charles G. Saleski (1972)formulated a standardized lightening for prosthetic reproduction in shade selection between dentist and in dental laboratory. Color is the most important thing to be taken into an account and the knowledge and tools to color do survive. By making use of an available technology for functional prosthesis, dentist can establish the same technical excellence for esthetic purposes.
Gerard J. Barna(1981) did an in vitro study on color perception within the color range of natural teeth. He said that object variables, observer variables and light source variables are effected by colors. By reducing the variables in the object and the light sources, normal variables of the observer can be controlled. It is evident that practising alone could not increase the skill and it requires proper training for color discrimination.
Lynda K.Bangtson (1982) conducted an experimental study for the conversion of Chromascan designations to CIE trisimilus values. In restorative and prosthetic dentistry matching the shade remains dare. Color selection becomes convoluted by individual differences in color identification skills and color perception.
W.M. Johnston ( 1988)this study compared the color match by visual method and instrumentation such as clinical colorimetry. Some plights arise whether problems evident by visual or instrumental method. Individual observer may record vary colors from time to time and leads to color mismatch. United States Public Health Service (USPHC) has implemented several criteria for visual observer. Instrumental colorimeter provides similar parameters of different objects when any colorimeter is given.
T.P. Van de Burgt (1990) compared shade by using three different methods namely visual, fibre-optic colorimeter and spectrophotometer. The measurement should be copied, realistic and balanced and easy to use. Entire calibrations should be recorded intra orally and not involving any damage. This research ends up with results that fibre-optics colorimeter is a promising instrument with some theoretical or scientific improvement is necessary.
S.P.Davison (1990) explored and investigated four type of innovate groups. They were1) color defective dental students and dentists 2) assistant with normal color vision 3) prosthodontist with normal color vision 4) control group. This study concluded that color defective dental students decreased the ability to match accurate shade selection. Assistant with normal color vision shows statistically significant results.
vacuum, Crystal porcelain, bioform ) and three different lightening sources ( North daylight, Lumin shade light, fluorescent) were used. Women agreed more with Vita Lumin compared with Crystal porcelain and bioform.
Rene A Bolt (1994)conducted a study on extracted incisor teeth fixated with formalin. The tooth color is normally measured with a small window by the illumination passing through it. When light gets entered into small window for color discrimination, an edge loss error occurs. In order to overcome such errors external diaphragm was provided with spectrophotometer using spectroradiometer and detector.
M.A. Crognale (1997)conducted a study on extremity of color shortcomings by using electroretinographic (ERG) and behavioural studies. The aim of the study was to calculate the existence and separation of photo pigments in human observers and how far electroretinograph concludes to improve the color matching from molecular analysis. This investigation helps to find out normal and color defect persons.
Carolyn Bentley (1999) conducted a study on Night guard Vital Bleaching (NGVB) by digitalized means. The shade tab and clinical cases were photographed by using camera on35 millimetre film with focal length of 100mm f/4 lens and automated flash. The image was then digitalized in the computer and stored as red, green and blue (RGB ) format. Photoshop was done with commercially available software.
Akira Hasegawa (2000) did an in vivo study for color and translucency on natural central incisor of 42 men and 45 women of different age groups using spectroradiometer color computer model PR -650 Spectra Colorimeter instrument with Macro-Spectra MS-75 and SL-1X lens. This articles reaches to clarify translucency and color difference for five sites namely cervical, center-cervical, center, incisal-center and incisal between the natural teeth and VITA Lumin Vacuum shade guide. It concluded that natural teeth showed decrease in lightness from center to the cervical site and drastically increase in yellow color at all five site with progressing age. Vita Lumin shade provide less lightness as compared to that of natural teeth.
S.Paul (2002) did an in vivo study on accuracy of color matching in dentistry. 30 patients were selected (14 male and 16 female) with different age groups ranging from17- 44 years. Three dentists used to find out the possible shade based upon conventional method using Vitapan Classical shade guide. Intra oral camera is used to measure shade by spectrophotometric methods. This study shows spectrophotometric analysis is more accurate compared to conventional shade selection.
Wolfgang M. Bengel (2003) discussed about the images taken by digital photography that eliminates color cast by neutral reference such as grey reflectant card and also provides better therapeutic results after bleaching procedures. This article describes about the factors that affect color performance and brightness in photography. However digital photography could results in rendering the cause for brightness in images.
Lambert J.Stumpel III ( 2004) discussed the easy way of rectifying digital images in shade communication with dentist and the dental technician in laboratory. After taking the pictures, image gets analysed using the computer software ( Adobe CS, Adobe Inc, San Jose, Calif) and processed with the toolbars present in the software. Finally save the image and send to the lab technician for further process.
with proper camera settings. There was a statistically significant co relation found between L* and b* values when compared to L* and a* values because intermediate coefficient of L* and a* is relatively low.
H.Dagg (2004) explained clearly about some circumstances on which accuracy of shade replication depends. Custom shade tabs were fabricated from Vita and Shouf porcelains. Four main considerations were, contrast between two porcelain system, outcome of thickness of porcelain, result of light quality and the more involvement or experience of observer. The results showed more influence for the shade selection is light quality
Jane D. Brewer (2004) emphasised about recent development in color matching system. Older conventional method shows lot of color differences in shade matching due to external influences like age, disease and drug therapy. Over last 20 years, a number of laboratory and clinical findings of instrumental measurement been published. This articles briefly explains about visual shade matching and instrumental shade matching such as colorimeter (Shade Eye, Shade Scan), digital imaging ( Clear Match, Spectro Shade) ,spectrophotometer (Easy Shade) and spectroradiometer.
Burkard Hugo (2005) did an in vivo study on shade matching based upon visual and computer aided shade matching. It is important for day to day practitioner whether computer shade matching will be accurately useful in everyday life. The Spectro Shade device ( MHTOptic Research AG,8155 Niederhasli, Switzerland ), the Shade Vision device (X –Rite Co.,) and Digital Shade Guide DSG4 ( A. Rieth, Germany) are based upon computer- aided determination.
Shigemi Ishikawa –Nagai ( 2005) discussed the precise of replication of color scale or spectrum for ceramic restoration using CCM ( Computer Color Matching) employing a prototype program and spectrophotometric data’s. To implement CCM technique of ceramic restoration, the entanglement of tooth color gradient should be taken into an account. Color reproduction takes place from incisal through the cervical regions.
Jarad FD (2005) discussed about color determination by observation and computer matching method. Shade matching has always been tedious job in dentistry and satisfying the patient is quiet difficult. This article describes two methods namely Vita Lumin shade guides ( A2,A3,A3.5,B2,B3,B4,C1,C2,C3) and digital camera ( Nikon Coolpix 990) and colour values obtained by digital camera is verified by using spectrophotometer.
SD9 with Foveon × 3 CMOS sensor. This study shows that SLR camera with appropriate settings and protocols helps in accurate reproduction of color.
Seungyee Kim-Pusateri (2007) did an in vitro study for the accuracy and reliability of tooth color. This article compared three commercially available shade guide such as VITA Classical ( VITAZahnfabrik), VITA 3D Master (VITA Zahnfabrik ) and Chromascope (IvoclarVivadent ) with shade matching device such as Shade Scan (Cynovad). The results shows that reliability of tooth color for VITA Classical will be more followed by VITA 3D Master and Chromascope and accuracy of tooth color for VITA Classical will be more followed by Chromascope and VITA 3D Master.
R. Khurana (2007)discussed a shade matching procedure under the clinical conditions with a well skilled operator. The procedure was done in natural daylight using three commercially available devices such as Vita Easy Shade Spectrophotometer, Spectro Shade Micro and X-Rite Shade Vision Colorimeter. The most important aspects in color dentistry is color judgement and replication of color in restoration.
Alma Dozic (2007) conducted both an in vitro and an in vivo study on accuracy and precision of shade matching in five commercially available devices. Five shade tab such as A1, A2,A3,A3.5 or A4 of the Vita Lumin shade guide placed in phantom jaw to determine color matching by using five available device such as Shade Scan, Ikam, IdentaColor II, Shade Eye, Easyshade was done. For in vivo study 25 dental students selected without any restoration on maxillary anterior with informed consent.
Q.LI and Y.N. Wang (2007) discussed shade determination among visual and colorimeter. Twenty people ( 11 women and 9 men ) were selected between the age groups of 19-32 years. Two prosthodontist and one dental technician were employed in this study for visual assessment of shade using Vita Lumin shade guide. ShadeEye NCC is the intra oral dental colorimeter used in this study. This study concludes that ShadeEye NCC provides better results when compared to visual assessment.
Alvaro Della Bona (2008) conducted a study with three group of populations such as general population ( non dentist or GP) and first year dental students (DS) and with an experienced dentist ( DD). Shade tab was observed by general population and natural central incisor was observed by DS and DD under two lightening conditions such as in natural day light and in cool white fluorescent. Intra-oral spectrophotometer helps to identify natural central incisor and shade tab
system used in this study. Metal ceramic crown was prepared by using both conventional and spectrophotometric methods for best color reproduction.
Jin –SooAhn( 2008) did a study on shade tab ( Vitapan 3D Master) for hue, value and chroma scale by using spectrophotometer. Before undergoing shade determination procedure, the middle portion of the shade tab were polished with silicon carbide paper. By making flat on the middle surface, the measurement becomes more accurate when compared to cervical and incisal regions.
SS Meireles (2008) did a study for the affirmation and reliability of conventional evaluation with shade guide. 92 individuals ( 18-55 years of age) were selected for the study. Two well trained dentist participated for visual shade selection. They underwent two phases of training like knowing complete knowledge of color, factors influencing color and method of shade selection.
David Gozalo- Diaz (2008) conducted an in vivo study about color matching on maxillary central incisor among 120 humans based on age and gender. Age groups vary as follows 18-29 years, 30-39 years, 40-49 years, 50-59 years and 60 – 85 years among four racial groups (White, Black, Pacific Islander, Asian). Color of the object is measured by spectroradiometer and with the help of an external light source
lab ) and dental experience of 1-44Years. Not containing any logical contradictions with other studies it proved that there was no difference evident on experience or gender.
RadeD.Paravina (2009 ) conducted an in vivo study on shade matching with dental students after getting approval from the ethical committee. Four Targets shade tabs (target tab 1-1M1.5; target tab II -2R2.5; target tab III –A3 ; target tab 1V-4.5M2)were selected and compared with four dental shade guides ( 3D Master, Vitapan Classical, Prototype of Linearguide 3D-Master , Final version of Linearguide 3D-Master )
Lars Schropp (2009) discussed about visual and digital evaluation of shade selection. Vita 3D-Master guide was selected since it is used mostly in clinic scenario. Twelve tabs were selected and placed in phantom head and observation was done by nine observers. Similarly digital photography was taken under clinical environment with camera settings and color matching was done by computer software. It concluded that digital photography gives better results when compared to visual method.
ShadeScan) and for accuracy 10 shade tabs from each shade guide selected and measured once with shade matching devices.
Burak Yilmaz (2010) did an in vitro study on color reproduction of metal ceramic specimens by using conventional methods and intra oral colorimeter. Five different shade tabs ( A1,B1,C3,D3,A3.5) were used from Vitapan Classical shade guide. For instrumental method, ShadeEye NCC is used. Results were displayed as color reproduction of visual matching is more reliable and precise when compared to instrumental method.
Stephan J. Chu (2010) discussed about advancement and eagerness of color reproduction that gradually influenced modern dentistry. This article gave an idea about current trends of handling color matching in clinical practise. In those days when keywords are given in Medline search only limited articles could give reference but now it increased to 409 papers as well. For easy communication, esthetic purpose, color reproduction both visual and instrumental shade matching is important
Yong-Keun Lee (2011)discussed about perceived shift in color under different lightening conditions. Based upon measurements given by spectroradiometer, Vitapan 3D-Master shows a considerable amount of change in color under three illuminants. CIE standard illuminantD65 ( daylight ), F9 ( fluorescent lamp ) and A (incandescent lamp) are the different illuminant used in the study.
Elizabeth Sarkis (2012) did an in vitro study for color changes of five dental materials. Disc shaped sample was prepared and light cured with Plasma arc composite. One side was polished with Super-Snap system and remaining side left unfinished. Digital spectrophotometer used to measure color after 24 hours. Unfinished surfaces shows more coloration when compared to finished surfaces.
Deger Ongul (2012) did an in vivo study for color matching in dentistry. Thirty three subjects were selected and ceramic crowns were fabricated on maxillary central incisor by using two shade guide system such as Vitapan Classical and Vita Tooth guide 3D-Master.Spectrophotometer helps to calculate the color values of these shade guide system. The results shows that crown fabricated by Vita 3D-Master shows closer values of natural tooth.
W.K Tam (2012)did an in vitro study on shade matching between conventional and digital method. Vita 3D-Master and Canon EOS 1100D were employed in the study. The shade guide was captured by digital camera at a distance of 30-50cm. The image was then processed by a manual cropping inorder to remove light shadows on cervical or lateral borders. The results hold up the favour for digital camera in shade reproduction.
Mehta R (2014)gave an updated review about color selection in dentistry. Older method of shade selection ended with some limitations due to opalescence, translucency, fatigue. Hence newer methods came to exist in modern dentistry for accurate and perfect reproduction of ceramic match. They includes RGB devices, digital camera, spectrophotometer, colorimeter and stump shade selection.
Jian Wang ( 2014) did an in vitro study on accurate color reproduction of porcelain by computer color matching system. 21 shade disks of 1mm thickness were prepared from porcelain and polished, measured by using spectrophotometer and matched by using computer. The results shows that computer color matching provides more accurate and effective in reproducing dental ceramic or porcelain.
difference among age, younger one evident with lighter values compared to older adults.
DS Moodley (2015) did an in vivo study on colour difference between conventional versus spectrophotometer. Twenty five patients were selected between the age groups of 20 and 25 with complete set of maxillary anterior teeth and vital right upper central incisor. For conventional method Vita Classical and Vita 3D-Master are selected and for spectrophotometric method Spectro Shade was selected. It concluded the study by saying that it would be a best practise to use both methods.
Neelam Pande (2015) conducted an in vitro study on color replication of pressable all-ceramic crowns with stained and unstained extracted maxillary central incisor using spectrophotometer. Low translucency all ceramic restorations can be used in unstained tooth for better results. Medium opacity can be used in both stained and unstained tooth. High opacity can also be used on stained tooth but it not within suitable range.
Aikaterini Tsiliagkou (2016) conducted a study on accuracy and repeatability of color matching devices. Two commercially available shade guides such as Vita Lumin and Vitapan3D-master are selected for this study. Three color matching instruments such as Easyshade, SpectroShade and ShadeVision are used. Based on certain term, conditions and parameter, SpectroShade was considered as the most useful and acceptable device.
Erin Ballard, MS (2017) discussed about expectation and fulfilment of shade selection by using advanced spectrophotometer. Pictorial or descriptive information such as patients (58 male and 45 female), dental students 9 from third and final years), supervising faculty members ( general dentist and prosthodontist), level of experience and location of restoration were collected. Based on data collection, reference shade, prescription shade and luted definitive restoration, Spectrophotometer Advance 4.0 shows high amount of satisfaction result
MATERIALSUSED FOR THE STUDY
• DIGITAL CAMERA - CANON EOS 750D
• VITA EASY SHADE SPECTROPHOTOMETER ( ADVANCE 4.0)
• VITA CLASSICAL SHADE GUIDE (VITAPAN ZAHNFABRIK)
• TRIPOD STAND
• 18% GREY REFLECTANT CARD
• CHEEK RETRACTOR
METHODOLOGY
50 SAMPLES
DIGITAL METHOD
VITA CLASSICAL VISUAL METHOD
VITA EASY SHADE COMPACT
SPECTROPHOTOMETER
CANON EOS 750D
VERDICT VERDICT VERDICT
STATISTICAL ANALYSIS
Fifty dental students from our dental college of age groups 18-25 with
Maxillary right central incisor after undergoing oral prophylaxis were included in this
study. Before undergoing shade selection procedure the teeth are dried using cotton.
Discolored teeth, restorations, endodontically treated teeth, extrinsic stains, non –vital
or fractured teeth, presence of crowns and veneers are excluded and females were
asked to remove the lipstick.The study was proceeded after acquiring the necessary
approval from the Ethical committee of the Institution and an informed consent from
the students.
The spectrophotometer reported the L*, a*, and b* values along with the
actual shade whereas the digital photography method reported only the L*, a*, and b*
values using Adobe CS software. The shades obtained by the visual method were
marked down for further comparisons. The readings obtained by these three different
methods were compared and subjected to appropriate statistical analysis.
Before undergoing shade selection procedure, to avoid discrepancy in
conventional method of shade selection, Munsell color test and pseudo chromatic
colour plate test was performed for the clinician in an eye hospital , and certificate
was obtained from an experienced Opthomalogist. Only after these tests, shade
selection procedure was performed. Color is a very subjective assessment which
changes from person to person. Literature has clearly stated that the shade of any
restoration is influenced by several external factors such as surrounding illumination,
environment, the tooth including its textures and layers, the dentist’s personal
Hence the standardization protocol was followed for evaluating the shade selection
Standardization protocol was followed during the study as follows,
All the shade matching procedure were performed by the same operator
The students are made to sit in the same dental chair, directed towards
northern facing sunlight
The entire procedure was done between 12.00pm to 3.00 pm on a bright
sunny day
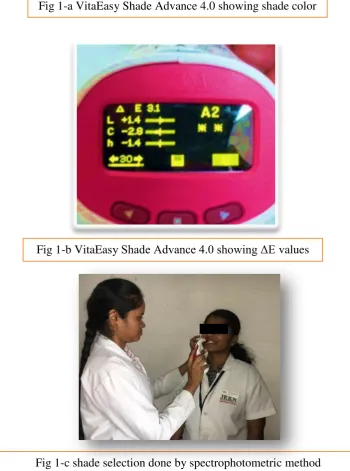
SPECTROPHOTOMETRIC METHOD:
This study was proceeded with 50 students using spectrophotometer i.e.,
VITA EASY SHADE COMPACTas shown in (fig 1-c)
Spectrophotometer which contains the following components,
- Hand piece
- Base unit
- Calibration block holder
The green power LED light will flash a beam on the base unit once the power
supply is connected to the wall electrical output with a suitable adapter, now place the
base unit on the flat surface. Insert the Easyshade Advance 4.0 hand piece into the
base unit so that the battery charging port fits over the charging pins. The green LED
flashes after the instrument has been connected to the power supply. Let the battery of
the hand piece charge for a minimum of 5hours before initial use.
It is mandatory to properly sterilize and disinfect the instrument between patient
use and to use a new Easy shade infection control shade for each patient to prevent
patient cross contamination. The infection control shield also protects the fibre optics
in the instrument from destruction. The proper infection control can be done by
following steps
Slide the tip of the hand piece into the shield
Detach paper backing from the shield
Tug shield carefully over the hook
Secure shield on the hook
Locate the tool in the calibration block receptacle so that the probing tip is flush
with perpendicular to the calibration block and depresses the calibration block.
Starting graduation or calibration may takes a few seconds after the unit is pressed.
After successful calibration, the measurement menu is displayed and the unit is ready
The steps followed in selecting the shade using VITA EASYSHADE COMPACT are:
Have the patient to sit in the chair and lean back his head
Observe the color gradient of the tooth to be measured precisely
The probe tip must be placed on the area of the enamel surface that has the
underlying dentine.
The probing tip must be placed perpendicular and flush to the tooth surface
While holding the probing tip against the tooth, press the measurement button
and hold the probe tip against the tooth until two rapid “beeps” can be heard to
indicate the completion of the measurement. The color shades and ΔE values
are displayed in the instrument as shown in fig 1-a and b
Maintain a minimum distance of 2mm to the tissue margin
To receive the extended color information, highlight and select one of the
displayed shade results.
Totally 30 readings can be recorded. Once 30 measurements are completed,
they can be shared into computer or mobile phones via bluetooth and the next
set of readings are recorded.
Technical data
1. Spectrophotometer, measurement ranges from 400 -700nm
2. Inductive charging concept with long life AA batteries
3. Output of all tooth shades in the established and standardized shade
systems were displayed in the form of VITA classical shade and VITA
3D-MASTER, as well as signs of the VITABLOCS shades and bleached
index, in tendering with the American Dental Association.
4. Display of Lab and LCh values
5. Bluetooth interference for wireless communication with the VITA Assist
PC software and VITA mobile Assist app.
VISUAL METHOD:
The study was proceeded with the same 50 subjects using visual method of
shade selection i.e., VITA CLASSICAL SHADE TAB as shown in (fig 2-a).
Among the subjects, the middle one third of the right maxillary central incisor
was selected for evaluation of shade. From the shade tabs, Hue was selected first
followed by Chroma. Based upon the corresponding shade tabs, the suitable shade
Inorder to avoid weariness or prostration of the eye, there should be 5s or 7s
interval for the investigator to have look at the blue color cardboard sheet as shown in
(fig 2-b). To avoid colour confusion make up and lipstick has to be removed. Shade
selection should not be continuously performed for more than 3 subjects to avoid
error. It was carried out in natural day light 12.00 pm-3.00 pm in clear skies. The
subject were viewed at the eye level by placing the shade tab next to the selected
tooth. Entire procedure was done with propersterilization, inclusive and exclusive
criteria for standardization. Thus visual method of shade selection was done to the
subjects.
DIGITAL PHOTOGRAPHY METHOD:
The study was proceeded with the same 50 subjects using digital photography
method i.e., CANON EOS 750D as shown in (fig 3-d)Eos 750D features a 24.2 –
mega pixel sensor and is specifically designed for casual Photographers who prize
excellent image quality, simple and user friendly interface.
The camera was mounted using Harison tripod stand that consist of
3 way pan head
Geared elevator
Using CANON EOS 750D series as shown in (fig 3-a), SLR camera with
Harison tripod standas shown in (fig 3-b), the study was conducted. It was connected
to laptop (HP laptop) with an image analysing software( Adobe photoshop CS
software).
The following procedure was used for image capture for each subject.
1) Patient cheek was drawn back with the help of cheek retractor
2) With the help of lubricant such as petroleum jelly,18% reflectant grey card
dipped in 25% alcohol for disinfection was placed on left maxillary central
incisor.
3) According to the occlusal level or plane of the patient, the upright arm of the
tripod stand was adjusted. The optical axis of the camera was oriented
perpendicular to the patient’s frontal plane
4) For obtaining correct proportion of the image, the distance between the camera
and the patient was maintained upto70 cm.
5) A digital photograph was captured with following camera settings
Magnification - 1:1 ratio
White balance - automatic
Aperture - automatic
Manual flash mode - off
Fixed white balance –off
Image resolution- high image resolution
File type - JPEG with the same degree of image compression
ISO value - 125 selected
6) The image was processed using Adobe CS software as follows:
The image was captured and saved as JPEG
By clicking “CTRL+O” the rescued JPEG was opened in the Adobe
photoshop CS6 software
By clicking “CTRL+L” the levels dialog which consist of histogram
To obtain L*a*b* values of the tooth, middle dropper tool was passed
over the grey card of maxillary left central incisor. Red,blue and green
vales are thus secured.
Inorder to change RBG values to L*a*b* values the following steps
were initiated.
1. In the main toolbar, the image was clicked
2. Mode was selected
3. Followed by L*a*b* color
Thus the L*a*b* values of grey card are obtained.
54, 0 and 0 are known L* a* b* values of the grey card. The L* a* b* values
so obtained by the grey card must be modified/regulated to these values. This
was completed by clicking on “image” followed by “adjustments” and
“hue/saturation.” Similarly, the a* and b* values were found.
Using the grey card as a reference as shown in (fig 3-c), the photograph was
thus systematized.
The Magnetic Lasso Tool and The “Magic Wand” in the software were used.
Magnetic Lasso Tool describes the area on the right central incisor whose
of the mirroring/reflection on the tooth surface. The right central incisor was
now ready for deduction of its L* a* b* values which was done using the
depiction in the histogram toward the right‑hand side of the screen.
By using the CIEL* a* b* system formula, L* a* b* values thus obtained by
the Adobe software were converted as follows,
• L* = L1 × 100/255
• a* = (a1 − 128) × 240/255
• b* = (b1 − 128) × 240/255
Where L1, a1, and b1 were the L*, a*, b* values obtained using Adobe
Photoshop software.
To find out ΔE ( difference in shade), L*a* b* values of digital photographic method
and L*a* b* values of spectrophotometric method was deliberated by using the
formula,
ΔE = [(L1 − L2)² + (a1 − a2)² + (b1 − b2)²]1/2
Wherein, L1, a1, and b1 were the L*, a*, and b* values obtained by the
Spectrophotometric analysis and L2, a2, and b2 were the L*, a*, and b* values
The digital photographic method gave a data/results in terms ofthe L*, a*, and b *
values. These L*, a*, and b * values cannot be directly converted into a standard tooth
shade (e.g., B1,A1, A2,B2 etc.). Therefore, score of “agreement”was given with Δ E
SPECTROPHOTOMETRIC METHODS
Fig 1-b VitaEasy Shade Advance 4.0 showing ΔE values Fig 1-a VitaEasy Shade Advance 4.0 showing shade color
[image:51.595.138.489.276.748.2]CONVENTIONAL METHOD
Fig 2-b Bluereflectant cardboard
[image:52.595.177.445.87.763.2]DIGITAL METHOD
Fig 3-a Canon EOS 750D
Fig 3-c Grey reflectant card in patient mouth
Fig 3-b Harison tripod stand
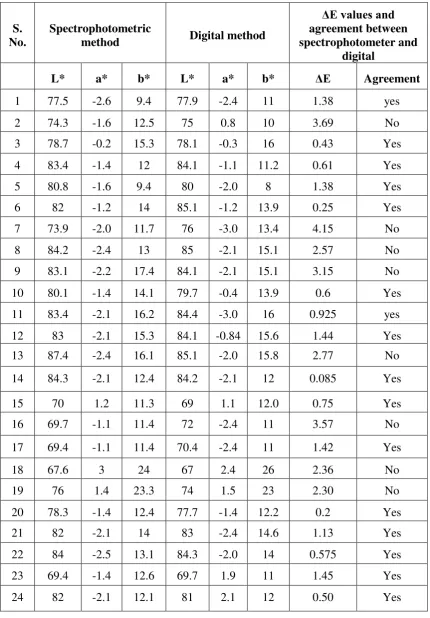
Table 1: ΔE values and agreement between spectrophotometer and digital
methods
S. No.
Spectrophotometric
method Digital method
ΔE values and agreement between spectrophotometer and
digital
L* a* b* L* a* b* ΔE Agreement
1 77.5 -2.6 9.4 77.9 -2.4 11 1.38 yes
2 74.3 -1.6 12.5 75 0.8 10 3.69 No
3 78.7 -0.2 15.3 78.1 -0.3 16 0.43 Yes
4 83.4 -1.4 12 84.1 -1.1 11.2 0.61 Yes
5 80.8 -1.6 9.4 80 -2.0 8 1.38 Yes
6 82 -1.2 14 85.1 -1.2 13.9 0.25 Yes
7 73.9 -2.0 11.7 76 -3.0 13.4 4.15 No
8 84.2 -2.4 13 85 -2.1 15.1 2.57 No
9 83.1 -2.2 17.4 84.1 -2.1 15.1 3.15 No
10 80.1 -1.4 14.1 79.7 -0.4 13.9 0.6 Yes
11 83.4 -2.1 16.2 84.4 -3.0 16 0.925 yes
12 83 -2.1 15.3 84.1 -0.84 15.6 1.44 Yes
13 87.4 -2.4 16.1 85.1 -2.0 15.8 2.77 No
14 84.3 -2.1 12.4 84.2 -2.1 12 0.085 Yes
15 70 1.2 11.3 69 1.1 12.0 0.75 Yes
16 69.7 -1.1 11.4 72 -2.4 11 3.57 No
17 69.4 -1.1 11.4 70.4 -2.4 11 1.42 Yes
18 67.6 3 24 67 2.4 26 2.36 No
19 76 1.4 23.3 74 1.5 23 2.30 No
20 78.3 -1.4 12.4 77.7 -1.4 12.2 0.2 Yes
21 82 -2.1 14 83 -2.4 14.6 1.13 Yes
22 84 -2.5 13.1 84.3 -2.0 14 0.575 Yes
23 69.4 -1.4 12.6 69.7 1.9 11 1.45 Yes
S. No.
Spectrophotometric
method Digital method
ΔE values and agreement between spectrophotometer and
digital
L* a* b* L* a* b* ΔE Agreement
25 78.5 0.7 14 78.4 -0.9 12 2.025 No
26 77.6 -0.5 16.4 76.7 -0.6 16 0.49 Yes
27 74 1.4 32.4 74.3 1.6 32.1 0.145 Yes
28 81.4 -2.4 12.6 80.9 -2.1 12 0.755 Yes
29 78 -1.4 16.1 78.2 1.1 16 0.07 Yes
30 63.7 -2.5 18.4 66.1 -2.4 17.1 3.73 No
31 84.1 -2.1 12.1 83.9 -0.4 12 1.47 Yes
32 77.4 -1.2 11 76.9 -1.2 10.4 0.305 Yes
33 85.2 -1.4 15.1 84.6 -1.3 13 2.39 No
34 79.6 -1.5 15.5 80.1 2.1 15 0.43 Yes
35 82.5 -2.0 13.7 82.4 -0.5 12 2.575 No
36 66.8 -0.4 20.9 67.1 -0.6 20.5 0.73 Yes
37 73.3 -1.3 12.0 73.5 -2.9 12.2 1.68 Yes
38 78.4 -3.0 10.6 80 -2.6 10 1.54 Yes
39 77.4 -1.5 12.4 76.1 -1.8 11.6 1.61 Yes
40 81.0 -1.4 11.6 79.9 -1.4 13 1.58 Yes
41 82.9 -2.4 10.5 82.6 -2.1 11 1.02 Yes
42 86.4 -2.2 17.1 85.9 -2.3 17.4 0.625 Yes
43 80.9 -1.4 15.8 81.0 -1.8 15.3 0.21 Yes
44 84.4 3.4 33.0 83.9 3.1 29.9 5.38 No
45 84.2 3.4 23.1 83.9 3.2 22 1.25 Yes
46 78.9 -1.6 14.3 78.5 -1.3 14 0.49 Yes
47 79.1 -1.2 12.5 77.2 -0.9 12 2.38 No
48 69.2 4.6 30.4 70.4 4.3 30.4 1.17 Yes
49 82.1 -2.0 14.1 80.9 0.9 14 1.33 Yes
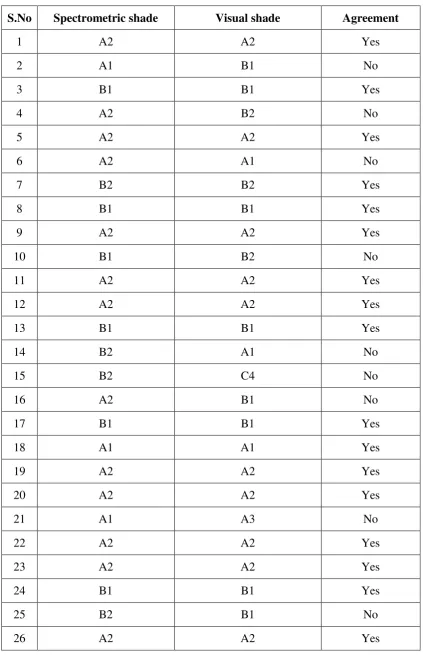
Table 2. Agreement between spectrophotometer and visual methods
S.No Spectrometric shade Visual shade Agreement
1 A2 A2 Yes
2 A1 B1 No
3 B1 B1 Yes
4 A2 B2 No
5 A2 A2 Yes
6 A2 A1 No
7 B2 B2 Yes
8 B1 B1 Yes
9 A2 A2 Yes
10 B1 B2 No
11 A2 A2 Yes
12 A2 A2 Yes
13 B1 B1 Yes
14 B2 A1 No
15 B2 C4 No
16 A2 B1 No
17 B1 B1 Yes
18 A1 A1 Yes
19 A2 A2 Yes
20 A2 A2 Yes
21 A1 A3 No
22 A2 A2 Yes
23 A2 A2 Yes
24 B1 B1 Yes
25 B2 B1 No
S.No Spectrometric shade Visual shade Agreement
27 B1 B1 Yes
28 A1 A1 Yes
29 A2 A2 Yes
30 A2 A2 Yes
31 A2 A2 Yes
32 B1 B1 Yes
33 A2 A2 Yes
34 A2 A2 Yes
35 B1 B1 Yes
36 B1 B1 Yes
37 B1 A1 No
38 A1 A1 Yes
39 A2 A2 Yes
40 B1 B1 Yes
41 B2 B2 Yes
42 A2 A2 Yes
43 B1 B2 No
44 A2 A3 No
45 A2 A2 Yes
46 A2 A1 No
47 B1 B1 Yes
48 B2 B1 No
49 B1 B1 yes
DATA PREPARATION:
The data was compiled in Microsoft excel sheet and transferred to version 20
SPSS software.
Descriptive statistics and Inferential statistics are been applied.
The data that was obtained is not normally distributed therefore non parametric
[image:58.595.335.545.544.724.2]analysis was used. The following data values are mentioned below:-
Table 3. Tests of Normality
Kolmogorov-Smirnova Shapiro-Wilk
Statistic Df Sig. Statistic df Sig.
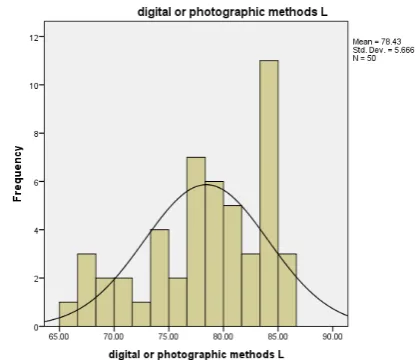
Spectrophotometric methods L 0.155 50 0.004 0.919 50 0.002
Digital or photographic methods L 0.113 50 0.148 0.914 50 0.001
Spectrophotometric methods a 0.285 50 0 0.78 50 0
Digital or photographic methods a 0.145 50 0.01 0.901 50 0.001
Graph 1: Test of normality between spectrophotometer and digital or
METHODS GROUP
Group 1 – conventional or visual shade selection
Group 2- spectrophotometric method
Group 3- digital or photographic method
In this study, L, a,b values of tooth shade was selected between
spectrophotometric method and digital method. The mean, standard deviation, z
[image:59.595.102.531.361.722.2]values and p values are calculated and tabulated as follows.
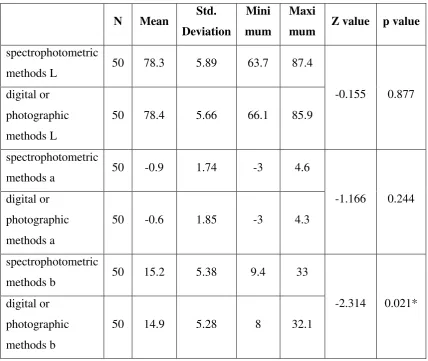
Table 4:Comparison between spectrophotometric and digital or photographic
methods using wilcoxon signed rank test.
N Mean Std.
Deviation
Mini
mum
Maxi
mum Z value p value
spectrophotometric
methods L 50 78.3 5.89 63.7 87.4
-0.155 0.877 digital or
photographic methods L
50 78.4 5.66 66.1 85.9
spectrophotometric
methods a 50 -0.9 1.74 -3 4.6
-1.166 0.244 digital or
photographic methods a
50 -0.6 1.85 -3 4.3
spectrophotometric
methods b 50 15.2 5.38 9.4 33
-2.314 0.021* digital or
photographic methods b
50 14.9 5.28 8 32.1
The difference in shade between digital and spectrophotometric was analysed
[image:60.595.147.481.192.268.2]and the mean and standard deviation for ΔE was tabulated below.
Table 5: Descriptive statistics of ΔE Values.
N Mean Std. Deviation Median
E values 50 1.49 1.29 1.17
The tooth shade was selected between conventional and spectrophotometric
method and analysed by using Chi-Square test and p value for the test is calculated
and tabulated as follows
Table 6: Comparison between spectrophotometric method and visual method
using Chi-Square test.
Visual Chi-Square
Value
p
value
a1 a2 a3 b1 b2 c4 Total
Spectro
photo
metric
methods
a1 3 0 1 1 0 0 5
62.261 0.0001**
a2 2 19 1 1 1 0 24
b1 1 0 0 12 2 0 15
b2 1 0 0 2 2 1 6
Total 7 19 2 16 5 1 50
P value <0.05*- statistically significant
[image:60.595.101.518.456.676.2]Measurement of agreement between digital and spectrophotometric method
was done and kappa value and p value was calculated. Spearmen correlation also
[image:61.595.103.524.193.349.2]calculated and tabulated as follows
Table 7: Descriptive and inferential statistics for measure of agreement.
Frequ
ency Percent
Measure of agreement
Spearman Correlation
Kappa
value P value r value P value
Agree ment
Yes 36 72
0.597 0.001 0.628 0.001
No 14 28
Total 50 100
Measurement of agreement between visual and spectrophotometric method
was done and kappa value and p value was calculated. Spearmen correlation also
calculated and tabulated as follows:
Table 8: Descriptive and inferential statistics for measure of agreement.
Frequency Percent
Measure of agreement Spearman Correlation Kappa value P value r
value P value
Agree ment
yes 36 72
0.597 0.001 0.628 0.001
no 14 28
[image:61.595.106.515.512.665.2]Graph 2: Distribution of percentage of agreement between visual and
spectrophotometric method and between digital and spectrophotometric method
yes no
72
28
Per
ce
n
tage
Percentage of agreement
RESULTS FOR SPECTROPHOTOMETRIC AND DIGITAL METHOD
In this study, L, a, b values of tooth shade selected between
spectrophotometric and digital method was analysed by using wilcoxon
signed rank test. Among the 50 parameters, 3 mean were taken from both
spectrophotometer and photographic method and standard deviation was
calculated from those mean.
Table 9: Mean and Standard deviation between spectrophotometer and digital method
MEAN STANDARD DEVIATION
78.3,78.4 5.89, 5.66
-0.9, -0.6 1.74, 1.85
15.2-14.9 5.38 , 5.28
Table 10: Z and P values of spectrophotometer and digital method
Z VALUES P VALUES
78.3,78.4 5.89, 5.66
-0.9, -0.6 1.74, 1.85
15.2-14.9 5.38 , 5.28
Z and P shows statistically significant (P value <0.05*- statistically
significant)Similarly, the mean and standard deviation for ΔE (the difference in shade
between spectrophotometric and digital photographic values are
Mean – 1.49
RESULTS FOR SPECTROPHOTOMETRIC AND CONVENTIONAL
METHOD
Tooth shade selected between spectrophotometric and visual method was
analysed by using Chi-Square test.
Chi – square value = 62.216 and the p value = 0.0001 which shows highly
significant
(P value <0.05*- statistically significant
P value <0.001**- Highly significant)
On estimating the consensus between the spectrophotometric and digital
method, kappa co efficient values will be 0.597 and p value will be 0.001
which shows statistically significant with higher proportion. The
non-parametric measure of spearmen rank co relation will be 0.628 and the p
value for that rank is 0.001 which shows statistically significant.
On estimating the consensus between the spectrophotometric and visual
method, kappa co efficient values will be 0.597 and p value will be 0.001
which shows statistically significant with higher proportion. The
non-parametric measure of spearmen rank co relation will be 0.628 and the p
Esthetics is often the primary motivating factor for patient seeking dental care. A successful restoration will provide the patient with excellent long-term function. The aim of the dentist is to develop for his patient, a restoration that is best to meet the patient’s physiological and biological desires.
The focus of dentistry in the present times is not only the prevention and treatment of diseases but on meeting the demand for better esthetics. Esthetic dentistry is emerging as one of the challenging branches of this field
The importance of esthetics in restorative dentistry has improved among population. Proper shade matching by the dentist is not so easy because it is based upon individual opinion. This becomes tangled by the circumstances of different shade systems. Color evaluation has carved up into 2 categories such as instrumental and visual methods. This study was done to determine the production and performance of correct shade matching method to be practised in a clinical set up(7)
SPECTROPHOTOMETRIC METHOD:
Shade matching of maxillary anterior is one of the tough clinical challenges faced in Dentistry(14). Prediction and interpretation of tooth color information in
ceramic work is a crucial step in color reproduction. Generally spectrophotometer is considered as more authentic when compared to colorimeter in both invivo(11) and
invitro(4,5) studies. However spectrophotometer method of shade evaluation is
agreement for the usage of shade selection in dentistry because of the following reasons.
Precise and reproducible tooth shade determination in seconds –latest
measuring technology.
Objective and reliable measurements –LED technology that is unaffected by
ambient conditions.
Reliable and economical – reliable shade reproduction and reduced shade
corrections(24)
Simple and intuitive – easy to use touch screen and software
Efficient digital communication – exchanging information about tooth shade
and images between dental practice and laboratory (47).
One of the main aim of aesthetic dentistry is to provide functional and natural appearing dental restorations to the patients. To achieve this, spectrophotometers are specially designed to meet the patient demands. Spectrophotometer is an instrument that is basically designed with the following components(1)(24)
Optical radiation
Detector
Spectrophotometer measures and records the energy that are reflected back from the tooth and able to convert that light into signals by signal processing system. It also consist of photodiode detector that stores the light at each wave length. One should abide that natural tooth doesn’t have the unique properties of color, due to the enamel translucency, polychromatic nature of the dentin and fluorescence. Hence L, a, b values are co ordinated in shade tab. Manufacturers incorporated this L, a, b values in spectrophotometer for easy identification of color(1). Spectrophotometer is
not affected by an ambient light(14)The spectrophotometer Vita easy shade advance
4.0 is used in this study. It was developed for fast, precise and reliable shade determination of natural teeth and ceramic restorations in clinical setup. Tooth shade determined by VITA Easy shade are recorded and communicated professionally. The Windows-based PC software combines digital patient photos with all relevant patient tooth information. At the same time it allows for case documentation and provides the basic efficient data exchange between the dental practice and laboratory. During the measurement process, the tooth is illuminated by periphery of spectrophotometer tip directing the light from bulb of halogen onto the tooth surface(24)
Data from VITA Easy shade V is wirelessly transmitted to the app via an internal Bluetooth interface and can be combined with the patient photos and can be sent conveniently from a smartphone or tablet(52).
Conventional method:
varies from 1,000 kelvin during sunset to over 20,000kelvin in clear blue sky(8). There
are three important things to be considered in shade matching to maintain the standardization as follows(8),
Light source
Object
Detector
Natural sunlight is a mixture of component that falls from the sky along the electromagnetic spectrum of 380nm and 750nm. As the light enters the eye, it is received by the cornea and the lens and the image gets focussed on retina. The pupils gets narrowed during the high illumination and the pupils gets widened during dim or low light(10),(24).
There will be confusion in color vision. It is categorized under 2 conditions
Genetic color vision confusion and
Acquired color vision confusion
Acquired color vision confusion are received from certain conditions as follows,
Diabetes
Leukaemia
Alcoholism
Sickle cell anaemia
Multiple sclerosis
Papillary diameter affected by emotion
Yellowing of cornea ( purple and blue color are difficult to distinguish) (26)
Munsell color test and pseudo chromatic color test are performed by investigator as guided by Ophthalmologist(12). The Munsell color system showing
circle of hues at value 5, chroma 6 and the neutral values from 0 to 10. Pseudo chromatic color plates showing colored dots and the number hidden within the dots. Investigator should get informed consent from the students before starting the procedure and also should get necessary acquiesce from the Ethical committee of the institution(41).
Color perception may vary among the individual observer, so a single investigator is employed in the study(11) .The investigator should not continuously
confusion, make up and lipstick has to be removed, from the subject. The subject were viewed at the eye level by placing the shade tab next to the selected tooth. The shade guide shows variations under fluorescence, incandescence or daylight(18). In
order to follow the organised systematization during the entire process, shade selection procedure(40) was carried out in natural day light 12.00 pm-3.00 pm in clear
skies of bright sunny day of northern facing sunlight. This is because, for centuries, artist use northern daylight to distinguish color difference (17) and the ideal use of
natural light source is mid day to 3.00pm.
Entire procedure was done with proper sterilization(48) , and to avoid any false
reading during procedure, restorations, presence of crowns and veneers, endodontically treated teeth, fractured or non-vital teeth were excluded(14). These
procedures were excluded because of enamel translucency, polychromatic nature of dentin, tooth dehydration due to prolonged procedure(18)
Visual shade selection is proceeded after getting certified from the experienced opthamalogist. Using Vita classical shade guide is the conventional method most commonly used by the clinician for decades. It is considered as gold standard in dentistry and so is chosen for the comparison(14) in this study ( Vita
Zahnfabrik, H.Rauterlimbh and co. KG, Bad Sackingen, Germany ). Hue has to be selected first followed by Chroma. Shade tab is arranged alphabetically as follows, A-Orange, B-yellow, C-yellow/ gray, D-orange /gray(24)1-least chromatic highest
Digital photographic method:
Digital photography is the third method employed in this study. Between dentist and dental technicians, digital photography could be the major tool in exchanging of information. Recently visual method of shade selection has been replaced by the digital means(65). This is because it can exactly replicate the color
with its high imaging quality(29)
Due to increasing in digital photography and imaging software, the use of digital camera is now omnipresent in color imaging. The primary purpose of using digital photography in dentistry is for recording various aspects of clinical procedures and information in the oral cavity(19). They may also includes,
Dental documentation Progress and monitoring Communication
Marketing
More than any other health speciality, dentistry has benefited from this trend. It becomes an invaluable asset in daily dental practice. A single picture can explain a hundred words rather than description. Properly maintained records will prevent post-treatment disputes(19).
standard digital (SLR) camera with interchangeable digital sensor would deserve this question(6)
Cameras are classified based upon following criteria’s
Single lens reflection – with interchangeable lens
Digital camera and intra oral camera – without interchangeable lens
DSLR –combination of digital with single lens reflection
Canon Eos 750D is used in this study with recommended parameters and settings. DSLR features an intelligent viewfinder which gives a much enhanced shooting experience. As you look through the viewfinder, you can more easily see the viewpoint, any active auto focusing (AF) areas, and also the shooting information is clearly displayed(29).
18% grey card is used in this study for standardization. A grey card is a middle reference, typically used together with the reflective light meter, as a way to produce consistent image exposure and /or color in film and photography(29). The red, blue and
green values are equal for grey card and hence it considered as a neutral target. Since the grey card had an unquestionable value, the Adobe photoshop CS6 also integrates as grey and thus removing the tint of particular color, usually unwanted, which affects the whole or portion of a photographic image evenly(62).
The vertical arm of the stand and optical axis of the camera were adjusted as guided. The image was captured as a measured distance of 70cm between camera and patient and the proceed image was transferred to Adobe CS photoshop to get L a b values of the image(29). The L a b values are again converted into L*, a* and b* values
by using the formula
L* = L1 × 100/255
a* = (a1 − 128) × 240/255
b* = (b1 − 128) × 240/255
The difference in shade (ΔE) between spectrophotometric and digital photography was calculated by using the formula,
ΔE = [(L1 − L2)² + (a1 − a2)² + (b1 − b2)²]1/2