A Prospective Study of Trans-Fatty Acid
Levels in Blood and Risk of Prostate Cancer
The Harvard community has made this
article openly available.
Please share
how
this access benefits you. Your story matters
Citation
Chavarro, J. E., M. J. Stampfer, H. Campos, T. Kurth, W. C.
Willett, and J. Ma. 2008. “A Prospective Study of Trans-Fatty
Acid Levels in Blood and Risk of Prostate Cancer.” Cancer
Epidemiology Biomarkers & Prevention 17 (1): 95–101. https://
doi.org/10.1158/1055-9965.epi-07-0673.
Citable link
http://nrs.harvard.edu/urn-3:HUL.InstRepos:41292844
A Prospective Study of
Trans
-Fatty Acid Levels in Blood and
Risk of Prostate Cancer
Jorge E. Chavarro,1,3Meir J. Stampfer,1,2,3Hannia Campos,1Tobias Kurth,2,4
Walter C. Willett,1,2,3and Jing Ma3
Departments of1Nutrition and2Epidemiology, Harvard School of Public Health; and3The Channing Laboratory and4Divisions of Aging and Preventive Medicine, Department of Medicine, Brigham and Women’s Hospital and Harvard Medical School, Boston, Massachusetts
Abstract
Background: Previous studies suggest a positive asso-ciation between markers oftrans-fatty acid intake and prostate cancer. We therefore prospectively evaluated the association between blood trans-fatty acid levels and risk of prostate cancer.
Methods: We conducted a nested case-controlstudy among 14,916 apparently healthy men who provided blood samples in 1982. Blood fatty acid levels were determined for 476 men diagnosed with prostate cancer during a 13-year follow-up and their matched controls. Controls were individually matched to cases according to age and smoking status at baseline. Conditional logistic regression was used to estimate the relative risk and 95% confidence intervalof total, nonaggressive (stage A/B and low grade), and aggressive (stage C/D, high grade, subsequent distant metastasis or death) prostate cancer associated with blood levels of specifictrans-fatty acids. Results: Blood levels of all the trans-fatty acids examined were unrelated to total prostate cancer
risk. When results were divided according to tumor aggressiveness, blood levels of 18:1n-9t, all the 18:2t examined, and total trans-fatty acids were positively associated to nonaggressive tumors. The relative risks (95% confidence intervals; P trend) comparing top with bottom quintile trans-fatty acid levels were 2.16 (1.12-4.17; 0.11) for 18:1n-9t, 1.97 (1.03-3.75; 0.01) for total18:2t, and 2.21 (1.14-4.29; 0.06) for total trans-fatty acids. None of the trans fats examined was associated with aggressive prostate tumors.
Conclusion:Blood levels of trans isomers of oleic and linoleic acids are associated with an increased risk of nonaggressive prostate tumors. As this type of tumors represents a large proportion of prostate cancer detected using prostate-specific antigen screening, these findings may have implications for the preven-tion of prostate cancer. (Cancer Epidemiol Biomarkers Prev 2008;17(1):95 – 101)
Introduction
Trans-fatty acids are unsaturated fatty acids with at least one double bond in the trans, rather than the cis, configuration. Most of thetrans-fatty acids in diet come from foods containing partially hydrogenated vegetable oils, mainly from semisolid fats used in margarines and commercial food preparation (1). Trans fats resulting from bacterial action in ruminant animals are also consumed in smaller amounts from meats and dairy products.Trans-fatty acids have been implicated in the development of coronary heart disease and type 2 diabetes (1) and may also play a role in the etiology of prostate cancer. Intake of trans fats increases systemic inflammation (2-4) and insulin resistance (5, 6), both of which may play a role in prostate carcinogenesis (7, 8). Additionally, these fats interfere with the transcription of genes that may be important in the initiation and
progression of prostate cancer and other epithelial tumors (9, 10). Five studies have explored the association betweentrans-fatty acids and prostate cancer (11-15), and of these, only two have examined whether the potential effect of trans fats differed according to tumor clinical characteristics (12, 13). We have previously examined the association between whole blood (16) levels of poly-unsaturated fatty acids and prostate cancer risk. Here, we report the results of a prospective case-control study nested within the Physicians’ Health Study that examines the association between levels of trans-fatty acids in whole blood, a suitable biomarker of intake (17), and risk of prostate cancer overall and separately for clinically aggressive and nonaggressive tumors.
Materials and Methods
This study is based in the Physician’s Health Study (18, 19), a randomized trial of aspirin and h-carotene among 22,071 U.S. male physicians, ages 40 to 84 in 1982, without a history of cardiovascular disease, cancer, or other major illnesses. Written informed consent was obtained from each participant and the study was approved by the Human Research Committee at Brigham and Women’s Hospital. Participants completed prerandomization questionnaires where they reported information on risk factors for cardiovascular disease and cancer, including anthropometric characteristics, a Received 7/25/07; revised 10/25/07; accepted 11/2/07.
Grant support:Research grants CA42182, CA58684, CA90598, CA34944, CA40360, HL26490, and HL34595; training grant T32 DK-007703; and Yerby Postdoctoral Fellowship Program.
The costs of publication of this article were defrayed in part by the payment of page charges. This article must therefore be hereby markedadvertisementin accordance with 18 U.S.C. Section 1734 solely to indicate this fact.
Requests for reprints:Jorge E. Chavarro, Department of Nutrition, Harvard School of Public Health, 665 Huntington Avenue, Boston, MA 02115. Phone: 617-432-4584; Fax: 671-432-2435. E-mail: jchavarr@hsph.harvard.edu
short dietary questionnaire, and physical activity habits. Follow-up questionnaires were mailed at 6 and 12 months after randomization and yearly thereafter. Blood speci-mens were collected before randomization from 14,916 (68%) physicians and stored at82jC. The current report concerns newly reported prostate cancer cases during the first 13 years of follow-up among the men who provided a baseline blood sample. During this period, >99% of surviving participants were still reporting morbidity events and vital status was known for the entire cohort.
Selection of Cases and Controls.For each new report of prostate cancer, we requested hospital records and pathology reports for review by study physicians to confirm diagnosis and abstract the tumor stage and grade at diagnosis. Histologic grade was recorded as well-differentiated, moderately differentiated, or poorly differentiated tumors or following the Gleason scoring system, as available in the pathology reports. Stage was recorded according to the modified Whitemore-Jewett classification scheme (20). Cases without pathologic staging were classified as indeterminate stage unless there was clinical evidence of distant metastases. Cases were classified according to their clinical aggressive-ness. Nonaggressive cases were defined as those with localized (stage A or B) and low-grade (Gleason <7 or well or moderately differentiated) tumors at diagnosis. Cases were considered aggressive when they presented as advanced disease (stage C or D) or high grade (Gleason z7 or poorly differentiated) at diagnosis or subsequently developed distant metastases or died from prostate cancer.
We selected a control subject for each confirmed case among the men who had provided a blood sample, had not had a partial or total prostatectomy, and had not reported prostate cancer at the time that the case’s diagnosis was reported. Controls were individually matched by age (within 1 year for men <55 years and within 5 years for menz55 years) and smoking status at baseline (current, former, or never). Of the 758 cases accrued through 1995, 505 had enough blood for fatty acid level determination. Case and control subjects whose blood sample was received >6 days after it was drawn were excluded from analyses, leaving 476 cases and their matched controls.
Laboratory Analyses.Blinded samples from cases and controls were analyzed together in random order to reduce any effect of interassay variability. Fatty acids were extracted from whole blood and quantified by gas-liquid chromatography on a fused silica capillary
[image:3.585.54.530.82.355.2]cis/trans column (SP2560, Supelco) as previously de-scribed (17). Peak retention times were identified by injecting known standards (Nu-Check Prep) and ana-lyzed with the ChemStation A.08.03 software (Agilent Technologies). The fatty acid levels in each sample were expressed as the percentage of total fatty acids. Coeffi-cients of variation for all fatty acid peaks were measured by analyzing quality control samples indistinguishable from study samples randomly distributed throughout the study samples. The coefficients of variation fortrans -fatty acids ranged from 1.24% for 16:1n-7t to 4.97% for 18:2n-6tc. For each participant, we took the sum of the peaks for 18:1n-12t, 18:1n-9t, and 18:1n-7t; 18:2n-6tt, Table 1. Baseline characteristics of prostate cancer cases and control subjects
Cases (n= 476) Controls (n= 476) P*
Age at baseline (y)c 58 (53-64) 58 (53-63) b
Length of follow-up (y)c 9 (7-11) —
Age at diagnosis (y)c 67 (62-72) —
Disease status at diagnosis (%)
Localized (stage A or B) 61 —
Advanced (stage C or D) 23 —
Undetermined 16 —
Tumor grade at diagnosis (%)
Gleason <7 or well or moderately differentiated 65 — Gleasonz7 or poorly differentiated 33 —
Undetermined 2 —
Date of diagnosis (%)
Before October 1, 1990 33 —
On or after October 1, 1990 67 —
Smoking status (%) b
Current 8 8
Former 42 42
White/Caucasian (%) 95 93 0.51
Height (m)c 1.78 (1.75-1.83) 1.78 (1.73-1.83) 0.12
BMI (kg/m2)c 24.4 (23.1-25.8) 24.2 (22.8-25.8) 0.13
Regular multivitamin use (%) 21 24 0.47
Vigorous exercise twice per week or more (%) 58 55 0.41
Alcohol use once per day or more (%) 32 30 0.47
Whole milk once per day or more (%) 7 8 0.71
Low-fat milk once per day or more (%) 27 23 0.17
Bloodtrans-fatty acids (% of total fatty acids)
Total 18:1trans-fatty acids 1.07 (0.89-1.42) 1.09 (0.87-1.37) 0.47 Total 18:2trans-fatty acids 0.56 (0.45-0.65) 0.53 (0.44-0.66) 0.08 Totaltrans-fatty acids 1.82 (1.56-2.28) 1.81 (1.51-2.18) 0.26
*Pvalues were computed using the Wilcoxon sign rank test for continuous variables and the McNemar’s test for categorical variables. cValues expressed as median (25th-75th percentile).
bCases and controls were individually matched on these variables. Trans-Fatty Acids and Prostate Cancer
18:2n-6tc, and 18:2n-6ct; and all the trans-fatty acids measured to estimate the 18:1, 18:2, and totaltrans-fatty acid levels, respectively.
StatisticalAnalyses.We calculated median values and proportions of the baseline characteristics of cases and controls. Differences in these characteristics were tested using the McNemar’s test for categorical variables and the Wilcoxon sign rank test for continuous variables. Cases and controls were divided into five groups according to quintiles of trans-fatty acid levels among the controls. Then, we used conditional logistic regres-sion models to estimate the risk of prostate cancer in a given quintile of fatty acid level relative to the risk in the lowest quintile while simultaneously accounting for the matching factors. We considered the potential confound-ing effects of baseline characteristics by addconfound-ing to the initial model terms for variables associated with prostate cancer and fatty acid levels at P < 0.20 and evaluating whether adding these variables changed the initial fatty
acid estimates by >10%. Because linoleic anda-linolenic acids share common food sources withtransfats, we also did additional analyses adjusting for blood levels of these fatty acids alone and simultaneously. Additionally, because fasting status could theoretically affect blood levels of fatty acids, we also evaluated fasting status as a potential confounder. None of the variables evaluated [height, body mass index (BMI; kg/m2), low-fat milk intake, blood levels of linoleic anda-linolenic acids, and fasting status] changed the initial estimates substantially and therefore results are presented with adjustment for matching factors only.
[image:4.585.57.531.291.695.2]Lastly, we refitted the regression models in subgroups defined by tumor aggressiveness, diagnosis before (through September 30, 1990) or after (since October 1, 1990) the widespread use of prostate-specific antigen screening, age at diagnosis (<65 andz65 years), baseline BMI (<25 and z25 kg/m2), and randomized aspirin assignment. Tests for linear trend were conducted in all
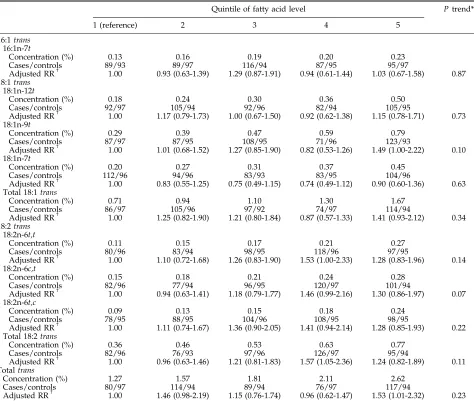
Table 2. RR (95% CIs) for prostate cancer by control quintiles of whole bloodtrans-fatty acid levels
Quintile of fatty acid level Ptrend*
1 (reference) 2 3 4 5
16:1trans
16:1n-7t
Concentration (%) 0.13 0.16 0.19 0.20 0.23
Cases/controls 89/93 89/97 116/94 87/95 95/97
Adjusted RRc 1.00 0.93 (0.63-1.39) 1.29 (0.87-1.91) 0.94 (0.61-1.44) 1.03 (0.67-1.58) 0.87 18:1trans
18:1n-12t
Concentration (%) 0.18 0.24 0.30 0.36 0.50
Cases/controls 92/97 105/94 92/96 82/94 105/95
Adjusted RRc 1.00 1.17 (0.79-1.73) 1.00 (0.67-1.50) 0.92 (0.62-1.38) 1.15 (0.78-1.71) 0.73 18:1n-9t
Concentration (%) 0.29 0.39 0.47 0.59 0.79
Cases/controls 87/97 87/95 108/95 71/96 123/93
Adjusted RRc 1.00 1.01 (0.68-1.52) 1.27 (0.85-1.90) 0.82 (0.53-1.26) 1.49 (1.00-2.22) 0.10 18:1n-7t
Concentration (%) 0.20 0.27 0.31 0.37 0.45
Cases/controls 112/96 94/96 83/93 83/95 104/96
Adjusted RRc 1.00 0.83 (0.55-1.25) 0.75 (0.49-1.15) 0.74 (0.49-1.12) 0.90 (0.60-1.36) 0.63 Total 18:1trans
Concentration (%) 0.71 0.94 1.10 1.30 1.67
Cases/controls 86/97 105/96 97/92 74/97 114/94
Adjusted RRc 1.00 1.25 (0.82-1.90) 1.21 (0.80-1.84) 0.87 (0.57-1.33) 1.41 (0.93-2.12) 0.34 18:2trans
18:2n-6t,t
Concentration (%) 0.11 0.15 0.17 0.21 0.27
Cases/controls 80/96 83/94 98/95 118/96 97/95
Adjusted RRc 1.00 1.10 (0.72-1.68) 1.26 (0.83-1.90) 1.53 (1.00-2.33) 1.28 (0.83-1.96) 0.14 18:2n-6c,t
Concentration (%) 0.15 0.18 0.21 0.24 0.28
Cases/controls 82/96 77/94 96/95 120/97 101/94
Adjusted RRc 1.00 0.94 (0.63-1.41) 1.18 (0.79-1.77) 1.46 (0.99-2.16) 1.30 (0.86-1.97) 0.07 18:2n-6t,c
Concentration (%) 0.09 0.13 0.15 0.18 0.24
Cases/controls 78/95 88/95 104/96 108/95 98/95
Adjusted RRc 1.00 1.11 (0.74-1.67) 1.36 (0.90-2.05) 1.41 (0.94-2.14) 1.28 (0.85-1.93) 0.22 Total 18:2trans
Concentration (%) 0.36 0.46 0.53 0.63 0.77
Cases/controls 82/96 76/93 97/96 126/97 95/94
Adjusted RRc 1.00 0.96 (0.63-1.46) 1.21 (0.81-1.83) 1.57 (1.05-2.36) 1.24 (0.82-1.89) 0.11 Totaltrans
Concentration (%) 1.27 1.57 1.81 2.11 2.62
Cases/controls 80/97 114/94 89/94 76/97 117/94
Adjusted RRc 1.00 1.46 (0.98-2.19) 1.15 (0.76-1.74) 0.96 (0.62-1.47) 1.53 (1.01-2.32) 0.23
models by using the median fatty acid levels in each quintile as a continuous variable. Tests for interaction by BMI, fasting status, or aspirin assignment in the trial were conducted by adding to the model fortrans fat levels a term for the variable of interest and a cross-product term betweentransfat levels (median level in each quintile as a continuous variable) and this variable. All statistical analyses were done using Statistical Analysis System, version 9.1 (SAS Institute). Results were considered to be statistically significant whenP< 0.05, two tailed. Results
At baseline, blood levels of 18:2trans fats were slightly higher in men who later developed prostate cancer compared with their controls (Table 1). There were no appreciable differences in the blood levels of 18:1 trans
or total trans fats or in other subject characteristics. Blood levels of 18:1 trans and 18:2 trans were highly correlated with each other and with the levels of total
trans-fatty acids. Trans-fatty acid levels were positively related to blood levels ofa-linolenic acid but unrelated to the levels of linoleic acid. Blood levels of trans-fatty acids were slightly higher in blood samples obtained with less than 8 h of fasting when compared with samples with 8 or more hours of fasting. The median (25th percentile-75th percentile) blood level of total
trans-fatty acids as percent of total fatty acids was 1.83% (1.55-2.27%) for nonfasted samples and 1.78% (1.51-2.06%) for fasted samples (P = 0.01).
Blood levels of 16:1t and 18:1 trans-fatty acids were unrelated to total prostate cancer risk (Table 2). Among the 18:2transfats, there was a suggestion of a linear trend
toward increasing risk of prostate cancer with increasing blood levels of c,t linolelaidic acid levels (18:2n-6c,t;
Ptrend = 0.07). Blood levels of the remaining 18:2trans -fatty acids, as well as the sum of all trans fats, were unrelated to total prostate cancer risk.
To assess whether bloodtrans-fatty acid levels might be influenced by preclinical cancer, we then divided the analyses by date of diagnosis. Blood levels of 18:2trans
fats were positively associated with prostate cancer diagnosed later in follow-up (on or after October 1, 1990) but not to cases occurring earlier. This tendency was strongest for levels ofc,tlinolelaidic acid (18:2n-6c,t). For tumors diagnosed later in follow-up, the relative risks [RR; 95% confidence interval (95% CI)] of prostate cancer for men in successively higher quintiles of blood 18:2n-6c,twere 1.11 (0.67-1.83), 1.13 (0.68-1.88), 1.57 (0.97-2.54), and 1.74 (1.04-2.93) when compared with men in the lowest quintile (P trend = 0.01). For tumors diagnosed earlier, the RR (95% CI) comparing men in the highest with men in the lowest quintile of 18:2n-6c,t
was 0.71 (0.35-1.47;P trend = 0.74). There were no clear differences in association between specific 16:1 trans -fatty acids and 18:1trans-fatty acids and overall prostate cancer risk according to the date of diagnosis.
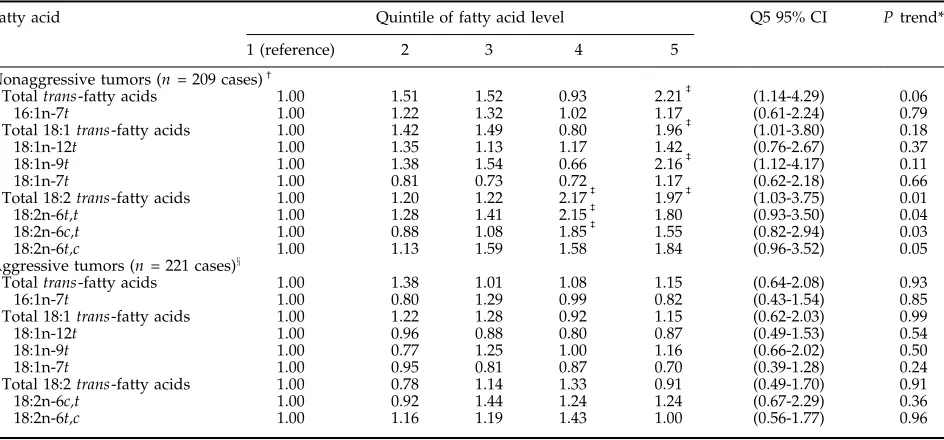
We then examined the association between blood
trans-fatty acid levels and prostate cancer separately for nonaggressive and clinically aggressive tumors (Table 3). Blood levels of totaltrans-fatty acids, as well as of some individualtrans-fatty acids, were positively associated with the risk of developing nonaggressive tumors but unrelated to the risk of developing aggres-sive prostate cancer. Men in the highest quintile of total
[image:5.585.59.531.94.314.2]trans-fatty acid levels had a >2-fold risk of developing Table 3. Adjusted RR (95% CIs) for nonaggressive and aggressive prostate cancer by control quintiles of whole bloodtrans-fatty acid levels
Fatty acid Quintile of fatty acid level Q5 95% CI Ptrend*
1 (reference) 2 3 4 5
Nonaggressive tumors (n= 209 cases)c
Totaltrans-fatty acids 1.00 1.51 1.52 0.93 2.21b (1.14-4.29) 0.06 16:1n-7t 1.00 1.22 1.32 1.02 1.17 (0.61-2.24) 0.79 Total 18:1trans-fatty acids 1.00 1.42 1.49 0.80 1.96b (1.01-3.80) 0.18 18:1n-12t 1.00 1.35 1.13 1.17 1.42 (0.76-2.67) 0.37 18:1n-9t 1.00 1.38 1.54 0.66 2.16b (1.12-4.17) 0.11 18:1n-7t 1.00 0.81 0.73 0.72 1.17 (0.62-2.18) 0.66 Total 18:2trans-fatty acids 1.00 1.20 1.22 2.17b 1.97b (1.03-3.75) 0.01 18:2n-6t,t 1.00 1.28 1.41 2.15b 1.80 (0.93-3.50) 0.04 18:2n-6c,t 1.00 0.88 1.08 1.85b 1.55 (0.82-2.94) 0.03 18:2n-6t,c 1.00 1.13 1.59 1.58 1.84 (0.96-3.52) 0.05 Aggressive tumors (n= 221 cases)x
Totaltrans-fatty acids 1.00 1.38 1.01 1.08 1.15 (0.64-2.08) 0.93 16:1n-7t 1.00 0.80 1.29 0.99 0.82 (0.43-1.54) 0.85 Total 18:1trans-fatty acids 1.00 1.22 1.28 0.92 1.15 (0.62-2.03) 0.99 18:1n-12t 1.00 0.96 0.88 0.80 0.87 (0.49-1.53) 0.54 18:1n-9t 1.00 0.77 1.25 1.00 1.16 (0.66-2.02) 0.50 18:1n-7t 1.00 0.95 0.81 0.87 0.70 (0.39-1.28) 0.24 Total 18:2trans-fatty acids 1.00 0.78 1.14 1.33 0.91 (0.49-1.70) 0.91 18:2n-6c,t 1.00 0.92 1.44 1.24 1.24 (0.67-2.29) 0.36 18:2n-6t,c 1.00 1.16 1.19 1.43 1.00 (0.56-1.77) 0.96
NOTE: Adjusted for matching factors: age, smoking status at baseline, and length of follow-up. *Calculated with median fatty acid concentration in each quintile as a continuous variable.
cDefined as localized disease (stage A or B) and low-grade tumors (Gleason <7 or well or moderately differentiated) at diagnosis. bP< 0.05, when compared with men in the lowest quintile of blood levels for the specifictrans-fatty acid.
xDefined as advanced disease (stage C or D) or high grade (Gleasonz7 or poorly differentiated) at diagnosis or subsequent development of distant
nonaggressive prostate cancer when compared with men in the lowest quintile (P = 0.02) with a tendency of a positive linear trend. The association between elaidic acid (18:1n-9t) and nonaggressive prostate tumors was similar to the association between total
trans fats and these tumors. There was also a positive association between blood levels of all 18:2trans isomers examined and total 18:2 trans fats with risk of nonaggressive prostate tumors. Men in the highest two quintiles of total 18:2trans fats had approximately twice the risk of nonaggressive prostate cancer than men in the lowest quintile and there was a statistically significant positive linear trend (P trend = 0.01). There were no associations between blood levels of thetrans -fatty acids examined and risk of advanced, high-grade, or aggressive prostate cancer. The associations of blood levels of 18:2trans fats and totaltransfats with localized (stage A/B) and low-grade (Gleason <7 or well or moderately differentiated) tumors resembled their asso-ciations with nonaggressive tumors. The RR (95% CI) comparing men in the highest with men in the lowest quintile of totaltrans-fatty acids was 2.21 (1.28-3.83) for
localized tumors and 1.82 (0.98-3.37) for low-grade tumors.
Lastly, we evaluated whether the association between
trans-fatty acids in blood and prostate cancer, overall and for nonaggressive tumors, differed according to age at diagnosis (<65 and z65 years), fasting status, random assignment into the aspirin arm of the trial, or baseline BMI (<25 andz25). The association between 18:2trans
[image:6.585.141.529.311.728.2]fats and prostate cancer seemed to be stronger among overweight and obese men than among normal weight men. The RRs (95% CI) of overall prostate cancer among normal weight men in successively higher quintiles of total 18:2trans levels in blood were 1.19 (0.70-2.04), 1.09 (0.66-1.82), 1.39 (0.84-2.29), and 1.21 (0.71-2.05) when compared with men in the lowest quintile (P trend = 0.40). The corresponding RRs (95% CI) among over-weight and obese men were 0.72 (0.36-1.42), 1.48 (0.74-2.97), 2.06 (1.02-4.16), and 1.31 (0.66-2.62;Ptrend = 0.14). Similarly, the association betweentransfats and prostate cancer seemed to be stronger among men assigned to the aspirin placebo arm of the trial than among men assigned to aspirin. The RRs (95% CI) of prostate cancer among
men assigned to aspirin placebo in successively higher quintiles of total 18:2translevels in blood were 1.00, 1.58 (0.84-3.00), 2.31 (1.23-4.33), 2.19 (1.20-4.00), and 2.65 (1.41-4.98; P trend = 0.003), whereas among the men assigned to aspirin the RR (95% CI) comparing the highest with the lowest quintile of total 18:2 trans was 0.63 (0.34-1.15;Ptrend = 0.40). For both BMI and aspirin, these apparent differences were more evident when only nonaggressive tumors were considered (Fig. 1), although tests for interaction were not statistically significant (P > 0.05 in all cases). On the other hand, there were no appreciable differences in the relations between indi-vidualtrans-fatty acids and prostate cancer risk according to fasting status or age at diagnosis (P interaction >0.05 in all cases). The RR (95% CI) comparing the highest with the lowest quintile of total trans-fatty acids was 1.54 (0.95-2.50) in the nonfasting samples and 1.94 (0.69-5.46) in the fasting samples and 1.84 (0.93-3.63) among men <65 years and 1.35 (0.80-2.29) among menz65 years.
Discussion
We prospectively evaluated the association between blood levels oftrans-fatty acids, a reliable biomarker of intake (17), and prostate cancer and found that the levels of elaidic acid (18:1n-9t) and of the three 18:2n-6 trans
isomers examined were associated with an increased risk of developing localized and low-grade prostate tumors. Further, blood trans-fatty acid levels were unrelated to the risk of developing aggressive tumors (i.e., advanced stage or high grade at diagnosis or subsequently lethal disease). These results suggest that some specific trans
fats may be involved in early stages of prostate carcinogenesis but do not contribute importantly to disease progression or that they increase risk only for specific tumor types.
Only three studies have previously examined the association betweentrans fat intake and prostate cancer risk. In the Netherlands Cohort Study, baseline intake of totaltransfats was unrelated to the risk of total, localized, and advanced prostate cancer within 6 years of follow-up (12). These results agree with ours, as in our study, blood
trans-fatty acid levels were unrelated to overall prostate cancer risk during the first 8 years of follow-up and the association we observed with specific 18:2 trans-fatty acids was due to cases occurring later in follow-up. In an Australian retrospective case-control study that included only cases with Gleasonz5, intakes of 16:1, 18:1, and 18:2
trans fats were unrelated to prostate cancer (13). However, intake of margarine, the most important source of trans fats in the Australian diet (21), was associated with a greater risk of prostate cancer (13). The nutrient results of this study are difficult to interpret especially because the food frequency questionnaire used has not been validated. Nevertheless, their results for margarine are consistent with our results fortrans-fatty acids and nonaggressive tumors, as the majority (74%) of cases in the Australian study had a Gleason score of 5 or 6 and, therefore, would have likely been classified as nonaggressive tumors in our study.
Liu et al. (15) examined the association between intakes oftrans fats and prostate cancer risk in a case-control study limited to advanced prostate cancer (defined as Gleasonz7, tumor stagezT2c, or
prostate-specific antigen at diagnosisz10 ng/mL). This study did not observe an association betweentransfat intake in the year before diagnosis and advanced prostate cancer, which is consistent with our results for aggressive disease. However, they reported a positive association limited to men carrying a functional variant of the
RNASEL gene, a gene involved in inflammation and previously linked to prostate cancer risk (15).
Two biomarker studies have examined the association between tissue levels of trans-fatty acids and prostate cancer. Bakker et al. (11) reported a nonsignificant ecological correlation (r = 0.50) between adipose tissue totaltrans-fatty acid levels in eight European countries and age-standardized prostate cancer incidence. In a prospective case-control study nested within the CARET trial, King et al. (14) found positive associations between serum levels of some, but not all, trans-fatty acids and prostate cancer risk. In their study, high serum levels of 18:1n-7tand 18:2n-6c,twere associated with an increased risk of prostate cancer, which was stronger for low-grade (Gleason <7) tumors than for high-grade tumors (14). Our results are in close agreement with those findings.
Increasing evidence suggests that inflammation and insulin resistance may be important in prostate carcino-genesis (22, 23) and both of these factors can be influenced by trans-fatty acid intake. Trans-fatty acids have been associated with increased circulating levels of tumor necrosis factor soluble receptors 1 and 2 in observational studies (3) and increased C-reactive pro-tein, interleukin-6, and other markers of inflammation in controlled feeding studies (2, 4). Intake of trans fats increased insulin resistance in controlled feeding trials (5, 6) and has been associated to increased risk of type 2 diabetes in observational studies (24). Further,trans-fatty acids can decrease the activity of the D5 and D6 desaturases (25, 26), which may also contribute to increased insulin resistance (27).
In addition, specific trans-fatty acids down-regulate peroxisome proliferator-activated receptor-gin vivo(10). This is a particularly important finding given that peroxisome proliferator-activated receptor-g can modu-late both insulin resistance and inflammation (28) and is expressed in prostate tumors where its agonists have generally antiproliferative effects (28-31). Moreover, the association between 18:2 trans fats and prostate cancer was apparently stronger among overweight and obese men, who may already be subject to increased insulin resistance and chronic inflammation (32, 33), and among men who were not assigned to aspirin in the trial in our study and among carriers of the variant genotype of the
RNASELgene in other study (15), supporting the notion thattrans-fatty acids may influence prostate carcinogen-esis through these mechanisms.
Strengths of our study include its prospective design and high follow-up rates, which decrease the possibility that our findings could be the result of a bias. In addition, blood samples were collected before prostate cancer diagnosis, in most cases several years in advance, thus decreasing the possibility that elevated trans-fatty acid levels among the cases were the result of the disease process. In addition, the large number of cases allowed us to examine the associations separately for nonaggres-sive and aggresnonaggres-sive prostate cancer. Limitations of this study include that we only had a baseline measurement Trans-Fatty Acids and Prostate Cancer
of blood trans fat levels. However, this results in misclassification of the long-term fatty acid levels that is nondifferential with respect to case or control status, thereby attenuating the observed associations. In addi-tion, as is true for all observational studies, there is the possibility that some unmeasured factor associated with blood fatty acid levels may be responsible for the observed associations. Nevertheless, we evaluated sev-eral variables as potential confounders and found that adjusting for these variables had minimal effect on the results.
In conclusion, we found that blood levels of trans
isomers of oleic and linoleic acids were related to the risk of developing nonaggressive (localized and low grade) prostate tumors. These results contrast with our previous work showing that blood levels of the cis isomer of linoleic acid are associated with a lower prostate cancer risk (16). As nonaggressive tumors represent a large proportion of prostate cancer detected using prostate-specific antigen screening (34, 35), our findings may have implications for the prevention of prostate cancer on a population level if they are confirmed in future studies. These findings should also further encourage the ongoing efforts by some cities in the United States and by other developed nations to eliminate artificial trans
fats from the food supply as they point to yet another potential health hazard of consuming these fats.
References
1. Mozaffarian D, Katan MB, Ascherio A, Stampfer MJ, Willett WC. Trans fatty acids and cardiovascular disease. N Engl J Med 2006;354: 1601 – 13.
2. Baer DJ, Judd JT, Clevidence BA, Tracy RP. Dietary fatty acids affect plasma markers of inflammation in healthy men fed controlled diets: a randomized crossover study. Am J Clin Nutr 2004;79:969 – 73.
3. Mozaffarian D, Pischon T, Hankinson SE, et al. Dietary intake oftrans
fatty acids and systemic inflammation in women. Am J Clin Nutr 2004;79:606 – 12.
4. Riserus U, Basu S, Jovinge S, et al. Supplementation with conjugated linoleic acid causes isomer-dependent oxidative stress and elevated C-reactive protein: a potential link to fatty acid-induced insulin resistance. Circulation 2002;106:1925 – 9.
5. Lefevre M, Lovejoy JC, Smith SR, et al. Comparison of the acute response to meals enriched withcis- ortrans-fatty acids on glucose and lipids in overweight individuals with differing FABP2 geno-types. Metabolism 2005;54:1652 – 8.
6. Riserus U, Arner P, Brismar K, Vessby B. Treatment with dietary
trans10cis12 conjugated linoleic acid causes isomer-specific insulin resistance in obese men with metabolic syndrome. Diabetes Care 2002;25:1516 – 21.
7. Palapattu GS, Sutcliffe S, Bastian PJ, et al. Prostate carcinogenesis and inflammation: emerging insights. Carcinogenesis 2005;26: 1170 – 81.
8. Barnard R, Aronson W, Tymchuk C, Ngo T. Prostate cancer: another aspect of the insulin-resistance syndrome? Obes Rev 2002;3: 303 – 8.
9. Brown JM, Boysen MS, Jensen SS, et al. Isomer-specific regulation of metabolism and PPARgsignaling by CLA in human preadipocytes. J Lipid Res 2003;44:1287 – 300.
10. Saravanan N, Haseeb A, Ehtesham NZ, Ghafoorunissa. Differential effects of dietary saturated andtrans-fatty acids on expression of genes associated with insulin sensitivity in rat adipose tissue. Eur J Endocrinol 2005;153:159 – 65.
11. Bakker N, van’t Veer P, Zock PL. Adipose fatty acids and cancers of the breast, prostate and colon: and ecological study. Int J Cancer 1997;72:587 – 91.
12. Schuurman AG, van den Brandt PA, Dorant E, Brants HAM, Goldbohm RA. Association of energy and fat intake with prostate carcinoma risk. Cancer 1999;86:1019 – 27.
13. Hodge AM, English DR, McCredie M, et al. Foods, nutrients and prostate cancer. Cancer Causes Control 2004;15:11 – 20.
14. King IB, Kristal AR, Schaffer S, Thornquist M, Goodman GE. Serum
trans-fatty acids are associated with risk of prostate cancer in h-carotene and retinol efficacy trial. Cancer Epidemiol Biomarkers Prev 2005;14:988 – 92.
15. Liu X, Schumacher FR, Plummer SJ, et al.Trans-fatty acid intake and increased risk of advanced prostate cancer: modification by RNASEL R462Q variant. Carcinogenesis 2007;28:1232 – 6.
16. Chavarro JE, Stampfer MJ, Li H, et al. A prospective study of polyunsaturated fatty acid levels in blood and prostate cancer risk. Cancer Epidemiol Biomarkers Prev 2007;16:1364 – 70.
17. Baylin A, Kim MK, Donovan-Palmer A, et al. Fasting whole blood as a biomarker of essential fatty acid intake in epidemiologic studies: comparison with adipose tissue and plasma. Am J Epidemiol 2005; 162:373 – 81.
18. Steering Committee of the Physicians’ Health Study Research Group. Final report on the aspirin component of the ongoing Physicians’ Health Study. N Engl J Med 1989;321:129 – 35.
19. Hennekens CH, Buring JE, Manson JE, et al. Lack of effect of long-term supplementation withhcarotene on the incidence of malignant neoplasms and cardiovascular disease. N Engl J Med 1996;334: 1145 – 9.
20. Catalona WJ, Avioli LV. Diagnosis, staging, and surgical treatment of prostatic carcinoma [clinical conference]. Arch Intern Med 1987;147: 361 – 3.
21. Clifton PM, Keogh JB, Noakes M.Transfatty acids in adipose tissue and the food supply are associated with myocardial infarction. J Nutr 2004;134:874 – 9.
22. Nelson WG, De Marzo AM, DeWeese TL, Isaacs WB. The role of inflammation in the pathogenesis of prostate cancer. J Urol 2004;172: S6 – 12.
23. Hsing AW, Gao Y-T, Chua S, Jr., Deng J, Stanczyk FZ. Insulin resistance and prostate cancer risk. J Natl Cancer Inst 2003;95: 67 – 71.
24. Salmeron J, Hu FB, Manson JE, et al. Dietary fat intake and risk of type 2 diabetes in women. Am J Clin Nutr 2001;73:1019 – 26.
25. Hill EG, Johnson SB, Lawson LD, Mahfouz MM, Holman RT. Perturbation of the metabolism of essential fatty acids by dietary partially hydrogenated vegetable oil. Proc Natl Acad Sci U S A 1982; 79:953 – 7.
26. Larque E, Garcia-Ruiz P-A, Perez-Llamas F, Zamora S, Gil A. Dietary
trans fatty acids alter the compositions of microsomes and mitochondria and the activities of microsomeD6-fatty acid desatur-ase and glucose-6-phosphatdesatur-ase in livers of pregnant rats. J Nutr 2003; 133:2526 – 31.
27. Das UN. A defect in the activity ofD6 andD5 desaturases may be a factor predisposing to the development of insulin resistance syndrome. Prostaglandins Leukot Essent Fatty Acids 2005;72:343 – 50.
28. Lehrke M, Lazar MA. The many faces of PPAR-g. Cell 2005;123:993 – 9.
29. Grommes C, Landreth GE, Heneka MT. Antineoplastic effects of peroxisome proliferator-activated receptorgagonists. Lancet Oncol 2004;5:419 – 29.
30. Subbarayan V, Sabichi AL, Kim J, et al. Differential peroxisome proliferator-activated receptor-g isoform expression and agonist effects in normal and malignant prostate cells. Cancer Epidemiol Biomarkers Prev 2004;13:1710 – 6.
31. Sabichi AL, Subbarayan V, Llansa N, Lippman SM, Menter DG. Peroxisome proliferator-activated receptor-gsuppresses cyclooxyge-nase-2 expression in human prostate cells. Cancer Epidemiol Biomarkers Prev 2004;2004:1704 – 9.
32. Hotamisligil GS. Inflammatory pathways and insulin action. Int J Obes 2003;27:S53 – 5.
33. Gonzalez AS, Guerrero DB, Soto MB, et al. Metabolic syndrome, insulin resistance and the inflammation markers C-reactive protein and ferritin. Eur J Clin Nutr 2006;60:802 – 9.
34. van der Kwast TH, Ciatto S, Martikainen PM, et al. Detection rates of high-grade prostate cancer during subsequent screening visits. Results of the European Randomized Screening Study for Prostate Cancer. Int J Cancer 2006;118:2538 – 42.