Genome-wide DNA methylation
map of human neutrophils reveals
widespread inter-individual
epigenetic variation
Aniruddha Chatterjee1,2, Peter A. Stockwell3, Euan J. Rodger1, Elizabeth J. Duncan2,4, Matthew F. Parry5, Robert J. Weeks1 & Ian M. Morison1,2
The extent of variation in DNA methylation patterns in healthy individuals is not yet well
documented. Identification of inter-individual epigenetic variation is important for understanding
phenotypic variation and disease susceptibility. Using neutrophils from a cohort of healthy individuals, we generated base-resolution DNA methylation maps to document inter-individual
epigenetic variation. We identified 12851 autosomal inter-individual variably methylated fragments
(iVMFs). Gene promoters were the least variable, whereas gene body and upstream regions showed higher variation in DNA methylation. The iVMFs were relatively enriched in repetitive elements compared to non-iVMFs, and were associated with genome regulation and chromatin function elements. Further, variably methylated genes were disproportionately associated with regulation of transcription, responsive function and signal transduction pathways. Transcriptome analysis indicates
that iVMF methylation at differentially expressed exons has a positive correlation and local effect on
the inclusion of that exon in the mRNA transcript.
Methylation of DNA is a mechanism for regulating gene function in all vertebrates. It has a role in gene silencing, tissue differentiation, genomic imprinting, chromosome X inactivation, phenotypic plasticity, and disease susceptibility1,2. Aberrant DNA methylation has been implicated in the pathogenesis of sev-eral human diseases, especially cancer3–5.
Variation in DNA methylation patterns in healthy individuals has been hypothesised to alter human phenotypes including susceptibility to common diseases6 and response to drug treatments7. The impact of epigenetic variation in modulating gene expression and phenotypic traits has been demonstrated in cloned animals8 and model organisms9.
Although the potential effects of DNA methylation variation has been speculated10, firm evidence of variable methylation between healthy human individuals is relatively limited. Recently, variable methyl-ation has been described in different ethnic populmethyl-ation11–14. Previous documentation of inter-individual variation in DNA methylation has been affected by the use of mixed cell types in cord or whole blood 12,15,16 or peripheral blood leukocytes17. Different cell types exhibit distinct DNA methylation patterns18,19 and these differences contribute substantially to inter-individual DNA methylation20. A recent large-scale epigenomic map revealed substantial variation between human tissue types, further suggesting use of
1Department of Pathology, Dunedin School of Medicine, University of Otago, 270 Great King Street, Dunedin
9054, New Zealand. 2Gravida: National Centre for Growth and Development, 2-6 Park Ave, Grafton, Auckland
1142, New Zealand. 3Department of Biochemistry, University of Otago, 710 Cumberland Street, Dunedin 9054,
New Zealand. 4Laboratory for Evolution and Development, Department of Biochemistry, University of Otago,
710 Cumberland Street, Dunedin 9054, New Zealand. 5Department of Mathematics and Statistics, University of
Otago, P.O. Box 56, Dunedin, 9054, New Zealand. Correspondence and requests for materials should be addressed to A.C. (email: aniruddha.chatterjee@otago.ac.nz) or I.M.M. (email: ian.morison@otago.ac.nz)
mixed cell types can confound discovery of inter-individual variation21. Few studies have attempted to investigate DNA methylation variation in an individual cell type22,23.
Here we present single-nucleotide resolution DNA methylation maps from 11 healthy individuals, using Reduced Representation Bisulfite Sequencing (RRBS). We choose neutrophils as these are an acces-sible, abundant and homogeneous cell type. Implementing a novel fragment-based analysis approach24, we identified genomic regions that showed significant inter-individual variation in DNA methylation. We explored methylation variation in different elements of the genome (promoters, gene body and regions far upstream of the gene) and integrated them with gene regulatory features (such as transcription factor binding sites (TFBS), histone marks and enhancers) and repetitive elements to gain a perspective on the potential role of methylation variation in genome regulation. Further, we determined that variable methylation is associated with differential gene expression and exon usage, providing a mechanism by which variable methylation might affect the phenotype of these individuals.
Results
Features of neutrophil methylome. We used enriched neutrophils (median purity = 96%) from the peripheral blood of 11 healthy individuals to generate DNA methylation maps (Supplementary Table S1). A total of 12 neutrophil methylomes, including a technical replicate, were generated using RRBS and 340 million sequenced reads were obtained. Unique alignment efficiency ranged from 55.5% to 72.4% (median = 67%, Supplementary Table S2). The distribution of read coverage of CpG sites sug-gested that PCR-induced amplification bias of the libraries was negligible (Supplementary Fig. S1). The median bisulfite conversion rate was calculated to be > 98%, assuming that all non-CpG methyl-ation was due to inefficient bisulfite conversion. As expected the neutrophils showed a bimodal distri-bution of DNA methylation (Supplementary Fig. S2). The level of DNA methylation was significantly lower in promoters (median = 3.0%) and core CpG islands (CGI) (median = 2.4%) than in gene bodies (median = 17.4%) and regions upstream from genes (median = 87.8%) and CGI shore (median = 88.2%) and shelf (median = 82.3%) (ANOVA test, P-value < 2 × 10⁻¹⁶; Supplementary Fig. S3-S4). Exons showed significantly lower levels of methylation compared to introns (9.9% vs. 83.3% median methylation; Supplementary Fig. S5). To assess the technical reproducibility, we compared methylation of fragments of two replicates by using a Bland-Altman plot, in which the 95% limits of agreement were − 11.7% to 11.5% methylation. The graphical presentation of agreement (Supplementary Fig. S6) demonstrates high reproducibility of RRBS data, in agreement with previous reports25,26.
Identification of inter-individual variably methylated fragments (iVMFs). To investigate inter-individual DNA methylation variation we used MspI fragments (40–220 bp in size, median size of the fragments = 104 bp, average fragment size = 111.5) as the unit of analysis24. To filter fragments that were suitable for analysis, first we selected the fragments having 10 or more reads at ≥ 2 CpG sites in each individual (Supplementary Table S3). Of the predicted in silico 647,626 MspI fragments within an RRBS genome (40–220 bp sized fragments), the number of qualifying fragments per individual ranged from 115,141 to 347,536. From these qualifying fragments 64,934 MspI fragments (containing 432,957 CpG sites) satisfied the inclusion criteria in at least 9 of the 11 sequenced individuals. Henceforth, these are referred to as the “analysed fragments”. A Chi-square distribution test was then performed on the ana-lysed fragments across these individuals to identify fragments with the largest variability (Supplementary Fig. S7).
We identified 14,489 inter-individual variably methylated fragments (iVMFs) that exceeded our sig-nificance threshold (Bonferroni adjusted cut off P-value = 1.54 × 10⁻⁸). These iVMFs comprised 22.3% of the analysed fragments, and 2.2% of the in silico MspI-digested reduced representation (RR) genome (40–220 bp fragments). These iVMFs contained 92,013 CpG sites, which comprised 21.3% of those con-tained within the analysed genome and 2.3% of those concon-tained within the in silico MspI digested RR genome.
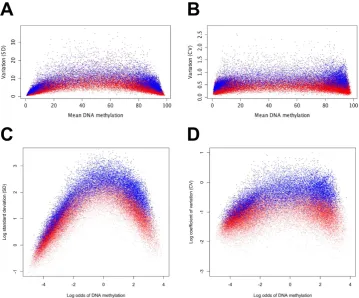
Comparison of Chi-square test with other methods for detecting variable methyla-tion. Although the distribution of methylation data is not well characterised, other groups have meas-ured methylation variability using standard deviation (SD) methods13,16. We compared the Chi-square statistics with SD to assess how these two methods detect variability in our cohort. For this comparison we first plotted the mean DNA methylation against the SD for all the analysed fragments (plotted in red in Fig. 1A), then overlaid the iVMFs (plotted in blue) as detected by the Chi-square test. The expecta-tion was that the iVMFs would show higher SD compared to the total analysed fragments. In fact, the median SD of the iVMFs was 7.68 compared to 3.55 for all fragments analysed (the median SD of the non-variable fragments was 2.99). However, the iVMFs with very high or very low levels of methylation had low SDs. We performed a similar comparison using a coefficient of variation (CV). We calculated a modified CV to account for the DNA methylation scale of 0 to 100% (Fig. 1B). Although the use of CV slightly improved the separation of iVMFs from analysed fragments compared to SD, the iVMFs with high and low methylation still showed relatively low CV, compared to iVMFs with intermediate methylation.
performed a logit transformation (log odds) of methylation. After the transformation, the iVMFs showed much more obvious separation from the non-variable fragments based on (log) SD (Fig. 1C) or (log) modified CV (Fig. 1D).
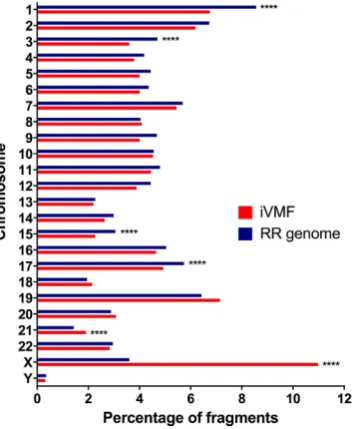
Chromosome-wise distribution of iVMFs. Chromosome-wise distribution of iVMFs and in silico
[image:3.595.156.516.45.343.2]iVMFs were excluded to avoid potential sex-specific effects, resulting in 12,851 autosomal iVMFs for further analysis (Supplementary Table S10).
Genomic distribution of iVMFs. The autosomal iVMFs were mapped to their nearest protein coding gene (Fig. 3A). Overall, 9.8% of the iVMFs were located in promoters (defined as up to 5 kb upstream from the start of the gene). Within the promoter-associated iVMFs, 15% showed direct overlap with the transcription start site (TSS) of known protein-coding genes (Fig. 3B). Interestingly, 50.4% of the iVMFs reside within the gene body (includes exon, introns and exon/intron or intron/exon boundaries). Of the 6481 gene-body-associated iVMFs, 62.9% were found to be in introns and 28.0% in exons. A small pro-portion of the iVMFs were found to be in exon/intron and intron/exon boundaries (Fig. 3C). We found 37.2% of the iVMFs were located more than 10 kb upstream from the nearest gene start site (defined as distant iVMFs).
We sought to determine whether this iVMF distribution in genomic features merely reflects the distribution of analysed fragments or whether different elements in the genome biologically differ in methylation variability. Therefore, we assigned a variability score (VS) to each of these genomic features by dividing the number of iVMFs with the number of analysed fragments for that feature. Promoter, gene body and distant regions had a variability score of 0.16, 0.20 and 0.24 respectively; gene promoters were significantly less variable compared to other genomic regions (P= 0.0001). Moreover, the variability score showed consistent increments with distance from the promoter (Fig. 3E). The lowest variability score of 0.15 was found in the region of 0 - 2 kb upstream of the transcription start site. Within the gene body, there was no significant difference between the variability within the exons, introns, intron/exon boundaries and exon/intron boundaries.
The distribution of iVMFs within CpG features (CGI core, shore (flanking 2 kb either side of the core CGI) and shelf (flanking 2 kb either side of the CGI shore)) was investigated. 65.3% (8392) of the iVMFs were located within one of these CpG features. It was found that 23.0%, 41.0% and 1.3% of the iVMFs were within CGI cores, CGI shores and CGI shelves respectively (Fig. 3D) similar to the distribution of analysed fragments (24.0%, 39.9% and 1.3% respectively) (Supplementary Table S4).
The mean number of CpG sites per fragment were significantly higher in iVMFs (promoter, gene body and distant fragments) compared to the non-variable fragments (P= 0.0001) (Supplementary Table S5), suggesting that although the iVMFs were not enriched for a particular CpG feature, their mean CpG density is higher than the analysed non-variable fragments.
[image:4.595.159.337.46.261.2]this cell line is the most closely related to neutrophils. However, K562 will show many differences in transcription factor expression, histone marks and regulatory elements than those in neutrophils.”
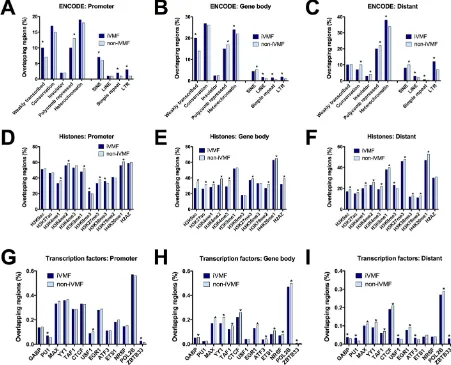
For this comparison, iVMFs with either a significantly higher or lower proportion (P< 0.05) of overlap within a feature compared to non-variable fragments were referred to as either “enriched” or “depleted” respectively (Supplementary Table S11). Promoter and gene body iVMFs were enriched in weakly transcribed regions in the genome. All three categories of iVMFs (distant, promoter and gene body) were depleted in polycomb-repressed regions and were enriched in repetitive elements. Whereas simple repeats and low terminal repeats follow this trend, long interspersed elements (LINE) were only enriched in gene body and distant iVMFs. On the other hand, short interspersed elements (SINE) were enriched in promoter iVMFs but depleted in gene-body and distant iVMFs. Distant iVMFs were depleted in conserved regions and insulator elements (Fig. 4A–C and Supplementary Table S11).
[image:5.595.154.514.47.497.2]following active marks: H3K4me1, H3K4me2, H3K9me1 and H4K20me1(as described by Barski et al.32 and designated as active promoter state by Ernst and Kellis31). In addition to these active marks, pro-moter iVMFs were also depleted for the repressive mark H3K27me3. On the other hand, the propro-moter iVMFs were enriched for the active mark H3K36me3 and the repressive mark H3K9me3. The gene body iVMFs showed depletion for the majority of the histone marks (for eight active and one repressive mark). The distant iVMFs were also depleted for most histone modifications (9 out of 12), except H3K4me1 (active mark) and H3K9me3 (repressive mark), for which they were significantly enriched (Fig. 4D–F, and Supplementary Table S11).
[image:6.595.99.550.48.413.2]One of the mechanisms by which DNA methylation can regulate gene expression is by modulating the binding and interaction of transcription factors (TF) with DNA33. We analysed the overlap of iVMFs with 20 major transcription factor binding sites. The promoter iVMFs did not show significant asso-ciation with most transcription factors except in PU1 sites where iVMFs were enriched and in USF1 sites where they were depleted. All three categories of iVMFs (distant, promoter and gene body) were enriched for transcriptional regulator Kaiso. The gene body iVMFs showed depletion for 10 out of 20 TF binding sites and no association with the remaining 9 TFs. The distant iVMFs also showed signifi-cant enrichment for several transcription factors binding sites (GABP, PU1, BCLAF1, SRF, SIX5, USF1, ATF3, SIN3AK20, MEF2A) (Fig. 4G–I). It is possible that some of these results could be influenced by genotypic variation between the individuals (see discussion for detail).
Identification of variably methylated genes. To generate a list of highly variable methylated genes (VMGs), the 12,851 autosomal iVMFs were associated with 6353 protein coding human genes. Then iVMF frequency was calculated, i.e., assigning the number of iVMFs associated with each gene. We found 1298 genes had three or more associated iVMFs (Supplementary Table S6). A variability score was assigned to each of these genes by dividing the number of associated iVMFs by the number of analysed fragments for that gene. Of these 1298 genes, 441 showed a variability score of ≥ 0.5; i.e., more than half of the analysed fragments were variable (Supplementary Table S12). For this analysis, no limit was imposed on how far upstream an iVMF can lie from these genes.
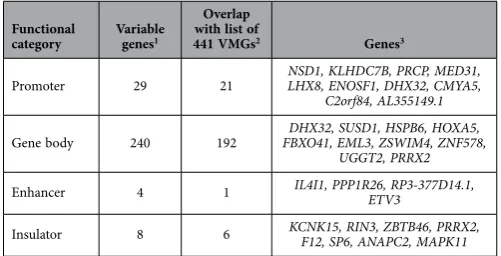
To identify VMGs present within functionally important regions (promoter, gene body, enhancer and insulator), a variability score was assigned to fragments within each functional category (regions containing < 3 iVMFs were not considered). We identified 29, 240, 4 and 8 genes that showed high var-iability (≥ 0.5) in their promoter, gene body, enhancer and insulator elements respectively (Table 1 and Supplementary Table S12; 10 genes were included in more than one category, Supplementary Fig. S8).
Overlap of variable genes with previous genome-wide studies and assessment of tissue specificity in iVMFs. We compared our data with three previously published genome-wide stud-ies in relation to our candidate variable genes. Of the five previously reported human gene-associated metastable epialleles (in peripheral blood leukocytes of rural Gambian children)17, one appeared in our list of top variable genes (ZFYVE28 with 9 iVMFs and variability score = 0.69). The variable nature of
ZFYVE28 was also reported by another independent study34. Another metastable epiallele at PAX8 that was previously validated in human also appeared in our initial list (PAX8 with 7 iVMFs and variability score = 0.41); however, PAX8 was not among our top variable genes as its variability score was < 0.5.
Feinberg et al. reported 212 variably methylated genes in whole blood from their use of compre-hensive array-based relative methylation (CHARM) analysis16. Of these, 121 were within the promoter region (< 5 kb upstream of the gene). Six genes appeared in both lists. This degree of overlap was expected by chance (P= 0.60, hypergeometric test). Harris and colleagues previously reported 1013 pro-moter and gene body associated metastable epiallele genes34. When we compared our promoter and gene body associated VMGs (271 genes) with that of Harris, we found highly significant overlap of 43 genes (P= 1.75 × 10⁻⁷, hypergeometric test). Further, two genes were identified that were common between the three independent studies (our study, Feinberg et al. and Harris et al.; Supplementary Boxes 1–6). The differences in the number of overlapping genes between these studies could be attributed to the mixed cell type used in the previous studies, the platform used for DNA methylation analysis and false discovery rates (FDR).
After performing the Chi-square test, we used a stringent Bonferroni correction to derive a cut-off
P-value for filtering iVMFs. After applying the Bonferroni correction, a large number of fragments remained significant. Use of different multiple correction method could yield different lists of differen-tially methylated regions and therefore could explain some of the differences between our study, Feinberg
et al. and Harris et al. studies (see Supplementary Table S9 and description of statistical test to iden-tify inter-individual variably methylated fragments section in Supplementary Information 1 for detailed explanation on statistical methods for methylation analysis).
To assess potential influence of tissue-specific DNA methylation variation in the identified iVMFs, we compared our iVMF data with previously published CpG sites that were differentially methylated among different blood cell types. We have analysed the overlap of our 12851 iVMFs with 1865 differ-entially methylated CpG sites between different purified blood cell types (CD4+ T cells, CD8+ T cells, NK cells, B cells, monocytes, granulocytes, eosinophils, neutrophils and whole blood) reported from
Functional
category Variable genes1
Overlap with list of
441 VMGs2 Genes3
Promoter 29 21 NSD1, KLHDC7B, PRCP, MED31, LHX8, ENOSF1, DHX32, CMYA5, C2orf84, AL355149.1
Gene body 240 192 FBXO41, EML3, ZSWIM4, ZNF578, DHX32, SUSD1, HSPB6, HOXA5, UGGT2, PRRX2
Enhancer 4 1 IL4I1, PPP1R26, RP3-377D14.1, ETV3
[image:7.595.154.405.46.174.2]Insulator 8 6 KCNK15, RIN3, ZBTB46, PRRX2, F12, SP6, ANAPC2, MAPK11
Table 1. Summary of variably methylated genes.1The genes that showed VS of ≥ 0.5. 2The lists of variably
methylated genes (VMGs) for a particular region was overlapped with the overall list of 441 genes. 3For the
previous genome-wide studies19,35. We found only 13 out of these 1865 CpG sites (0.7%) overlapped with 11iVMFs. These results further demonstrate that the iVMFs detected in this study are not influenced by tissue-specific methylation variation.
DNA methylation and gene expression. We performed RNA-Seq on neutrophil RNA from four individuals in our cohort to explore the association of DNA methylation with gene expression. As expected, DNA methylation of core CGIs was negatively associated with expression of corresponding genes: fragments with 0–30% CGI methylation were associated with higher expression compared to the highly methylated (> 70%) fragments (Fig. 5A, P< 0.05, ANOVA with a Tukey HSD post-hoc test). To investigate the effect of methylation around the TSS on gene expression we used different windows to define promoters. This inverse association between methylation and gene expression was strongest for fragments located 0–500 bp downstream of the start of the gene (P= 3.5 × 10⁻¹⁶, Fig. 5B). This inverse association became weaker with increased distance upstream of the gene start and > 3000 bp upstream of the gene the inverse association was no longer significant (Supplementary Table S7).
At the level of individual exons, highly expressed exons showed higher levels of DNA methylation (Fig. 5C; Supplementary Fig. S9-S10). Two examples were CYBA (r = 0.68 and P= 8.3 × 10⁻⁹) and SIRT6 (r = 0.67 and P= 7.5 × 10⁻⁵) genes (Fig. 5D,E).
Within the four RNA samples, differential expression was identified for 257 genes (false discovery adjusted P ≤ 0.01). Similarly, 1857 genes contained promoter or gene body iVMFs in these four individ-uals (these iVMFs were re-derived using methylation data for the four individindivid-uals as described above for the 11 individuals). When the differentially expressed genes were overlapped with genes that contained iVMFs in their promoter or gene body, 24 genes were in common. Of these 24 genes, three genes con-tained iVMFs in their promoters (MAP7D2, PROK2, GATA2). The other 21 genes contained iVMFs in their body.
Since DNA methylation has been linked with alternative exon usage36 we sought to determine the extent to which variation in methylation is associated with exon usage. Using the DEXseq37 package we identified exons that were differentially expressed. 78 iVMFs (re-derived for these four individuals) directly overlapped differentially expressed exons. The level of methylation at these iVMFs was positively correlated with inclusion of the exon in the mRNA transcript (r = 0.48, P= 2.2 × 10⁻¹⁶) (Fig. 5F). As a control, the correlation of iVMF methylation was much weaker with the expression of the upstream (r = 0.17, P= 0.004, Fig. 5G) or the downstream exon (r = 0.20, P= 0.0008, Fig. 5H). These results sug-gest that methylation level of an iVMF has a local association with the expression of the iVMF-containing exons but not the adjacent exons.
Functional enrichment of variably methylated genes. We investigated whether variably meth-ylated genes are disproportionally involved with particular biological functions. For this analysis, we restricted our list to 271 genes that contained iVMFs only in promoter, gene body, enhancer and insula-tor. The variably methylated genes were significantly enriched for regulation of transcription, gland devel-opment, organ morphogenesis and chromatin remodeling related genes. Interestingly, genes with high level of expression in brain genes were significantly enriched in the list of variable genes (Supplementary Table S8 and Supplementary Table S13).
Discussion
DNA methylation can be interrogated by using different units of analysis (e.g., single CpG sites, fragments, or tiling windows). To investigate DNA methylation variation, we chose MspI fragments as the unit of analysis24, since biological relevance tends to be associated with regional methylation and since the use of fragments integrates the information from multiple CpG sites, thereby minimising sampling variation38. Use of large tiling windows (e.g. 1000 bp) is a common approach; however for RRBS, the majority of genomic windows will not contain sequenced reads or will have partial inclusion of MspI-digested frag-ments. Further, if a region is variably methylated, use of a large window might obscure this variation38.
Variable promoter DNA methylation has been previously reported in normal individuals39. A small proportion of the iVMFs that we identified were in promoters (9.8%) and we showed that the distance from the gene promoter correlated with increased methylation variability, demonstrating that promoters are the least variable regions in the genome. This observation is consistent with the hypothesis that gene promoters are epigenetically conserved, usually having low levels of methylation to prevent mutations and requiring tight regulation for proper functioning of the genome40 and therefore cannot accommo-date large degree of variation. The variably methylated promoters showed higher CpG density than the non-variable promoters. Promoters with low CpG content generally show high methylation and mainly overlap tissue-specific genes, whereas the high CpG promoters generally have low methylation and are associated with broadly expressed genes41,42. This suggests that genes associated with promoter iVMFs are more likely to be expressed in many tissues. The variable promoters were enriched in “weakly tran-scribed regions” consistent with their depletion for highly active histone marks (such as H3K4me1 and H3K4me2).
Figure 5. DNA methylation and gene expression relationship. Methylation of CpG island cores (A) and promoters (B) negatively associated with gene expression (y-axis, plotted as fragment per kb per million reads or FPKM). Bars that do not share a letter are significantly different. For (B), DNA methylation of 0 to + 500 bp region (downstream) from transcriptional start site was plotted against expression (see more details in Supplementary Table S7). (C) Expression of individual exons is positively correlated with DNA methylation on that exon. For significance tests in the above figures, ANOVA with a Tukey HSD post-hoc test was used and P< 0.05 was considered significant). (D–E) Two examples of positive correlation between individual exon methylation and gene expression (log 2 of read counts for the exons were plotted in x-axis): cytochrome b-245 alpha polypeptide (CYBA) (r = 0.68 and P= 8.3 × 10⁻⁹) and sirtuin6 (SIRT6) (r = 0.67
and P = 7.5 × 10⁻⁵) genes. (F) Methylation and expression of 78 exons where iVMFs directly overlapped
in promoter iVMFs but were depleted among gene body and distant iVMFs. Retrotransposons, when close to CpG islands, can act as methylation control centers43,44 and the overlap of transposable ele-ments with specific enhancer marks can regulate tissue-specific functions45. Our analysis shows greater epigenetic variation in repetitive elements compared to other elements of the genome suggesting that repetitive elements perhaps serves as a reservoir to harbor variably methylated loci. Considering more than half of the human genome contains repetitive elements46, variation in even a small proportion of these elements has the potential to contribute to epigenetically-induced phenotypic variation. This find-ing opens up a new avenue for explorfind-ing the functional role of epimutations in repetitive elements in healthy individuals.
This study and previous reports show that global CpG methylation generally follows a bimodal dis-tribution pattern47,48. However, at individual CpG sites or in a contig of CpG sites, the distribution of methylation values are not well characterised. We chose to assess variation in DNA methylation using the Chi-square test as it does not assume any particular distribution. Comparative analysis showed that although significantly variable with Chi-square, a substantial proportion of the iVMFs (where average methylation of the individuals were close to 0 or 100%) had low standard deviations. This is exempli-fied in the top candidate variable region of DHX32-FANK1 gene (variability score = 1.0) that contained 11 iVMFs (Fig. 6A). For iVMF 5, DNA methylation between individuals ranged from 2.46% to 17.7% (mean = 6.34, SD = 4.09), whereas for iVMF 4 it was 26.7% to 68.1% (mean = 50.5, SD = 12.3). For lowly or highly methylated fragments the methylation variation was detected by Chi-square test but not with SD. We showed that transformation of the SD or CV to log odd ratios of methylation improved the vis-ible separation of variably methylated fragments compared to the non-variable ones. Nevertheless, the Chi-square test treats each methylation count as an independent observation, and correlation between the methylation of neighbouring CpG sites will have an effect on the significance estimation.
In some previous studies it has been demonstrated that adjacent CpG sites are likely to show cor-related DNA methylation levels49,50. However, we noticed for several iVMFs, the methylation pattern between the adjacent CpG sites showed notable variation (Fig. 7 shows an example of such an iVMF). Although we cannot draw conclusions about the biological effect of different methylation at adjacent CpG sites, the methylation status of these CpG sites could, for example, regulate binding of transcription factors51 or of the insulator protein CTCF52. Further, this observation is from a relatively homogene-ous cell population of neutrophils and therefore cannot be attributed to mixed cell types53. These data demonstrate the enormous complexity of methylation patterns even between homogenous cells, giving rise to further opportunities for studying cell-to-cell and inter-individual differences.
[image:10.595.156.516.48.194.2]is problematic, but epigenetic variability at transcription binding sites is likely to be a mechanism for variable gene transcription between individuals.
Our analysis suggests that the relationship between DNA methylation and gene expression in neu-trophils is complex. It has been shown that the DNA methylation status of exons can control binding of insulator elements, such as CTCF, and that this can promote inclusion of a particular exon in a transcript36. Here we demonstrate that methylation of exons and introns have different effects on gene expression. A small number of iVMFs overlapped with differentially expressed exons and methylation of these iVMFs were positively correlated with inclusion of the exons in the corresponding transcript. This suggests that variable methylation is associated with exon inclusion, resulting in functional differences in the mRNA transcript and the protein produced. Additional observations will be required to clarify whether methylation promotes inclusion through transcriptional pausing36 or alternatively whether it occurs as a consequence of transcribed open chromatin59.
Functional enrichment analysis of variably methylated genes indicated that they were enriched for functions relating to regulation of transcription and Chromatin remodelling confirming their potential role in genome regulation. Further, gene ontology analysis suggested that the variable genes are likely to be highly expressed in brain tissue. Epigenetic events have been shown to have roles in memory forma-tion, learning, brain development, establishment of neuronal identity and neurological disorders60–63. In the context of the present study, if epigenetic variation rises at a very early stage of life (before lineage commitment), then these changes will propagate in other cell types. In that case, the majority of early origin epigenetic variation detected in neutrophils could also be observed in brain. In fact, highly corre-lated DNA methylation patterns between brain and blood has been reported64,65.
The BLUEPRINT project is in the process of generating epigenomic profiles of at least 100 different blood cell types including neutrophils from healthy and diseased individuals. The analysis modules include whole genome DNA methylation, RNA-Seq, Chip-Seq, Nucleosome detection, DNase-hypersensitive sites and co-occurring transcription factors analysis66. Our data provides genome-wide methylation and RNA-Seq profiles from a cohort of normal individuals of different ethnicity. These data are complemen-tary to the BLUEPRINT initiative and provide an additional resource. Further, the BLUEPRINT data provide an opportunity to integrate the multiple levels of epigenomic data to prioritise candidate iVMFs that might have role in non-communicable human disease and explore the functional consequences of variable methylation in larger cohorts. For instance, if epigenetic variation was detected in the promoter of a gene having role in growth, fat metabolism, diabetes or asthma, it will be possible to examine the association of the methylation with the relevant phenotype in a larger cohort to demonstrate the con-sequences of epipolymorphism. For example, we have identified striking DNA methylation variability in nuclear receptor SET domain containing protein-1 (NSD1) gene promoter (variability score = 1.00, analysed fragment = 5, iVMFs = 5, Fig. 6B) among the individuals. NSD1 has been associated with Sotos syndrome and Weaver syndrome and downregulation of NSD1 protein disrupts the normal activity of genes involved in growth and development67,68. Evidence for epigenetic inactivation of NSD1 in human cancers also exists69. With whole genome data from larger cohort of individuals with good phenotypic description, it will be possible to test whether DNA methylation variation in gene (such as NSD1) are responsible for altering disease susceptibility or phenotypic traits in normal individuals”
[image:11.595.157.399.48.159.2]by SNPs is small. Hellman et al. reported that common SNPs are present in only 10% of the regions that have a difference in DNA methylation between the two alleles in related and unrelated individuals73 and independent analysis provided further support for these data12. Analysis, including multiple ethnic groups, indicated that genotype can explain ~25% of the variable methylation regions14. Importantly, an RRBS study of a three-generation family showed that, among all investigated CpG sites (~1 million with 10 or more sequenced reads), less than 1% of the CpG sites were involved with ASM events26 suggesting that influence of SNPs in CpG site methylation in RRBS genome is small. Further, ASM events were found mainly in intergenic regions and outside CpG islands and showed low levels of evolutionary con-servation26. Further, a recent large-scale analysis indicated although the genotypes of different ethnicity clusters separately and a clear distinction of population can be made by genotype. However, epigenetic profile of the same populations were dispersed and they couldn't be distinguished based on their DNA methylome unlike genotype14. This result suggests that potential for DNA methylation variation in indi-viduals is larger than genotypic variation.
In our RRBS experiment the methylation profile of any fragment was expected to be derived from both alleles (ideally 50% from each allele). Therefore, the methylation profile of fragment is a mean of methylation of both alleles. If there is allele-specific methylation bias, then we will not be able to detect it with our method. Genetic vs. epigenetic variation comparison is not possible when methylation infor-mation of two alleles are mixed. Additionally, alignment of sequenced reads will ignore C to T SNPs in forward strand reads and G to A SNPs in reverse strand reads, because a C to T match in forward strand reads will be treated as an unmethylated. C to T and G to A SNPs consists 30% of all human SNPs26.
MspI cuts the genome at C’CGG sites, so if an individual has a SNP in the recognition site, then the fragment will be missed for that individual. If as a result of a polymorphism, an MspI site has been created, the consequent fragment will not be included in the inter-individual analysis. Nevertheless, evi-dence of similar DNA methylation patterns in genetically related individuals compared to the unrelated ones suggest a genetic component to epigenetic variation in a normal population26. A proportion of iVMFs found in this study could be associated with genetic variation; however distinguishing the genetic and epigenetic variation in identified iVMFs is beyond the scope of the present study and will remain a subject for future research. Further, it will be of broad interest for future research to investigate which regions of the genome genetic variation are more likely to influence variable methylation than others and whether there is sensitive period in development or adulthood that are more vulnerable to accommodate inter-individual DNA methylation variation mediated by genetic variation.
In this study, we selected individuals of diverse genetic origin to maximize the possibility of detecting epigenetic variation. Our results indicate that in a mixed population, epigenetic variation is widespread and is more extensive than previously reported. In conclusion, this work documents epigenetic variation in the human genome and provides a comprehensive resource for future studies aiming to understand the nature and mechanism of phenotypic plasticity due to DNA methylation variation. In addition, these data will be useful to explore complex traits and altered disease susceptibility due to variable DNA meth-ylation pattern in normal individuals.
Methods
Ethics statement. Informed consent was obtained from all subjects. Peripheral blood samples were collected from healthy individuals in accordance with the guidelines and approval obtained from the Dunedin Multi-region Ethics Committee, Dunedin, Otago region, New Zealand (approval number: MEC/09/07/068).
Recruitment of participants. Eleven individuals (5 male and 6 female) were recruited. The individ-uals represented diverse ethnic backgrounds and ranged in age from 26 to 34 years (see Supplementary Table S1). A technical replicate RRBS library was also included in the analysis.
Neutrophils isolation and DNA extraction. 16 mL peripheral blood was collected from the partici-pating subjects and neutrophils were purified using a Ficoll-Paque method (see details in supplementary methods). DNA was extracted from the neutrophil suspension, using QIAamp DNA mini kit (Qiagen, Hilden, Germany) following the manufacturer’s protocol, with the addition of overnight proteinase K treatment at 55 °C.
Preparation of RRBS libraries. RRBS provides base-resolution information for about 4 million CpG sites (13.4% of all CpG sites in the genome)74 and for more than 23,000 CpG islands (84% of those in the genome)75. RRBS libraries were prepared according to our previously published protocols using the TruSeq kit (Illumina)74,76–78. See supplementary methods for details of library preparation.
standardization of the base-calling was performed using Illumina Off-Line Base-calling application where applicable76. Quality assessment of sequenced reads and processing was performed as our previ-ously published pipelines (details in supplementary methods).
Variable methylation analysis. Variable methylation analysis was performed with our in-house Differential Methylation Analysis Package (DMAP)24. DMAP contains two main programs (diffmeth and identgenloc). We used MspI fragments as the unit of analysis for identifying variable methylation. Using the diffmeth program, for each individual the MspI fragments that had at least 2 CpG sites, covered by 10 or more sequenced reads were included (F2 t10 switch in the diffmeth program of DMAP tool). Next, a Chi-square test was performed for each fragment, requiring that at least 9 out of 11 individuals contained enough coverage for that fragment. For the Chi square test the proportion of methylation in a fragment is the total number of methylated CpGs in all sequenced reads divided by the total number of CpGs in the reads. The fragments with a P-value of ≤ 1.54 × 10⁻⁸ (Bonferroni corrected, see statistical analysis section) were identified as inter-individual variably methylated fragments (iVMF). For male and female group comparisons, we analysed 41464 fragments (where all 5 male and all 6 female contained at least 10 or more sequenced reads at 2 or more CpGs in a fragment) and performed ANOVA statistical test using DMAP.
Feature analysis of iVMFs with ENCODE data. Genomic and epigenomic feature analysis of iVMFs was performed using Epiexplorer tool29. The genomic co-ordinates of the promoter, gene body and distant iVMFs were separately uploaded to the Epiexplorer server. For comparison, co-ordinates of the analysed non-variable fragments in promoter, gene body and distant regions (within the size range of 40–220 bp) were similarly uploaded and analysed. The fragments that showed strong overlap (i.e.,
≥ 50% of a fragment overlapped with a feature) were filtered for analysis and statistical calculation of enrichment or depletion of iVMFs in a feature was performed. The comparisons described here were based on regulatory features from K562 cells. However, comparison was also made against aggregated data from all nine cell lines and this is referred to as “any tissue” analysis (Supplementary Fig. S11-S13). Identification of gene and CpG features for iVMFs. The identgeneloc program of the DMAP tool was used to locate iVMFs to their proximal genes and CpG features. Gene annotations and CpG features were obtained from SeqMonk (distributed from Babraham Institute) feature files (which are based on Ensembl annotation). The SeqMonk feature table contains a “biotype”; we used biotype “protein coding”, i.e., we related each iVMF to the nearest protein coding gene. Limits were not imposed on the distance of iVMF from a gene. From the list of iVMFs and analysed fragments, a variability score for features and genes were assigned (number of iVMFs per feature/number of analysed fragments per feature).
Preparation of RNA from neutrophils and RNA-Seq library construction. For the transcrip-tomics experiment, neutrophil RNA from four individuals was obtained using previously published pro-tocol (details in Supplementary methods)79. The median RNA integrity number (RIN) for the 4 samples was 8.05. RNA libraries were constructed using 1 μ g of total RNA with TruSeq stranded mRNA Sample Preparation kit (Illumina) following the manufacturer’s protocol. RNA was sequenced on the Illumina HiSeq 2000 sequencer (Illumina, USA) with a single-ended, 51-bp run producing raw fastq files.
RNA-Seq data analysis. The RNA-seq reads were mapped to the human genome (assembly GRCh37) using TopHat (v2.0.11)80, transcripts were assembled, abundances (Fragments Per Kilo base per Million or FPKM) of transcript were estimated. Logs 2 of the FPKM values were plotted for the 7 neutrophil housekeeping genes79 to confirm the expression stability of these genes and minimal variation in gene expression between individuals (Supplementary Fig. S14). Differential expression was examined with Cufflinks (v2.2.0)81 package using default parameters82. For exon usage analysis, Human gene models were flattened and reads assigned to exon bins and counted using HTSeq (v0.5.4p5)83. Differential exon usage was calculated using DEXseq37 (v1.8.0) package. DEXseq uses exon counts and compares gen-eralized linear model to a null model with chi-square distribution to test for differential exon usage. Statistical analysis for RNA-Seq data was carried out within the R statistical environment. The graphs for methylation-expression analysis were generated using Lattice (v0.20–27) or hexbin (1.26.3).
Gene ontology. Gene ontology (GO) term enrichment and functional annotation analyses were done using the Database for Annotation, Visualization and Integrated Discovery (DAVID, v6.7)84. Our gene sets were tested against the background of all protein-coding human genes.
Fisher’s exact test and P< 0.05 was considered significant. The enrichment score in the gene-ontology analysis was the geometric mean of all the enrichment P-values for each annotation term associated with the gene members in the group. The other statistical tests described in this article (e.g., chromosome wise distribution, calculation of overlap with regulatory feature) were performed using a Chi-square test (based on contingency table) with Yates correction and P< 0.05 was considered significant. Association of gene expression and methylation at genomic elements was performed by ANOVA with a Tukey HSD post-hoc test (P< 0.05). Hypergeometric test was used to determine overlap with previous studies (P< 0.05).
References
1. Moore, L. D., Le, T. & Fan, G. DNA methylation and its basic function. Neuropsychopharmacology38, 23–38, doi: 10.1038/ npp.2012.112 (2013).
2. Chatterjee, A. & Morison, I. M. Monozygotic twins: genes are not the destiny? Bioinformation7, 369–370 (2011).
3. Baylin, S. B. & Jones, P. A. A decade of exploring the cancer epigenome - biological and translational implications. Nature Reviews. Cancer11, 726–734, doi: 10.1038/nrc3130 (2011).
4. Chatterjee, A. Conference Scene: Epigenetic regulation: from mechanism to intervention. Epigenomics4, 487–490, doi: 10.2217/ epi.12.47 (2012).
5. Chatterjee, A. & Eccles, M. R. DNA methylation and epigenomics: new technologies and emerging concepts. Genome Biol16,
103, doi: 10.1186/s13059-015-0674-5 (2015).
6. Portela, A. & Esteller, M. Epigenetic modifications and human disease. Nature Biotechnology28, 1057–1068, doi: 10.1038/ nbt.1685 (2010).
7. Ivanov, M., Kacevska, M. & Ingelman-Sundberg, M. Epigenomics and interindividual differences in drug response. Clin Pharmacol Ther92, 727–736, doi: 10.1038/clpt.2012.152 (2012).
8. Rideout, W. M., 3rd, Eggan, K. & Jaenisch, R. Nuclear cloning and epigenetic reprogramming of the genome. Science293,
1093–1098, doi: 10.1126/science.1063206 (2001).
9. Peaston, A. E. & Whitelaw, E. Epigenetics and phenotypic variation in mammals. Mammalian Genome: Official Journal Of The
International Mammalian Genome Society17, 365–374, doi: 10.1007/s00335-005-0180-2 (2006).
10. Cloud, J. Why genes aren’t destiny. Time175, 48–53 (2010).
11. Heyn, H. et al. DNA methylation contributes to natural human variation. Genome Res23, 1363–1372, doi: 10.1101/gr.154187.112 (2013).
12. Wang, D. et al. Individual variation and longitudinal pattern of genome-wide DNA methylation from birth to the first two years of life. Epigenetics: Official Journal Of The Dna Methylation Society7, 594–605, doi: 10.4161/epi.20117 (2012).
13. Lam, L. L. et al. Factors underlying variable DNA methylation in a human community cohort. Proc Natl Acad Sci USA109 Suppl 2, 17253–17260, doi: 10.1073/pnas.1121249109 (2012).
14. Teh, A. L. et al. The effect of genotype and in utero environment on interindividual variation in neonate DNA methylomes.
Genome Res24, 1064–1074, doi: 10.1101/gr.171439.113 (2014).
15. Ioannides, M. et al. Inter-individual methylation variability in differentially methylated regions between maternal whole blood and first trimester CVS. Molecular Cytogenetics7, 73, doi: 10.1186/s13039-014-0073-8 (2014).
16. Feinberg, A. P. et al. Personalized epigenomic signatures that are stable over time and covary with body mass index. Sci Transl Med2, 49ra67, doi: 2/49/49ra67 10.1126/scitranslmed.3001262 (2010).
17. Waterland, R. A. et al. Season of conception in rural gambia affects DNA methylation at putative human metastable epialleles.
Plos Genetics6, e1001252, doi: 10.1371/journal.pgen.1001252 (2010).
18. Adalsteinsson, B. T. et al. Heterogeneity in white blood cells has potential to confound DNA methylation measurements. Plos One7, e46705, doi: 10.1371/journal.pone.0046705 (2012).
19. Reinius, L. E. et al. Differential DNA methylation in purified human blood cells: implications for cell lineage and studies on disease susceptibility. Plos One7, e41361, doi: 10.1371/journal.pone.0041361 (2012).
20. Jaffe, A. E. & Irizarry, R. A. Accounting for cellular heterogeneity is critical in epigenome-wide association studies. Genome Biol
15, R31, doi: 10.1186/gb-2014-15-2-r31 (2014).
21. Schultz, M. D. et al. Human body epigenome maps reveal noncanonical DNA methylation variation. Nature523, 212–216, doi: 10.1038/nature14465 (2015).
22. Shen, H., Qiu, C., Li, J., Tian, Q. & Deng, H. W. Characterization of the DNA methylome and its interindividual variation in human peripheral blood monocytes. Epigenomics5, 255–269, doi: 10.2217/epi.13.18 (2013).
23. Illingworth, R. S. et al. Inter-individual variability contrasts with regional homogeneity in the human brain DNA methylome.
Nucleic Acids Res43, 732–744, doi: 10.1093/nar/gku1305 (2015).
24. Stockwell, P. A., Chatterjee, A., Rodger, E. J. & Morison, I. M. DMAP: differential methylation analysis package for RRBS and WGBS data. Bioinformatics30, 1814–1822, doi: 10.1093/bioinformatics/btu126 (2014).
25. Wang, L. et al. Systematic assessment of reduced representation bisulfite sequencing to human blood samples: A promising method for large-sample-scale epigenomic studies. Journal Of Biotechnology157, 1–6, doi: 10.1016/j.jbiotec.2011.06.034 (2012). 26. Gertz, J. et al. Analysis of DNA methylation in a three-generation family reveals widespread genetic influence on epigenetic
regulation. Plos Genetics7, e1002228, doi: 10.1371/journal.pgen.1002228 (2011).
27. Hellman, A. & Chess, A. Gene body-specific methylation on the active X chromosome. Science315, 1141–1143, doi: 10.1126/ science.1136352 (2007).
28. Dunham, I. et al. An integrated encyclopedia of DNA elements in the human genome. Nature 489, 57–74, doi: 10.1038/ nature11247 (2012).
29. Halachev, K., Bast, H., Albrecht, F., Lengauer, T. & Bock, C. EpiExplorer: live exploration and global analysis of large epigenomic datasets. Genome Biology13, R96, doi: 10.1186/gb-2012-13-10-r96 (2012).
30. Lozzio, B. B., Lozzio, C. B., Bamberger, E. G. & Feliu, A. S. A multipotential leukemia cell line (K-562) of human origin.
Proceedings of the Society for Experimental Biology and Medicine. Society for Experimental Biology and Medicine166, 546-550
(1981).
31. Ernst, J. & Kellis, M. Discovery and characterization of chromatin states for systematic annotation of the human genome. Nat Biotechnol28, 817–825, doi: 10.1038/nbt.1662 (2010).
32. Barski, A. et al. High-resolution profiling of histone methylations in the human genome. Cell129, 823–837, doi: 10.1016/j. cell.2007.05.009 (2007).
34. Harris, R. A., Nagy-Szakal, D. & Kellermayer, R. Human metastable epiallele candidates link to common disorders. Epigenetics: Official Journal Of The Dna Methylation Society8, 157–63, doi: 10.4161/epi.23438 (2013).
35. Hindorff, L. A. et al. Potential etiologic and functional implications of genome-wide association loci for human diseases and traits. Proc Natl Acad Sci USA106, 9362–9367, doi: 10.1073/pnas.0903103106 (2009).
36. Shukla, S. et al. CTCF-promoted RNA polymerase II pausing links DNA methylation to splicing. Nature479, 74–79, doi: 10.1038/nature10442 (2011).
37. Anders, S., Reyes, A. & Huber, W. Detecting differential usage of exons from RNA-seq data. Genome Research22, 2008–2017, doi: 10.1101/gr.133744.111 (2012).
38. Ehrlich, M. & Lacey, M. DNA methylation and differentiation: silencing, upregulation and modulation of gene expression.
Epigenomics5, 553–568, doi: 10.2217/epi.13.43 (2013).
39. Gemma, C. et al. Inactive or moderately active human promoters are enriched for inter-individual epialleles. Genome Biol14,
R43, doi: 10.1186/gb-2013-14-5-r43 (2013).
40. Bird, A. DNA methylation patterns and epigenetic memory. Genes Dev16, 6–21, doi: 10.1101/gad.947102 (2002).
41. Elango, N. & Yi, S. V. DNA methylation and structural and functional bimodality of vertebrate promoters. Molecular Biology And
Evolution25, 1602–1608, doi: 10.1093/molbev/msn110 (2008).
42. Saxonov, S., Berg, P. & Brutlag, D. L. A genome-wide analysis of CpG dinucleotides in the human genome distinguishes two distinct classes of promoters. Proc Natl Acad Sci USA103, 1412–1417, doi: 0510310103 10.1073/pnas.0510310103 (2006). 43. Xie, H. et al. Epigenomic analysis of Alu repeats in human ependymomas. Proc Natl Acad Sci USA107, 6952–6957, doi:
0913836107 10.1073/pnas.0913836107 (2010).
44. Estecio, M. R. et al. SINE retrotransposons cause epigenetic reprogramming of adjacent gene promoters. Molecular Cancer
Research: Mcr10, 1332–1342, doi: 10.1158/1541-7786.MCR-12-0351 (2012).
45. Xie, M. et al. DNA hypomethylation within specific transposable element families associates with tissue-specific enhancer landscape. Nat Genet45, 836–841, doi: 10.1038/ng.2649 (2013).
46. Barton, N. H. et al.Evolution. (Cold Spring Harbor Laboratory Press, 2007).
47. Bock, C. et al. DNA methylation dynamics during in vivo differentiation of blood and skin stem cells. Molecular Cell47, 633–647, doi: 10.1016/j.molcel.2012.06.019 (2012).
48. Hartung, T. et al. Diametrically opposite methylome-transcriptome relationships in high- and low-CpG promoter genes in postmitotic neural rat tissue. Epigenetics7, 421–428, doi: 10.4161/epi.19565 (2012).
49. Bock, C. et al. Quantitative comparison of genome-wide DNA methylation mapping technologies. Nature Biotechnology28,
1106–1114, doi: 10.1038/nbt.1681 (2010).
50. Harris, R. A. et al. Comparison of sequencing-based methods to profile DNA methylation and identification of monoallelic epigenetic modifications. Nature Biotechnology28, 1097–1105, doi: 10.1038/nbt.1682 (2010).
51. Zhu, W. G. et al. Methylation of adjacent CpG sites affects Sp1/Sp3 binding and activity in the p21(Cip1) promoter. Molecular And Cellular Biology23, 4056–4065 (2003).
52. Wang, H. et al. Widespread plasticity in CTCF occupancy linked to DNA methylation. Genome Research22, 1680–1688, doi: 10.1101/gr.136101.111 (2012).
53. Beyrau, M., Bodkin, J. V. & Nourshargh, S. Neutrophil heterogeneity in health and disease: a revitalized avenue in inflammation and immunity. Open Biology2, 120134, doi: 10.1098/rsob.120134 (2012).
54. Chen, P. Y., Feng, S., Joo, J. W., Jacobsen, S. E. & Pellegrini, M. A comparative analysis of DNA methylation across human embryonic stem cell lines. Genome Biology12, R62, doi: 10.1186/gb-2011-12-7-r62 (2011).
55. Fernandez-Nestosa, M. J. et al. DNA methylation-mediated silencing of PU.1 in leukemia cells resistant to cell differentiation.
SpringerPlus2, 392, doi: 10.1186/2193-1801-2-392 (2013).
56. de la Rica, L. et al. PU.1 target genes undergo Tet2-coupled demethylation and DNMT3b-mediated methylation in monocyte-to-osteoclast differentiation. Genome Biol14, R99, doi: 10.1186/gb-2013-14-9-r99 (2013).
57. Blattler, A. et al. ZBTB33 binds unmethylated regions of the genome associated with actively expressed genes. Epigenetics
Chromatin6, 13, doi: 10.1186/1756-8935-6-13 (2013).
58. Buck-Koehntop, B. A. et al. Molecular basis for recognition of methylated and specific DNA sequences by the zinc finger protein Kaiso. Proc Natl Acad Sci USA109, 15229–15234, doi: 10.1073/pnas.1213726109 (2012).
59. Jjingo, D., Conley, A. B., Yi, S. V., Lunyak, V. V. & Jordan, I. K. On the presence and role of human gene-body DNA methylation.
Oncotarget3, 462–474 (2012).
60. Ma, D. K. et al. Epigenetic choreographers of neurogenesis in the adult mammalian brain. Nature Neuroscience13, 1338–1344, doi: 10.1038/nn.2672 (2010).
61. Iwamoto, K. et al. Neurons show distinctive DNA methylation profile and higher interindividual variations compared with non-neurons. Genome Research21, 688–696, doi: 10.1101/gr.112755.110 (2011).
62. Migliore, L. & Coppede, F. Genetics, environmental factors and the emerging role of epigenetics in neurodegenerative diseases.
Mutation Research667, 82–97, doi: 10.1016/j.mrfmmm.2008.10.011 (2009).
63. Guo, Y. et al. CTCF/cohesin-mediated DNA looping is required for protocadherin alpha promoter choice. Proc. Natl. Acad. Sci.
U.S.A.109, 21081–21086, doi: 10.1073/pnas.1219280110 (2012).
64. Liu, J. et al. Methylation Patterns in Whole Blood Correlate With Symptoms in Schizophrenia Patients. Schizophr Bull, doi: 10.1093/schbul/sbt080 (2013).
65. Auta, J. et al. DNA-methylation gene network dysregulation in peripheral blood lymphocytes of schizophrenia patients. Schizophr Res150, 312–318, doi: 10.1016/j.schres.2013.07.030 (2013).
66. Adams, D. et al. BLUEPRINT to decode the epigenetic signature written in blood. Nat Biotechnol30, 224–226, doi: 10.1038/ nbt.2153 (2012).
67. Rio, M. et al. Spectrum of NSD1 mutations in Sotos and Weaver syndromes. J Med Genet40, 436–440 (2003).
68. Baker, L. A., Allis, C. D. & Wang, G. G. PHD fingers in human diseases: disorders arising from misinterpreting epigenetic marks.
Mutat Res647, 3–12, doi: 10.1016/j.mrfmmm.2008.07.004 (2008).
69. Berdasco, M. et al. Epigenetic inactivation of the Sotos overgrowth syndrome gene histone methyltransferase NSD1 in human neuroblastoma and glioma. Proc Natl Acad Sci USA106, 21830–21835, doi: 10.1073/pnas.0906831106 (2009).
70. Kerkel, K. et al. Genomic surveys by methylation-sensitive SNP analysis identify sequence-dependent allele-specific DNA methylation. Nat Genet40, 904–908, doi: ng.174 10.1038/ng.174 (2008).
71. Shoemaker, R., Deng, J., Wang, W. & Zhang, K. Allele-specific methylation is prevalent and is contributed by CpG-SNPs in the human genome. Genome Res, doi: gr.104695.109 10.1101/gr.104695.109 (2010).
72. Schalkwyk, L. C. et al. Allelic skewing of DNA methylation is widespread across the genome. Am J Hum Genet86, 196–212, doi: S0002-9297(10)00017-0 10.1016/j.ajhg.2010.01.014 (2010).
73. Hellman, A. & Chess, A. Extensive sequence-influenced DNA methylation polymorphism in the human genome. Epigenetics
Chromatin3, 11, doi: 1756-8935-3-11 10.1186/1756-8935-3-11 (2010).
75. Smith, Z. D., Gu, H., Bock, C., Gnirke, A. & Meissner, A. High-throughput bisulfite sequencing in mammalian genomes. Methods
48, 226–232, doi: S1046-2023(09)00111-X 10.1016/j.ymeth.2009.05.003 (2009).
76. Chatterjee, A., Rodger, E. J., Stockwell, P. A., Weeks, R. J. & Morison, I. M. Technical considerations for reduced representation bisulfite sequencing with multiplexed libraries. Journal Of Biomedicine & Biotechnology2012, 741542, doi: 10.1155/2012/741542 (2012).
77. Chatterjee, A. et al. Mapping the zebrafish brain methylome using reduced representation bisulfite sequencing. Epigenetics8,
979–989, doi: 10.4161/epi.25797 (2013).
78. Chatterjee, A., Stockwell, P. A., Horsfield, J. A., Morison, I. M., Nakagawa, S. & Base-resolution DNA methylation landscape of zebrafish brain and liver. Genomics Data2, 342–344, doi: 10.1016/j.gdata.2014.10.008 (2014).
79. Zhang, X., Ding, L. & Sandford, A. J. Selection of reference genes for gene expression studies in human neutrophils by real-time PCR. BMC Mol Biol6, 4, doi: 10.1186/1471-2199-6-4 (2005).
80. Trapnell, C., Pachter, L. & Salzberg, S. L. TopHat: discovering splice junctions with RNA-Seq. Bioinformatics25, 1105–1111, doi: 10.1093/bioinformatics/btp120 (2009).
81. Trapnell, C. et al. Differential analysis of gene regulation at transcript resolution with RNA-seq. Nature biotechnology31, 46–53, doi: 10.1038/nbt.2450 (2013).
82. Trapnell, C. et al. Differential gene and transcript expression analysis of RNA-seq experiments with TopHat and Cufflinks. Nature protocols7, 562–578, doi: 10.1038/nprot.2012.016 (2012).
83. Anders, S. HTSeq: Analysing high-throughput sequencing data with Python, (2011). http://www-huber.embl.de/users/anders/ HTSeq/%3E. Date of access: 25/02/2015
84. Huang da, W., Sherman, B. T. & Lempicki, R. A. Systematic and integrative analysis of large gene lists using DAVID bioinformatics resources. Nature Protocols4, 44–57, doi: 10.1038/nprot.2008.211 (2009).
Acknowledgements
We gratefully acknowledge the help and support from Dr Sinnakaruppan Mathavan and Dr Li Zhen from Genome Institute of Singapore (GIS) for their help in RNA-Seq experiments. We acknowledge the help received from New Zealand Genomic Limited facility (NZGL), Dunedin, New Zealand during the sequencing of RRBS samples. This work was supported by Gravida: National Centre for Growth and Development (formerly NRCGD) and Dunedin School of Medicine (DSM), New Zealand. We gratefully acknowledge the help of Dr Mik Black for his help with statistical design. AC is supported by the New Zealand Institute for Cancer Research Trust.
Author Contributions
A.C. participated in the design of the study and carried out the RRBS library preparation, data analysis and wrote the first draft of the manuscript. P.A.S. developed the computational pipeline for data analysis and performed alignments and helped in data analysis. E.J.R. contributed with RRBS library preparation, data analysis and preparation of figures for the manuscript. M.P. participated in statistical analysis of variable methylation and preparation of figures for the manuscript. R.J.W. participated in the design of study and setting up the RRBS protocol. E.J.D. participated in RNA-Seq data analysis and preparation of figures for the manuscript. I.M.M. participated in the conceptual design, data analysis and supervision the study. All authors read, contributed and approved the final manuscript.
Additional Information
Accession codes: The DNA methylation data generated for this study have been submitted to the NCBI Gene Expression Omnibus under accession number GSE59163. The RNA-Seq data generated for this study have been submitted under accession number GSE59528.
Supplementary information accompanies this paper at http://www.nature.com/srep
Competing financial interests: The authors declare no competing financial interests.
How to cite this article: Chatterjee, A. et al. Genome-wide DNA methylation map of human neutrophils reveals widespread inter-individual epigenetic variation. Sci. Rep.5, 17328; doi: 10.1038/ srep17328 (2015).