White Rose Research Online URL for this paper:
http://eprints.whiterose.ac.uk/91514/
Version: Accepted Version
Proceedings Paper:
Rooney, C and Ruddle, RA (2015) HiReD: a high-resolution multi-window visualisation
environment for cluster-driven displays. In: EICS '15 Proceedings of the 7th ACM SIGCHI
Symposium on Engineering Interactive Computing Systems. 7th ACM SIGCHI Symposium
on Engineering Interactive Computing Systems, 23-26 Jul 2015, Duisburg, Germany.
Association for Computing Machinery , 2 - 11. ISBN 978-1-4503-3646-8
https://doi.org/10.1145/2774225.2774850
Reuse
Unless indicated otherwise, fulltext items are protected by copyright with all rights reserved. The copyright exception in section 29 of the Copyright, Designs and Patents Act 1988 allows the making of a single copy solely for the purpose of non-commercial research or private study within the limits of fair dealing. The publisher or other rights-holder may allow further reproduction and re-use of this version - refer to the White Rose Research Online record for this item. Where records identify the publisher as the copyright holder, users can verify any specific terms of use on the publisher’s website.
Takedown
If you consider content in White Rose Research Online to be in breach of UK law, please notify us by
HiReD: A High-Resolution Multi-Window Visualisation
Environment for Cluster-Driven Displays
Chris Rooney
Middlesex University
London, UK
[email protected]
Roy A. Ruddle
University of Leeds
[image:2.595.57.548.222.446.2]Leeds, UK
[email protected]
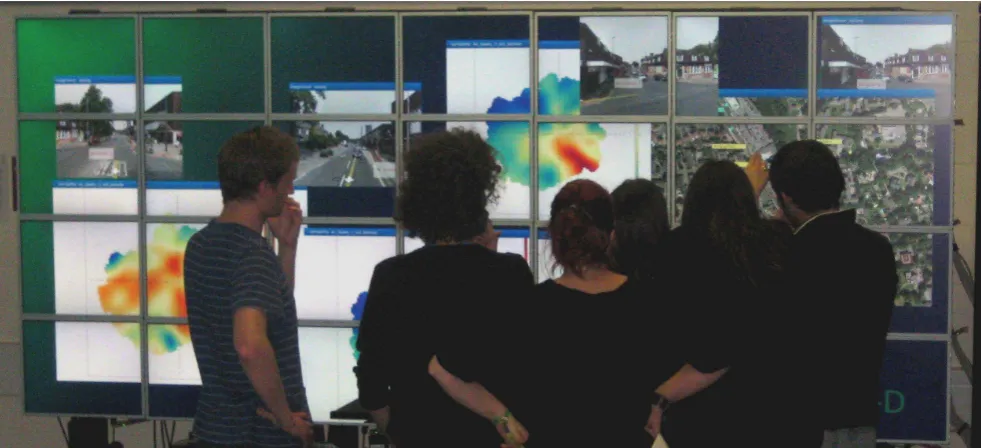
Figure 1: Students analysing air quality data through the HiReD system as part of a coursework for the MSc module: Low Carbon Technologies.
ABSTRACT
High-resolution, wall-size displays often rely on bespoke software for performing interactive data visualisation, lead-ing to interface designs with little or no consistency between displays. This makes adoption for novice users difficult when migrating from desktop environments. However, desktop in-terface techniques (such as task- and menu- bars) do not scale well and so cannot be relied on to drive the design of large display interfaces. In this paper we present HiReD, a multi-window environment for cluster-driven displays. As well as describing the technical details of the system, we also de-scribe a suite of low-precision interface techniques that aim to provide a familiar desktop environment to the user while
Permission to make digital or hard copies of all or part of this work for personal or classroom use is granted without fee provided that copies are not made or distributed for profit or commercial advantage and that copies bear this notice and the full cita-tion on the first page. Copyrights for components of this work owned by others than ACM must be honored. Abstracting with credit is permitted. To copy otherwise, or re-publish, to post on servers or to redistribute to lists, requires prior specific permission and/or a fee. Request permissions from [email protected].
EICS’15, June 23 - 26, 2015, Duisburg, Germany c
2015 ACM. ISBN 978-1-4503-3646-8/15/06...$15.00 DOI: http://dx.doi.org/10.1145/2774225.2774850
overcoming the scalability issues of high-resolution displays. We hope that these techniques, as well as the implementa-tion of HiReD itself, can encourage good practice in the de-sign and development of future interfaces for high-resolution, wall-size displays.
Author Keywords
Powerwall; multi-window environment; user interface; high-resolution; low-precision
ACM Classification Keywords
H.5.2. User Interfaces: Windowing systems
INTRODUCTION
High-resolution, wall-size (or Powerwall) displays (see Fig-ure 1) are becoming increasingly popular due to the vast amount of information they can display. Research has shown that Powerwalls increase productivity [11], and support data analysis [1]. Example usage includes the visualisation of ge-ographic data [17], medical data [13, 28] and software [2].
drive such displays. In 2006, a 50-60 mega-pixel Powerwall display required a cluster of seven machines to drive it, in 2012 the same display could be driven by a single machine with three graphics cards, and in 2015 it could be driven by a single graphics card alone. Rather than seeing a decrease in the use of PC clusters as a result of this, we are instead see-ing cluster-driven Powerwall displays with even higher reso-lutions. At the time of writing, the highest resolution display in the world is the Reality Deck1, running at 1.5 billion pixels,
powered by a cluster of 18 machines.
The drawback with cluster-based displays is the requirement of bespoke software to display data visualisations across the whole cluster. Often, these are individual applications with a single purpose [13, 28], and have limited application to other domains. To provide a consistent and reusable interface, we present the High-Resolution Desktop (HiReD), an extendable multi-window environment designed for performing interac-tive visual data analysis. HiReD simplifies the ability to cre-ate high-resolution data visualisations and makes use of low-precision techniques to provide fast and fluid interaction.
Preceded by related work, this paper then provides a descrip-tion of how we created a window manager to run smoothly and with a high-frame-rate on a cluster-driven display, includ-ing a review of the middleware technologies available and our choice of VRJuggler. This is followed by a description of a suite of low-precision techniques for interacting with multi-window environments on Powerwall displays. Unlike cur-rent desktop environments, which do not scale well, our tech-niques are designed work across large display real estates. Next, we describe a case study of how HiReD was used dur-ing two data analysis sessions we ran with a domain expert and a group of MSc students. Finally, we conclude with a summary of contribution and future work.
RELATED WORK
This section provides an overview of Powerwall displays, in-cluding their hardware construction, the middleware frame-works for running graphics software over a cluster of dis-plays, and their application use. For a more detailed summary of Powerwall displays, see Ni et al. (2006) [22].
Hardware Construction
Currently, Powerwall displays need to be constructed of a matrix of other displays, which may be either TFT monitors or projectors. It is important to differentiate between Pow-erwalls and displays that are simply large, for example, the single projector display used in many lecture theatres. These single-projector displays rarely have a resolution higher than 1024x768 pixels, and so present the same amount of infor-mation (if not less) as on a standard desktop display. With Powerwall displays, users can view the display from a dis-tance and see an overview of the data (context), but can also move to within arm’s length and see data in great detail (fo-cus). This technique of moving around the display is known asphysical navigation[3], and can help users to better under-stand their data.
1http://labs.cs.sunysb.edu/labs/vislab/reality-deck-home/
The following describes a subset of Powerwall displays to demonstrate different types of construction. The first Pow-erwall display was installed at the University of Minnesota2
in 1994. It was made of four rear-projection displays, pro-viding a resolution of 7.8 million pixels (3200x2400 pixels). Projected Powerwalls provide a seamless display between the joins, but are expensive. More recently, the University of Toronto [6] installed a rear-projected Powerwall with reso-lutions of 22 million pixels. The University of Konstanz has a rear projection Powerwall with only 8.9 million pixels, but it has the advantage of providing a stereo view3.
Using TFT monitors allows the wall to be much thinner and cheaper than projected Powerwalls, however, the monitor bezels make the view discontinuous. The largest Powerwall display, at the time of writing, is the Reality Deck display at Stony Brook, composed of 18x30-inch TFT displays offering a total resolution of 1.5 billion pixels. The Stallion display at the University of Texas4is also constructed using 30-inch
dis-plays, with a resolution of 307 million pixels. NASA5 have
a Powerwall constructed of 128 20-inch panels, with a total resolution of 245 million pixels.
The CUBE display at the Queensland University of Technol-ogy employs a hybrid approach of both TFT and projected displays6. When physically navigating, users can move close
to view detail through the eye-level screens, then step back to view the context on the large projected displays seated above them.
All of the displays described above are driven by a cluster of computers. Typically, each computer drives four displays from two graphics cards, although some Powerwalls run up to six displays off a single card. The majority of the walls mentioned above run the Linux operating system, with some also running Microsoft Windows or Apple’s OSX.
Middleware
Powerwalls require middleware to distribute/synchronise the graphics rendering across multiple computers. This section summarises common middleware options, including VRJug-gler, which was used in the development of HiReD.
The Linux tool XDMX makes it possible for the X windows system and GNOME desktop manager to run across multiple computers. When tested internally, however, the low frame rate made applications slow and difficult to use [15]. XDMX was not designed for running at the resolutions offered by Powerwall displays.
Chromium [16] is used as Powerwall middleware by universi-ties such as Toronto, Virginia and Texas, although it was orig-inally designed for parallel graphics processing and works by intercepting OpenGL calls. The aim was to allow large
2http://web.archive.org/web/20110810025801/http://www.lcse.
umn.edu/research/powerwall/powerwall.html
3
http://www.vis.uni-konstanz.de/en/powerwall/
4https://www.tacc.utexas.edu/vislab/stallion 5
http://www.nas.nasa.gov/hecc/resources/viz systems.html
or complex geometries to be rendered on multiple comput-ers, then combined again to produce a single visualisation. Chromium has since been used to send portions of geometry to clustered computers in a Powerwall, and for each com-puter to display the geometry that was sent. The advantage of Chromium is that OpenGL applications do not require mod-ification to run on a Powerwall display. The disadvantage, however, is that it operates by sending the geometry data over a network to each computer in the cluster, so anima-tions or fast user interacanima-tions can create a bottleneck. Also, the amount of data that needs to be sent over the network in-creases linearly with the number of computers, which is prob-lematic when rendering complex scenes on large Powerwalls.
A contrasting technology to Chromium is VRJuggler7 [7],
which was designed as a framework for implementing virtual reality environments for use with head-mounted displays or CAVEs, but was subsequently applied to Powerwalls. Rather than send geometry across the network, the VRJuggler ap-plication runs on each of the computers in the cluster, with each computer rendering a different view. During each frame, data are synchronised between all computers to ensure all in-stances of the application behave in the same way (e.g., time and date variables, random numbers and user input), giving the impression to the user that a single instance of the ap-plication is running. Although existing OpenGL apap-plications must be modified to work inside the VRJuggler framework, when compared with Chromium, both performance and scal-ability are superior.
Two middleware technologies designed specifically for use with large, clustered displays are the Scalable Adaptive Graphics Environment (SAGE) [18] and the Cross-Platform Cluster Graphics Library (CGLX)8. SAGE was created at the
University of Illinois, and uses streaming to display multiple applications on a Powerwall. All visualisations are rendered off-screen, with the final output being sent to the display. This allows many different types of applications to be displayed, and allows them to be rendered from multiple sources. The limitation of SAGE, like Chromium, is the quantity of infor-mation that must be sent across the network. Decreased per-formance can be expected when attempting to stream very high resolution applications. For this reason, the Univer-sity of Texas only use SAGE for rendering video and mid-resolution imagery.
CGLX, developed at the California Institute for Telecommu-nications and Information Technology, combines the advan-tages of Chromium and VRJuggler. Performance is max-imised by running the application on each of the computers in the cluster. The OpenGL calls on each computer are then in-tercepted and rendered locally. This allows standard OpenGL applications to run unmodified on the wall, while maintain-ing good performance. CGLX is also used at the University of Melbourne, and the University of Texas use CGLX for ren-dering static 3D Geometry. CGLX may have been a suitable platform for HiReD, but it not was available when HiReD
7
https://code.google.com/p/vrjuggler/
8http://vis.ucsd.edu/ ∼cglx/
was first conceived, lacks long-term support, and is not open-source (it is only free of charge for non-commercial use).
Applications
Powerwall displays have been applied to many different ap-plication areas, including desktop apap-plications, group work, and scientific, medical and geographical visualisations. Pow-erwall displays can enrich interaction with day-to-day desk-top applications by enhancing users’ awareness of peripheral applications [6]. Powerwalls also support multi-window tasks such as document analysis [1], where analysts can create spa-tial environments similar in appearance to the arrangement of paper documents on a desk.
The Oak Ridge national laboratory have used a Powerwall display to visualise a range of datasets from atoms to explod-ing supernovae9. The University of Texas’ Stallion display
has also been used to visualise scientific datasets such as elec-tron tomography and geophysical modelling. Computational fluid dynamics and weather and climate modelling have been visualised on NASA’s Hyperspace-2 wall.
In the field of medical visualisation, the Powerwall display at the University of Leeds has been used to render 3D cardio-vascular data [13] and for the visualisation of high-resolution, digitally scanned histology slides [28]. For both applications, the high pixel count increases the volume of data that is ren-dered at any one time, and the context offered by the size of the display provides a spatial reference which aids navigation through the visualisation. This is supported by Tan et al. [27], who found that users performed 26% better with spatial ori-entation tasks on a large display when compared to a desktop display.
In a similar manner to histology slides, geographical maps offer a top-down view of a physical area, and also require navigation. Visualising maps on large displays increases per-formance for searching and route-tracing tasks [4]. This in-crease in performance potentially applies to other geograph-ical datasets such as those used for satellite imagery, re-mote sensing and seismic interpretation, which have been dis-played on the Geowall 2 at the Electronic Visualisation Lab-oratory10.
Booker et al. developed a system for visualising geographical and spatial intelligence data on a Powerwall display [8], while Liang et al. have developed a distributed system that allows dynamic visualisation of large, high-resolution GIS datasets [19]. The system has been used to visualise aerial photogra-phy, land use, soil type, and 3D terrain models. The US Air Force Research Laboratory have also used a large display to view terrain models, overlaying them with computer imagery, digital maps, textual information and live video [17]. A high-resolution display is desired by the Air Force because of the amount of information that needs to be analysed at any one time, both from a distance and at close range.
The range of applications found on Powerwall displays was a motivating factor in the development of HiReD, creating a
9
http://www.ornl.gov/info/ornlreview/v37 2 04/article14.shtml
platform for displaying a suite of data visualisations, which could be easily extended depending on the domain of the an-alyst.
REQUIREMENTS
Our key requirement for HiReD was fluidity, both in terms of how the system responds to user interaction, but also in terms of allowing users to fluidly move from desktop interac-tion to Powerwall interacinterac-tion with minimal cost to learning. To address the latter, we wanted to take advantage of novel interaction designs to increase interaction speed. Powerwall applications are designed such that a given item of data occu-pies the same number of pixels on the wall as on a standard desktop display, so the quantity of information that is visible scales with the number of pixels on the wall. This additional real estate increases both the number of application windows that can be viewed at any one time, and the physical distance between them. If the interface completely mimics that of the desktop then, as Fitts’ law [12] predicts, the increased display area substantially slows down interaction.
To overcome the scaling issue, HiReD is designed as a low-precision environment. This is to say that interactive widgets have large target areas for the cursor to hit. The simple solu-tion would be to increase the size of all the widgets, however, that would allocate a large amount of display real estate to these widgets, thus reducing the amount of space allocated to data visualisation (and defeating the object of a Powerwall display). HiReD takes the approach that any real estate re-served for interacting with widgets is taken away from dis-playing visualisations. The aim instead is to use techniques such as overlays and menus-on-demand to incorporate low-precision targets without wasting display real estate.
As a result of the low-precision approach, there are no static widgets or task bars on the HiReD workspace (so the cursor is not forced to travel large distances), and interactive widgets and buttons are kept larger than twenty pixels. Techniques to make windows easier to manage and distant targets easier to reach are also incorporated [26], and are described in the section on interaction later in the paper.
HIRED: HIGH-RESOLUTION DESKTOP
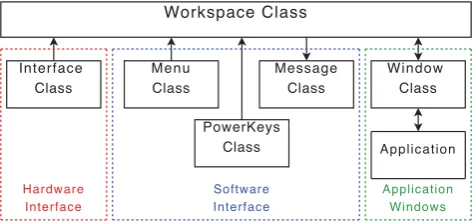
HiReD was developed in C++ and uses OpenGL for render-ing the visual output. The system was implemented usrender-ing a hierarchical, object-oriented design. Figure 2 shows the lay-out of the software classes of the system architecture, which are described in more detail in the following sections.
VRJuggler
VRJuggler was chosen as the middleware for HiReD due to its configurability, high frame rate, and low network band-width. VRJuggler also provides flexibility for using different input devices (e.g., game controllers or gesture tracking sys-tems), and its use of configuration files means the same ap-plication can run on a desktop PC and a Powerwall without recompiling. The VRJuggler-based application runs on each node in the display cluster. The viewports must be defined for each display in the configuration file, as well as assigning the head node.
Workspace Class
Interface Class
Message Class
Window Class
Application
Menu Class
PowerKeys Class
Hardware Interface
Software Interface
[image:5.595.312.549.96.207.2]Application Windows
Figure 2: Key classes in HiReD. Arrows signify communica-tion between instances of these classes.
VRJuggler replaces the GLUT layer of an OpenGL applica-tion, and therefore the programmer is only concerned with what needs to be drawn. The replacement GLUT calls are au-tomatically generated by VRJuggler depending on the content of its configuration file. Using an object-oriented approach, each application must be written in the form of a class that inherits from the VRJuggler class GlApp. This class contains all of the methods that VRJuggler calls during runtime, each of which can be overridden by the developer. The key meth-ods of the GlApp class can be seen in Table 1.
Workspace
The Workspace class is the main entry point and inherits from the VRJuggler class GlApp. It communicates directly with the interface class (a bridge between the Workspace and the hardware devices), the software interface classes, and the window classes (of which a new one is initialised every time an application is opened on the Workspace). At start up, HiReD presents an empty workspace.
All user input is handled in a separate class calledinterface, initialised by the workspace class. By separating input pro-cessing, the workspace class only handles world coordinates, retrieved from the interface class at the head node, then syn-chronises with the slave computers before the draw method.
Since the environment was custom-developed, the decision was made to increase the cursor size to 100x100 pixels. This allows the cursor to be easily seen when interacting either close up or at a distance, helps it to be used as a pointing tool during group work, and takes up less than 0.02% of the total screen space (in comparison, a 20x20 pixel desktop cursor occupies 0.02% of a 1600x1200 pixel desktop display). The cursor size is also beneficial to the Manipulation Layer (for moving and resizing windows), described later.
Windows
Method Usage
init Initialises the application data, including connections to input devices and seeding random numbers. preFrame This method is called every frame before the latePreFrame and draw methods. Only the head computer of
the cluster should perform any processing in this method. For example, application data such as date/time, random numbers, and the states of the input devices.
latePreFrame This is called after the preFrame method. This method allows data processing on the head computer to be synchronised across the rest of the cluster (e.g., ensuring all computers use the same positional device coordinates).
[image:6.595.332.523.338.655.2]draw This is called each frame and renders the current scene on each computer. All computers in the cluster will have the same content in this method and the configuration file specifies the view frustum of the display of each computer and, therefore, what is actually rendered.
Table 1: The methods of GlApp and their usage.
There is no direct communication between the workspace and application - all communication passes through the Window class. This means the workspace is not aware of the types of applications running. It restricts the communication avail-able, but simplifies the task of introducing new applications to the HiReD system.
Notification System
To remain consistent with modern operating systems, notifi-cations from any application are displayed in the bottom right corner of the workspace. An instance of the Notification class runs constantly in the background, and any application is able to send information, instructions or errors to the system, as well as the length of time the notification is to be displayed. When a new notification had been received, the notification
pops-up. Once it has been present for the desired length of time, it fades out. If more than one notification is sent, they are stacked on top of each other. To help the user decipher what type of notification is being displayed, information no-tifications have a blue background, instructions have a green background and errors have a red background.
Remote Access
Powerwalls have been used to present findings or as a teach-ing tool [28]. This requires the audience to be present, which (although ideal) is not always the case. The LibVNCServer allows for the development of a simple implementation of a VNC server, allowing remote users to view the HiReD workspace. Since VNC clients are available for Windows, Linux and Mac users, the session is easily accessible (poten-tially allowing users all over the world to view a scaled down version of the Powerwall session in progress).
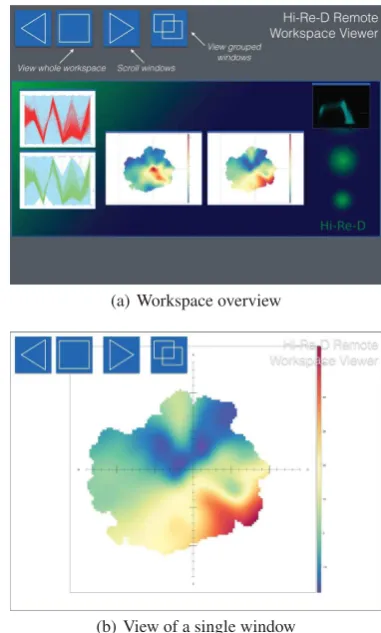
The VNC server allows remote users to both view the lay-out of the windows on the HiReD workspace, and view each window in detail. Figure 3(a) shows the content seen by a re-mote user when viewing the server through a standard VNC client. The buttons in the top left corner allow the user to view the whole workspace, or scroll through each of the windows. Users can also view each window in detail by clicking on it (see Figure 3(b)).
With single displays, rendering on-screen content to the VNC frame buffer would be a trivial task (e.g., using the OpenGL glReadPixels() function). With the clustered VRJuggler im-plementation, each computer renders a different part of the
desktop, so the whole display cannot be captured by glRead-Pixels() on a single computer. The solution was to use gl-Framebuffer. The glFramebuffer allows OpenGL geometry to be rendered in memory, rather than on-screen. This means the whole workspace can be rendered to memory on a single node. Each frame, changes in the glFramebuffer are identi-fied, then sent to the VNC frame buffer.
(a) Workspace overview
(b) View of a single window
Figure 3: (a) The HiReD workspace when viewed through a standard VNC Viewer. (b) Zooming-in to view a specific application.
There are two approaches to running applications through HiReD, either using the VNC client to stream from the desk-top, or by creating a C++ class and visualising data through OpenGL calls. For the latter approach, the following explains how to create a custom application to run inside HiReD.
• Create a new class that inherits from the base Application
class.
• Implement the virtual method draw(), specifying the
OpenGL calls for rendering this visualisation. Calls to the parent window class allow the application to retrieve the width and height of the window to provide relative dimen-sions.
• Implement the virtual method activeLatePreFrame() to
re-trieve and process user input; this includes both cursor po-sition and state-based input. To improve efficiency, this call is only made when the window is active (so only one application’s latePreFrame method is called during a single frame).
• Implement the virtual method latePreFrame() to process
animations and any other activity that should occur irrel-evant of whether the window is active.
• Create an instance of the On-Demand menu and populate
it with required menu options and respective actions.
The class can then be added to HiReD, and a menu option added to the list of available applications. Activating this op-tion then creates a new window class, which in turn initialises the new application. The case study section below gives ex-ample of applications implemented using this method.
INTERACTION
Device Independence
To minimise learning when moving from the desktop interac-tion, HiReD employs a point and click interface, thus a po-sitioning device is required to interact with the cursor. Due to the freedom VRJuggler offers with regards to hardware, many different devices can be used to record position (e.g., a mouse, GyroMouse11, gesture tracking system [21] or tablet
[20]). The decision was made to make the system device in-dependent. The large number of binary inputs available on a keyboard is not commonly found on non-tethered interaction devices. For this reason, the number of binary inputs was re-duced to eight, allowing HiReD to still work with a mouse and keyboard, but also with devices such as a mobile phone, game controller, or a pair of pinch gloves [10]. This, how-ever, makes symbolic input a non-trivial task; an on-screen keyboard is offered when using mid-air interaction devices.
Two sets of devices were used to test HiReD during devel-opment, the first was mouse & keyboard and second was a combination of an Ascension Flock of Birds magnetic tracker and Fakespace Pinch Gloves. The former uses the mouse to position the cursor, and captures binary input from five keys on the keyboard, and the left, middle and right mouse but-tons (making a total of eight binary inputs). The mouse &
11http://www.gyration.com/
keyboard rest on a wheeled podium, which can be reposi-tioned anywhere in front of the wall. The advantage of this approach is the minimal need for learning because most users are already familiar with these devices, also the mouse is very precise for positioning tasks. The disadvantage is that phys-ical navigation is severely restricted; users can not move and interact at the same time (which has been found to be benefi-cial [3]).
The Flock of Birds magnetically tracks the position of a small device in 3D space. By mounting the device on the back of the user’s dominant hand, the position of their hand can con-trol the position of the cursor. Pinch gloves are made of thin, lightweight material and detect contact between each of the four fingers and thumb (allowing for eight discreet inputs in total). They have been used in virtual environments for sym-bolic input, navigation and menu interaction [10], and also for augmented reality [23]. These two devices allow the user to be completely free handed, and both interact and physi-cally navigate simultaneously. The disadvantage is a greater learning time because users are unlikely to be familiar with these devices, and high-precision interaction with the Flock of Birds can be difficult due to magnetic interference.
Low-Precision Interface
This section describes a suite of techniques employed in HiReD to reduce the precision required to perform common operations found in multi-window environments.
Manipulation-Layer
A standard desktop window maximises the space available for window content by making the move and resize widgets small. For many operating systems, this has become the de facto standard for manipulating windows, but makes manipu-lation difficult if applied unchanged to a Powerwall. Increas-ing target sizes is the most obvious way to make the tasks easier, but this consumes valuable display real estate. The Manipulation Layer overcomes this by separating content in-teraction from window manipulation, overlaying a transpar-ent layer on top of the window.
When the cursor is inside the window, users can choose to interact with either the window content or the Manipulation Layer. For example, when using a mouse to interact, the left mouse button interacts with the content (as expected), and the middle mouse button interacts with the Manipulation Layer. The Manipulation Layer is divided into nine regions. Hold-ing the middle mouse button while the cursor is in the centre region allows the window to be moved, and when the cursor is in an outer region the window can be resized.
Power Lens
Although a requirement of HiReD is to maintain large target areas for widgets, sometimes this is not possible with data vi-sualisations that represent a large number of interactive data points. To aid with the interaction of such data, we imple-mented a non-distorted, fixed lens that appears automatically as the cursor approaches a target. It is based on the assump-tion that users travel fast when navigating towards a target, then slow down to make the final selection. As the user nears a target, the speed of the cursor will inevitably pass below a certain threshold. The lens is designed to automatically appear once this has happened. The user is then free to in-teract with the content of the lens, and can deactivate the lens by passing through one of its edges. This functional-ity suits Powerwall displays because it combines the reduced precision of fixed position lenses with the mobility of cursor tracked lenses. See Rooney et al. (2012) [26] for a more de-tailed explanation of the lens. The need for the lens may well depend on the task at hand, so users are able toggle the the lens on/off through the menu system.
On-Demand Menu
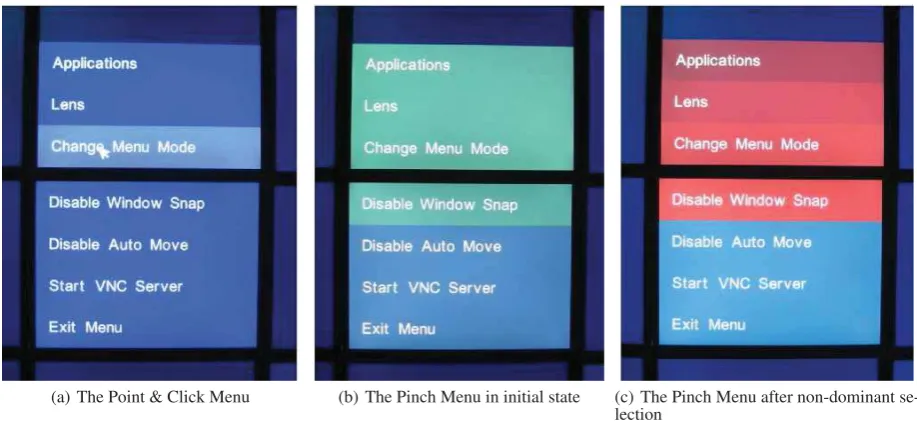
As screen real-estate increases, so does the distance to fixed position menus. A common solution to this is to introduce a menu that appears on-demand, and close to the cursor. This drove the design of the On-Demand Menu that, once acti-vated, presents the first hierarchy of menu options underneath the cursor (see Figure 4(a)). There are two ways in which users can interact with the menu, depending on the hardware available: (i) simply pointing and clicking on the large targets is a low-precision approach that suits mouse interaction, and (ii) theClutchmenu that requires only binary input, meaning that it suits devices such as the Fakespace Pinch Gloves.
A clutch method uses state-only input to interact, removing any concern for the level-of-precision since no pointing is re-quired. This type of state-only approach has been used in immersive virtual environments (VEs) [9], but was limited to only a two level hierarchy (one hierarchy per hand). The clutch menu requires the use of eight buttons, four controlled by each hand. A maximum of sixteen menu items is split into four groups of four (see Figure 4(b)). The four buttons on the left hand select the group, while the four buttons on the right hand select the desired option from that group (see Fig-ure 4(c)). This mode only requires three motor actions per level of the hierarchy, but is expected to be slower to learn.
Autoshift
It has been found that, with large display interaction, users work within a small focal region and place unwanted win-dows in the periphery [6, 14]. When users are seated in front of a wall, the focal region can be assumed to be the central area of the display. When users are encouraged to physically navigate, however, this assumption no longer holds since the focal region would be directly in front of the user, wherever they are standing. Dynamically assigning the focal region based on the users’ position can lead to problems since it is not clear whether they are working in a focal region, or inter-acting with one of the peripheral windows.
The alternative is for the user to explicitly inform the system of the location of their current focal region. This is imple-mented in HiReD by making the user position new windows manually. When a new window is opened, a red square (the same size as the window) is centred on, and tracks, the cur-sor. The user then moves the cursor to the location where they want the new window. Clicking replaces the red square with the new window. The assumption is made that if a user places a new window on top of existing windows, then it is the new window that contains the information that is of primary in-terest. Autoshift is designed to prevent overlap by pushing existing windows into the periphery.
Animation is used to allow users to track where the overlap-ping windows move to. The direction in which each window is moved is calculated by creating a vector between the cen-tres of the new window and overlapping window. The vector only changes if a window is pushed against an outer edge of the Powerwall, in this case it is pushed in a single plane, en-suring it does not get pushed off the screen. The algorithm is recursive, preventing existing windows from overlapping any other existing windows. The algorithm repeats until ei-ther one of two things occur: no windows are overlapping, or a window is pushed into one of the four corners. For the lat-ter, to further prevent overlapping, the window is reduced in size until it reaches it’s minimum size. Once a window is in a corner and has been reduced to the minimum size, the rule is ignored and overlapping is permitted.
Grouping
Grouping windows together based on the task they relate to is an established technique [25]. For this reason, a user-controlled grouping system was incorporated into HiReD. From any window, the grouping mode can be activated. Once activated, clicking on another window adds it to the group. After windows have been grouped, interaction returns to nor-mal. To symbolise which windows are members of which group, an icon is added to the title bars of all the windows in a particular group. To further improve on the grouping con-cept, two novel techniques for managing group layout were developed: Multi-drag provides a method for moving all win-dows in a group simultaneously, reducing the number of user interactions required to manage the position of the grouped windows within the workspace, and Re-Group addresses both window and task management by moving windows in the same group close together, pushing remaining windows into the periphery (by employing the Autoshift technique).
Window Snap
Many high resolution, wall-sized displays are constructed of a number of TFT monitors. A flaw in this design is a set of unavoidable horizontal and vertical bezels between each of the monitors. While this does not hinder target selection [5], users generally prefer not to work across bezels where possi-ble [14], and visual search errors are lower when data points do not cross bezels [5]. Therefore, a common method of in-teracting with multi-window environments on large displays is to house each window inside its own monitor.
(a) The Point & Click Menu (b) The Pinch Menu in initial state (c) The Pinch Menu after non-dominant se-lection
Figure 4: (a) The Point & Click menu system. (b) The pinch-menu when initially activated, waiting for the user to select one of the two groups (blue and green) using a non-dominant button. (c) The pinch menu when the first non-dominant button is held down, waiting for the user to select one of the options (four shades of red) using a dominant button.
feature was implemented into the HiReD system that shifts windows inside a set of bezels once they are within 100 pix-els of them. This makes it easier for users to arrange a set of windows side by side, without crossing bezels. Window snapping is also used for the Autoshift technique where a new window is always placed inside the nearest set of bezels.
The above suite of interface techniques aims to make inter-action with Powerwall displays easier by either reducing the precision required to interact, or reducing the amount of indi-vidual interactions required to perform an operation.
CASE STUDY: DATA VISUALISATION
While HiReD can be used as a general-purpose window man-ager for Powerwall displays, this section presents a case study of how HiReD can be specifically used for data visualisation demonstrating three example applications. This section starts with a description of three types of applications for render-ing data visualisations in HiReD. These are (i) visualisations that are rendered from a texture, (ii) vector-based visualisa-tions, and (iii) desktop visualisations that are viewed through the use of a VNC viewer. This is followed by a description of how HiReD was used by two groups of users to perform real-life data analysis.
Visualisation Implementation Methods
Texture-Based Visualisations
Texture-based (or bitmap) visualisations load an image into memory, which are then pasted onto a single polygon. The advantage is that once loaded, there is very little impact on performance. The disadvantage is that interactions are slower since visual updates need to be made to the texture first, and resizing them past their native resolution only distorts the im-age.
Two examples of texture-based visualisations that we devel-oped are a geographical data viewer, and an R plot visu-aliser12. For the latter, a drag-and-drop interface was
devel-oped to make it easy for users to select the data to be visu-alised. Once selected, an R script was executed as an external process and the resulting plot loaded back into the application as a textured image.
Bespoke Vector-Based Visualisations
Vector-based visualisations use standard OpenGL calls to draw the visualisation (e.g., usingGL LINE STRIP to draw a line graph). The advantage over texture-based rendering is that the visualisations can be increased in size, or change as-pect ratio, without stretching or distorting the visual output. The disadvantage is that they require additional processing power to render.
Three example visualisations that we developed were parallel coordinate plots, scatter charts, and line graphs. With all three being vector-based, they could be increased in size to the full width of the Powerwall without distorting the visual output. One dataset that we were working with had ˜50,000 rows of data (15 minute intervals over 18 months). By rendering the visualisation to the full width of the wall, it was possible to visualise the full time period without having to aggregate the data.
Desktop Applications
The ability to run existing desktop visualisation applica-tions (as well as more common applicaapplica-tions such as email clients and web browsers) on the HiReD workspace increases its functionality, and allows for longer sessions in front of
[image:9.595.71.530.100.312.2]HiReD without the need to constantly move back to the desk-top. The LibVNCClient library13 allowed a simple Virtual
Network Computing (VNC)14 client to be implemented and
incorporated into the HiReD system. VNC uses the RFB pro-tocol to allow users to view remote desktops. The graphi-cal state of the desktop is stored in a frame buffer. Rather than constantly refreshing the whole buffer every frame, only changes in the buffer are sent to the clients. This makes VNC very fast for small updates (e.g., inputting text or moving the cursor), but less so for large updates (e.g., panning when us-ing Google Earth). The VNC server works with both Mi-crosoft Windows and Linux, increasing the range of applica-tions available to run through HiReD.
Real-World Usage
As part of a collaboration with our University’s Transport Studies Institute, HiReD was used as a platform for visual-ising an air quality dataset (including traffic, pollutant and meteorological data). Initially, one domain expert used the software for one hour, before six MSc students spent a to-tal of 12 hours using the Powerwall (over the period of four days). The domain expert spent the majority of the session verifying that their dataset had been ratified correctly, while the students used their sessions to perform real data analysis as part of the MSc module: Low Carbon Technologies, where they were given a brief that asked them to (i) identify the im-pact of meteorology and local street geometry on pollution hot-spots, (ii) detect the influence of traffic characteristics, and (iii) detect the influence of primary NO2 (see Figure 1).
The whole of the Powerwall display (28 panels arranged 7x4, with a total resolution of 53.8 million pixels) was available as the data visualisation workspace. Both the domain expert and the students interacted with the Powerwall display using a mouse & keyboard rested on a wheeled podium that could be moved around if the users wished to do so. We chose to use mouse & keyboard rather than the magnetic tracker and pinch gloves because (i) the mouse is more precise than the tracker, (ii) the amount of learning required was reduced, and (iii) it was easier for the students to take turns interacting (which they did amongst themselves). More importantly, the students were conducting real data analysis and so we wanted to interfere with this process as little as possible.
The students could not be put under rigid experimental condi-tions since they were using the Powerwall as a learning tool, however, the sessions were recorded by video camera, which captured all of the actions performed by the users as well as the whole of the Powerwall display workspace. During both sessions, we were able to observe how HiReD was used, in-cluding the successes and limitations of the system. A more detailed analysis of the data gathered has been conducted, but it out of the scope of this paper. The following discussion is a high-level summary of how HiReD was used by both groups.
Discussion
We found that the domain expert often left the podium and physically navigated around the visualisations. This physical
13
http://libvncserver.sourceforge.net/
14http://www.realvnc.com/
departure from the podium was a characteristic of the distinc-tion between interacdistinc-tion and analysis. He would spend time creating a visualisation, importing the data, and resizing the window, before walking closer to the wall to inspect the view. This separation is likely to be an artefact of the mouse and keyboard on the platform, but this did not hinder the expert’s
physical navigation[3].
The students responded well to the large amount of display real estate. They liked the fact they had freedom of movement (for analysis rather than interaction), and found the space use-ful for comparing multiple visualisations. One student com-mented that the space allowed visualisations to be put to one side so that they were out of the way, but still visible, such that they could then return to the visualisations later on.
The students completed multiple goals, and often had win-dows from different goals open simultaneously. The students chose to group windows by simply placing them spatially close, usually to perform a comparison task. They made no use of the multi-drag and re-group features.
Surprisingly, only a few of the low-precision interaction tech-niques were used. One possible conclusion is that some of these techniques suit interactions where the user is stationary in the centre of the display. With the students able to phys-ically navigate, they were able to perform window and task management by physically moving around the display, rather than relying on virtual window-management techniques (such asautoshiftandgrouping).
CONCLUSION
In this paper we have presented the High-Resolution Desk-top, an extendable multi-window environment for perform-ing interactive data visualisation on cluster-driven displays. The environment provides a platform for creating new ap-plications tailored for high-resolution displays, thus proving consistency at the interface by removing the need to run col-lections of diverse, yet inconsistent, applications.
The suite of low-precision techniques we presented demon-strated various levels of success during the sessions with the domain expert and students. Simple low-precision techniques such as menu interaction, and window moving, resizing, and snapping were used with success, while more complex tech-niques such as autoshift or grouping were either barely used or not at all. This suggests that we still have a lot to learn about how users actually interact with Powerwall displays in real-life situations.
For future work, we hope to (i) continue to refine our low-precision environment, (ii) make HiReD widely available, and (iii) conclude our in-depth analysis of how the domain expert and student group interacted with the HiReD system.
ACKNOWLEDGEMENTS
REFERENCES
1. Andrews, C., Endert, A., and North, C. Space to think: large high-resolution displays for sensemaking. InCHI ’10, ACM (2010), 55–64.
2. Anslow, C., Marshall, S., Noble, J., Tempero, E., and Biddle, R. User evaluation of polymetric views using a large visualization wall. InSOFTVIS ’10, ACM (2010), 25–34.
3. Ball, R., North, C., and Bowman, D. Move to improve: promoting physical navigation to increase user performance with large displays. InCHI ’07, ACM (2007), 191–200.
4. Ball, R., Varghese, M., Sabri, A., Cox, D., Fierer, C., Peterson, M., Cartensen, B., and North, C. Evaluating the benefits of tiled displays for navigating maps. In
IASTED-HCI ’05(2005), 66–71.
5. Bi, X., Bae, S., and Balakrishnan, R. Effects of interior bezels of tiled-monitor large displays on visual search, tunnel steering, and target selection. InCHI ’10, ACM (2010), 65–74.
6. Bi, X., and Balakrishnan, R. Comparing usage of a large high-resolution display to single or dual desktop displays for daily work. InCHI ’09, ACM (2009), 1005–1014.
7. Bierbaum, A., Hartling, P., Morillo, P., and Cruz-Neira, C. Implementing immersive clustering with VRJuggler.
Computational Science and Its Applications 3482
(2005), 1119–1128.
8. Booker, J., Buennemeyer, T., Sabri, A., and North, C. High-resolution displays enhancing geo-temporal data visualizations. InACM-SE 45, ACM (2007), 443–448.
9. Bowman, D., and Wingrave, C. Design and Evaluation of Menu Systems for Immersive Virtual Environments. InIEEE Virtual Reality, IEEE Computer Society (2001), 149–156.
10. Bowman, D., Wingrave, C., Campbell, J., and Ly, V. Using pinch gloves; for both natural and abstract interaction techniques in virtual environments. In
Human-Computer Interaction(2001), 629–633.
11. Czerwinski, M., Smith, G., Regan, T., Meyers, B., Robertson, G., and Starkweather, G. Toward characterizing the productivity benefits of very large displays. InInteract(2003), 9–16.
12. Fitts, P. The Information Capacity of the Human Motor System in Controlling the Amplitude of Movement.
Journal of Experimental Psychology 47(1954), 381–391.
13. Goodyer, C., Hodrien, J., Wood, J., Kohl, P., and Brodlie, K. Using high resolution displays for high resolution cardiac data.Philosophical Transactions of the Royal Society 367(2009), 2667–2677.
14. Grudin, J. Partitioning digital worlds: focal and peripheral awareness in multiple monitor use. InCHI ’01, ACM (2001), 458–465.
15. Hodrien, J., Wood, J., and Ruddle, R. The design and implementation of a 50 million pixel Powerwall display. Tech. rep., VizNet, 2007.
16. Humphreys, G., Houston, M., Ng, R., Frank, R., Ahern, S., Kirchner, P., and Klosowski, J. Chromium: a stream-processing framework for interactive rendering on clusters.ACM Transactions on Graphics 21(2002), 693–702.
17. Jedrysik, P., Moore, J., Stedman, T., and Sweed, R. Interactive displays for command and control. In
Aerospace Conference, vol. 2 (2000), 341–351.
18. Jeong, B., Renambot, L., Jagodic, R., Singh, R., Aguilera, J., Johnson, A., and Leigh, J.
High-performance dynamic graphics streaming for scalable adaptive graphics environment. In
Supercomputing, ACM (2006), 24.
19. Liang, H., Arangarasan, R., and Theller, L. Dynamic visualization of high resolution GIS dataset on
multi-panel display using arcgis engine.Computers and Electronics in Agriculture 58(2007), 174–188.
20. Nancel, M., Chapuis, O., Pietriga, E., Yang, X., Irani, P., and Beaudouin-Lafon, M. High-precision pointing on large wall displays using small handheld devices. InCHI ’13, ACM (2013), 831–840.
21. Nancel, M., Wagner, J., Pietriga, E., Chapuis, O., and Mackay, W. Mid-air pan-and-zoom on wall-sized displays. InCHI 11, ACM (New York, NY, USA, 2011), 177–186.
22. Ni, T., Schmidt, G., Staadt, O., Livingston, M., Ball, R., and May, R. A Survey of Large High-Resolution Display Technologies, Techniques, and Applications. In
IEEE VR, IEEE Computer Society (2006), 223–236.
23. Piekarski, W., and Smith, R. Robust gloves for 3D interaction in mobile outdoor AR environments. In
ISMAR 2006, IEEE Computer Society (2006), 251–252.
24. Robertson, G., Czerwinski, M., Baudisch, P., Meyers, B., Robbins, D., Smith, G., and Tan, D. The
Large-Display User Experience.IEEE Computer Graphics and Applications 25(2005), 44–51.
25. Robertson, G., Horvitz, E., Cerwinski, M., Baudisch, P., Hutchings, D., Meyers, B., Robbins, D., and Smith, G. Scalable Fabric: Flexible Task Management. InAVI ’04, ACM (2004), 85–89.
26. Rooney, C., and Ruddle, R. Improving window
manipulation and content interaction on high-resolution, wall-sized displays.IJHCI 28, 7 (2012), 423–432.
27. Tan, D. S., Gergle, D., Scupelli, P., and Pausch, R. With similar visual angles, larger displays improve spatial performance. InCHI ’03, ACM (2003), 217–224.
28. Treanor, D., Owers, J., Hodrien, J., Quirke, P., and Ruddle, R. Virtual reality Powerwall versus