This is a repository copy of
An application of multi-level DC-link converter for optimised
permutation control of PV sources under partial shading
.
White Rose Research Online URL for this paper:
http://eprints.whiterose.ac.uk/83895/
Version: Accepted Version
Proceedings Paper:
Abdalla, I, Corda, J and Zhang, L (2014) An application of multi-level DC-link converter for
optimised permutation control of PV sources under partial shading. In: IET Conference
Publications. 3rd Renewable Power Generation Conference (RPG 2014), 24-25 Sep 2014,
Naples, Italy. Institution of Engineering and Technology . ISBN 978-1-84919-917-9
https://doi.org/10.1049/cp.2014.0895
© 2014, the Institution of Engineering and Technology. This paper is a post print of a paper
submitted to and accepted for publication in the proceedings of the 3rd Renewable Power
Generation Conference (RPG 2014), and is subject to Institution of Engineering and
Technology Copyright. The copy of record is available at the IET Digital Library. Uploaded
in accordance with the publisher's self-archiving policy.
[email protected] https://eprints.whiterose.ac.uk/ Reuse
Unless indicated otherwise, fulltext items are protected by copyright with all rights reserved. The copyright exception in section 29 of the Copyright, Designs and Patents Act 1988 allows the making of a single copy solely for the purpose of non-commercial research or private study within the limits of fair dealing. The publisher or other rights-holder may allow further reproduction and re-use of this version - refer to the White Rose Research Online record for this item. Where records identify the publisher as the copyright holder, users can verify any specific terms of use on the publisher’s website.
Takedown
If you consider content in White Rose Research Online to be in breach of UK law, please notify us by
An application of multi-level DC-link converter for optimised
permutation control of PV sources under partial shading
I Abdalla, J Corda, L Zhang
School of Electronic and Electrical Engineering, University of Leeds Leeds LS2 9JT, United Kingdom
E-mail: [email protected]
Keywords: photovoltaic partial shading; maximum power
point; multi-level converter;.
Abstract
The paper describes application of a multi-level DC-link converter in overcoming the problem of partially shaded series-connected PV sources. The converter control engages a permutation algorithm which enables each PV source of the string to produce the maximum power. The main features of the system are: (i) a continual operation of all PV sources, shaded and non-shaded, at their maximum power points, (ii) delivery of all extracted power from PV sources to the load and (ii) generation of multi-level output voltage waveform with a low total harmonic distortion.
1
Introduction
Partial shading of an array of photo-voltaic (PV) sources is a
well-known problem which is manifested as a
disproportionate reduction of electrical power generated from the array. This is caused by reduction of the current generated by the shaded source/s, which in turn becomes a limiting value of the current for the whole series string including the non-shaded sources.
The most common and rudimentary remedy for this problem is inclusion of bypassing diodes which temporarily eliminate shaded sources in the array, but this causes a significant reduction of power generated from the PV array. More sophisticated methods for solving the problem of partial shading, such as for example methods discussed in [1, 2], are based on avoiding direct connections of individual PV sources by using power electronic converters, which results in better utilisation of PV sources within the array.
The emerging method in dealing with the partial shading problem is based on connecting PV sources into the topology of a multi-level converter, which enables control of each PV source individually. In [3], for example, this concept has been described using five-level H-bridge converter with two PV sources. Since each PV source was emulated by a voltage source connected in series with a resistor, the experiment has not reflected the correct PV response particularly under partial shading. In another example [4], a multi-level diode-clamped converter is used to extract the power from each PV
source separately. The experimental results showed that the total achieved power was delivered completely to the load, but it has not been shown if all PV sources operated at individual maximum power point (MPP). In [5], the principles of controlling a multi-level DC-link converter through a novel algorithm based on the permutation of PV sources, is presented. The algorithm ensures that all PV sources of the string operate at their individual MPP under non-uniform irradiance. In the current paper, a modification is made in the PV permutation algorithm resulting in the quality improvement of the output.
2
Permutation Algorithm
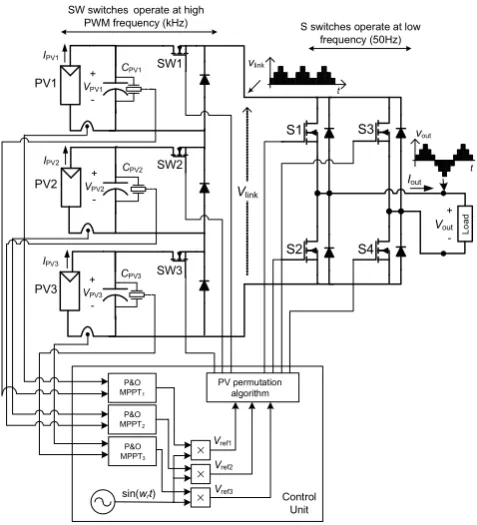
In the topology shown in Fig.1 each PV unit consists of a single PV source, a capacitor, a switch and a diode. Units are connected in series and any of them can be switched in or out of the chain via its switch. These switches (SW1, SW2, SW3) operate at a high switching frequency and are controlled by the direct PWM method [6] to form the multi-level DC link waveform. (When a unit is switched off, it is being bypassed by a diode.) The H–bridge inverter at the output serves to produce alternative positive and negative output voltage half-cycles of the required output frequency. The generation of multiple voltage levels, combined with proper control, enables forming the approximate sinewave output. The control unit includes a perturbation and observation (P&O) MPPT block for each PV source. These provide a separate P&O tracking algorithm and the PI control for each PV source. The output signals of these blocks are multiplied by unity sinusoidal signal to form AC reference signalsvref1,vref2,
vref3for the control of the output H-bridge inverter.
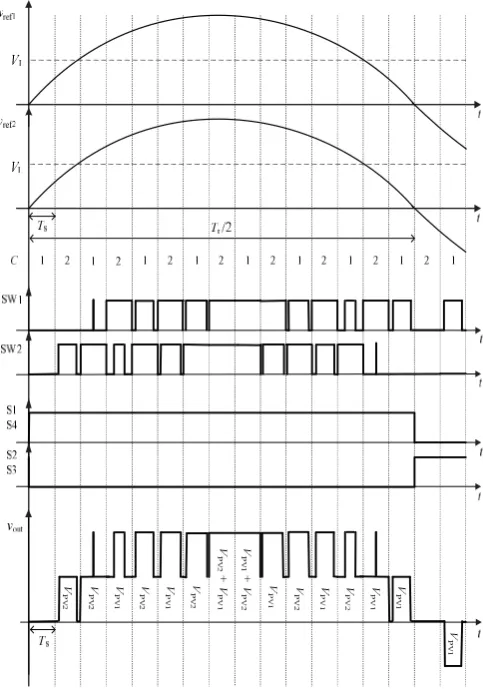
All PV sources are sequentially permutated through consecutive PWM switching cycles according to the numerical count (C) as illustrated in Fig.2. The PV source which sequentially comes in turn at the highest voltage level is the only one which is controlled at a particular switching cycle (Ts), while other sources are used to build the
Fig. 1: PV system controlled via multi-level converter
The direct PWM is used for determining the required lower and higher output voltage levels (VolandVoh) and their time
intervals (toff andton) within each PWM switching interval of
periodTs.
The direct PWM normalized reference voltage is given as:
(1) where VL denotes the MPP voltage at irradiance of 1000
W/m2and j= 1, 2, …n is the PV source index.
The integer part of the normalized reference voltage is defined as the normalized offset voltage, and it is given as
(2)
Thetoninterval of the PV source which is being controlled at
a particular switching period, is given as
(3) Table 1 illustrates the PV output generation stage of the algorithm in the basic system with two PV sources. IfC=1, the PV1 source is controlled by applying the direct PWM to
vref1 to find the required ton time. The role of vref2 is to
determine Vol by checking voffset2. When C=2, the PV2 is
controlled throughvref2, andvref1is used to determineVol.
Unlike the basic algorithm [5], the improved algorithm does not represent the PV source at the output if its offset voltage is zero, except in the case when all offset voltages are zero. The reason for introducing this exception is to initiate the control and it is also required in the case of low PWM reference signals. Referring to Table 1, ifC= 1,Voffset1= 0 and
Voffset2= 1, then VPV1 will not be presented at the output and
the output is only represented byVPV2for the time periodTs.
Even though there is no control for PV1 source for this time interval, the bypass capacitor CPV1 is charging for the entire
period Ts, which enables VPV1 to recover so that a series
connection is avoided for the time intervaltonwhen the source
[image:3.595.304.552.386.641.2]PV1 is shaded.
Table 1: The output generation from two PV sources
The process of generating the output waveform in the basic system with two PV sources (five-level DC-link converter) is graphically illustrated in the Appendix.
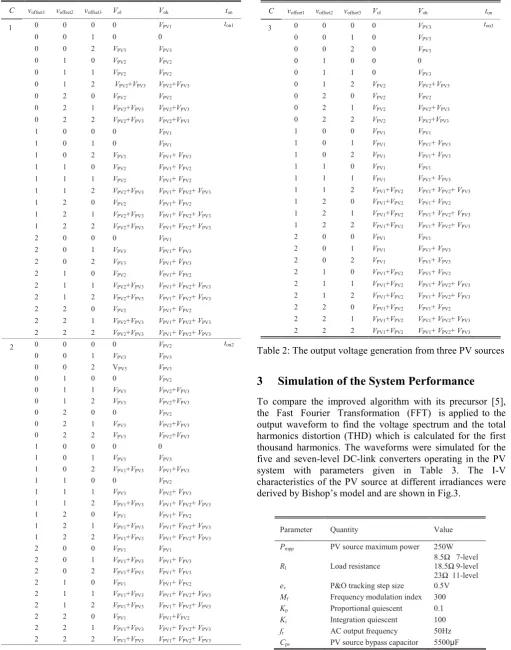
Table 2 shows the output generation stage of the algorithm for the case of three PV sources (n= 3) as a function of the offset voltages.
PV1
PV2
CPV1
CPV2
+
Vout
-Iout
S1 S3
S2 S4
+ VPV1
-+ VPV2
-IPV1
IPV2
P&O MPPT2
SW1
SW2
Vlink
sin(wrt)
SW switches operate at high
PWM frequency (kHz) S switches operate at low frequency (50Hz)
L
o
a
d
Vref1
Vref2
× ×
PV3
CPV3
+ VPV3
-IPV3
SW3
×
P&O MPPT3
P&O MPPT1
Vref3
PV permutation algorithm
t
vlink
vout
Control Unit
t
L ) ref( ) ref(
V v
v j ? j
) ( ref( ) offset( )
)
on(j Ts v j v j
[image:3.595.49.285.397.532.2]t ? © /
Fig. 2: Permutation of PV sources through consecutive PWM switching cycles
C voffset 1 voffset 2 Output generation per
switching periodTs
0 0
1 0
0 1
1
1 1
0 0
0 1
1 0
2
1 1
] [ int ref( ) )
offset(j v j
Table 2: The output voltage generation from three PV sources
3
Simulation of the System Performance
[image:4.595.316.533.608.738.2]To compare the improved algorithm with its precursor [5], the Fast Fourier Transformation (FFT) is applied to the output waveform to find the voltage spectrum and the total harmonics distortion (THD) which is calculated for the first thousand harmonics. The waveforms were simulated for the five and seven-level DC-link converters operating in the PV system with parameters given in Table 3. The I-V characteristics of the PV source at different irradiances were derived by Bishop’s model and are shown in Fig.3.
Table 3: PV system parameters
C voffset1 voffset2 voffset3 Vol Voh ton
0 0 0 0 VPV1
0 0 1 0 0
0 0 2 VPV3 VPV3
0 1 0 VPV2 VPV2
0 1 1 VPV2 VPV2
0 1 2 VPV2+VPV3 VPV2+VPV3
0 2 0 VPV2 VPV2
0 2 1 VPV2+VPV3 VPV2+VPV3
0 2 2 VPV2+VPV3 VPV2+VPV3
1 0 0 0 VPV1
1 0 1 0 VPV1
1 0 2 VPV3 VPV1+VPV3
1 1 0 VPV2 VPV1+VPV2
1 1 1 VPV2 VPV1+VPV2
1 1 2 VPV2+VPV3 VPV1+VPV2+VPV3
1 2 0 VPV2 VPV1+VPV2
1 2 1 VPV2+VPV3 VPV1+VPV2+VPV3
1 2 2 VPV2+VPV3 VPV1+VPV2+VPV3
2 0 0 0 VPV1
2 0 1 VPV3 VPV1+VPV3
2 0 2 VPV3 VPV1+VPV3
2 1 0 VPV2 VPV1+VPV2
2 1 1 VPV2+VPV3 VPV1+VPV2+VPV3
2 1 2 VPV2+VPV3 VPV1+VPV2+VPV3
2 2 0 VPV2 VPV1+VPV2
2 2 1 VPV2+VPV3 VPV1+VPV2+VPV3
1
2 2 2 VPV2+VPV3 VPV1+VPV2+VPV3
ton1
0 0 0 0 VPV2
0 0 1 VPV3 VPV3
0 0 2 VPV3 VPV3
0 1 0 0 VPV2
0 1 1 VPV3 VPV2+VPV3
0 1 2 VPV3 VPV2+VPV3
0 2 0 0 VPV2
0 2 1 VPV3 VPV2+VPV3
0 2 2 VPV3 VPV2+VPV3
1 0 0 0 0
1 0 1 VPV3 VPV3
1 0 2 VPV1+VPV3 VPV1+VPV3
1 1 0 0 VPV2
1 1 1 VPV3 VPV2+VPV3
1 1 2 VPV1+VPV3 VPV1+VPV2+VPV3
1 2 0 VPV1 VPV1+VPV2
1 2 1 VPV1+VPV3 VPV1+VPV2+VPV3
1 2 2 VPV1+VPV3 VPV1+VPV2+VPV3
2 0 0 VPV1 VPV1
2 0 1 VPV1+VPV3 VPV1+VPV3
2 0 2 VPV1+VPV3 VPV1+VPV3
2 1 0 VPV1 VPV1+VPV2
2 1 1 VPV1+VPV3 VPV1+VPV2+VPV3
2 1 2 VPV1+VPV3 VPV1+VPV2+VPV3
2 2 0 VPV1 VPV1+VPV2
2 2 1 VPV1+VPV3 VPV1+VPV2+VPV3
2
2 2 2 VPV1+VPV3 VPV1+VPV2+VPV3
ton2
Continued ….
C voffset1 voffset2 voffset3 Vol Voh ton
0 0 0 0 VPV3
0 0 1 0 VPV3
0 0 2 0 VPV3
0 1 0 0 0
0 1 1 0 VPV3
0 1 2 VPV2 VPV2+VPV3
0 2 0 VPV2 VPV2
0 2 1 VPV2 VPV2+VPV3
0 2 2 VPV2 VPV2+VPV3
1 0 0 VPV1 VPV1
1 0 1 VPV1 VPV1+VPV3
1 0 2 VPV1 VPV1+VPV3
1 1 0 VPV1 VPV1
1 1 1 VPV1 VPV1+VPV3
1 1 2 VPV1+VPV2 VPV1+VPV2+VPV3
1 2 0 VPV1+VPV2 VPV1+VPV2
1 2 1 VPV1+VPV2 VPV1+VPV2+VPV3
1 2 2 VPV1+VPV2 VPV1+VPV2+VPV3
2 0 0 VPV1 VPV1
2 0 1 VPV1 VPV1+VPV3
2 0 2 VPV1 VPV1+VPV3
2 1 0 VPV1+VPV2 VPV1+VPV2
2 1 1 VPV1+VPV2 VPV1+VPV2+VPV3
2 1 2 VPV1+VPV2 VPV1+VPV2+VPV3
2 2 0 VPV1+VPV2 VPV1+VPV2
2 2 1 VPV1+VPV2 VPV1+VPV2+VPV3
3
2 2 2 VPV1+VPV2 VPV1+VPV2+VPV3
ton3
Parameter Quantity Value
Pmpp PV source maximum power 250W
Rl Load resistance
:07µ"""9/ngxgn" 3:07µ";/ngxgn" 45µ""33/ngxgn"
ev P&O tracking step size 0.5V
Mf Frequency modulation index 300
Kp Proportional quiescent 0.1
Ki Integration quiescent 100
fr AC output frequency 50Hz
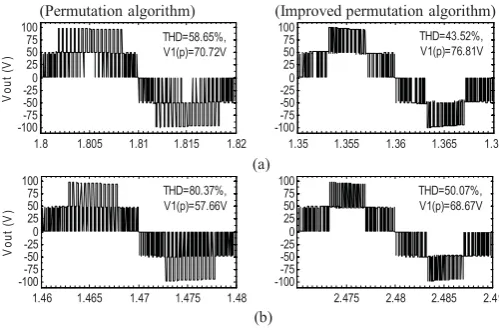
Referring to Fig.4a, which relates to the five-level converter with sources PV1 and PV2 exposed to irradiances of 500 and 1000 W/m2respectively, the improved algorithm gave better voltage waveform (shown on the right) compared with the precursor algorithm. The THD of 43.52% and the 50-Hz fundamental peak voltageV1(p)=76.81V was achieved with the
improved algorithm, while THD=58.65% and V1(p)=70.72V
was achieved with the precursor. In Fig.4b the irradiances 750 and 500 W/m2 were applied to PV1 and PV2 respectively. THD of 50.07% and V1(p)=68.67V are achieved by the
improved algorithm, compared with THD of 80.37% and
V1(p)=57.66V by the precursor.
Similar comparison was made for the seven-level converter operating with three PV sources. At irradiances of 1000, 500
and 1000W/m2 applied to PV1, PV2 and PV3 respectively (Fig.5a), the improved algorithm generates substantially better output waveform (THD=35.72%, V1(p)=108.64V)
compared to the waveform achieved with the precursor (THD=57.41%, V1(p)=95.81V). When the irradiances of 250,
750 and 1000W/m2 are applied to the PV1, PV2 and PV3 respectively (Fig.5b), the voltage waveform resulting from the improved algorithm has THD=42.52% andV1(p)=94.04V,
while with the precursor THD=58.02% andV1(p)=89.62V.
The performance of the PV system using the improved algorithm was also simulated under dynamic irradiance. The system showed ability to track the MPP of each PV source without affecting other PV sources. Fig.6 illustrates the extracted power from each PV source and the total power delivered to the load from the seven-level converter for a sequence of events in terms of the irradiance variations. Initially the full irradiance (1000 W/m2) is applied to all three PV sources, so the extracted power from each source is 250W and a total power of 750 W is delivered to the load. In the time between 2 and 5 seconds, the irradiance to PV3 source is halved, while PV1 and PV2 are still at full irradiance. The extracted power from PV3 is now reduced to 116 W which matches the MPP on I-V characteristic of Fig.3 at 50% shading, i.e. at the irradiance of 500 W/m2. The power of PV1 and PV2 are not affected by the shading of PV3, so the total delivered power is 616 W. During the time interval between 5 and 8 seconds, both PV2 and PV3 are shaded at the halved irradiance (500 W/m2) while PV1 is under the full irradiance, and the delivered power is 482 W. During the time interval between 8 and 11 seconds, all three PV sources are operated shaded to the halved irradiance (500 W/m2), and the power delivered to the load is reduced to 348 W. After 11 seconds all three PV sources are again exposed to the full irradiance and are recovered to their MPPs of 250 W delivering the total power of 750 W.
(Permutation algorithm) (Improved permutation algorithm)
3.27 3.275 3.28 3.285 3.29
-150 -100 -50 0 50 100 150 Vo u t (V )
4.99 4.995 5 5.005 5.0
-150 -100 -50 0 50 100 150 THD=57.41%, V1(p)=95.81V THD=35.72%, V1(p)=108.64V (a)
2.57 2.575 2.58 2.585 2.59
-150 -100 -50 0 50 100 150 Vo u t (V)
2.81 2.815 2.82 2.825 2.8
[image:5.595.48.289.84.277.2]-150 -100 -50 0 50 100 150 THD=58.02%, V1(p)=89.62V THD=42.52%, V1(p)=94.07V (b)
Fig. 5: Simulated seven-level output voltage waveforms produced by the precursor algorithm and the improved algorithm under irradiances applied to PV1, PV2 and PV3 respectively: (a) 100, 500 and 1000 W/m2; (b) 250, 750 and 1000 W/m2.
(Permutation algorithm) (Improved permutation algorithm)
1.8 1.805 1.81 1.815 1.82
-100-75 -50 -250 25 50 75 100 Vo u t (V )
1.35 1.355 1.36 1.365 1.37
-100-75 -50 -250 25 50 75 100 THD=58.65%, V1(p)=70.72V THD=43.52%, V1(p)=76.81V (a)
1.46 1.465 1.47 1.475 1.48
-100 -75 -50 -25 0 25 50 75 100 Vo u t (V )
2.475 2.48 2.485 2.49
-100 -75 -50 -25 0 25 50 75 100 THD=80.37%, V1(p)=57.66V THD=50.07%, V1(p)=68.67V (b)
Fig. 4: Simulated five-level output waveforms produced by the precursor algorithm and the improved algorithm
under irradiances applied to PV1 and PV2
respectively: (a) 500 and 1000 W/m2; (b) 750 and 500 W/m2.
Voltage (V)
0 5 10 15 20 25 30 35 40 45 50 55 60 64
0 0.5 1 1.5 2 2.5 3 3.5 4 4.5 5 5.5 6 Ip v( A ) 2 2 1000 W/m 2 750 W/m 2 500 W/m 250 W/m
5 A, 50 V 250 W
3.74 A, 48.62 V 181.9 W
2.48 A, 46.66 V 115.9 W
[image:5.595.304.552.203.365.2]1.23 A, 43.33 V 53.38 W Cur re n t (A )
[image:5.595.43.293.492.657.2]4
Conclusions
The main features of the developed PV system, which uses the improved permutation algorithm, are: (i) the upholding of operation of all PV sources (shaded and non shaded) at their MPPs, (ii) the delivery of all extracted power from PV sources to the load and (ii) the generation of improved multi-level voltage waveforms with low THD.
The proposed system was simulated using the Matlab– Simulink for five and seven-level DC-link converter. The comparison between the previous and the improved permutation algorithm have shown that the latter generates a lower distortion of the output waveform and a higher amplitude of the fundamental harmonic of the output voltage.
The time varying irradiance levels were applied to test dynamic behaviour of the system in terms of the MPP tracking. The algorithm enables each shaded PV source to be recovered to its MPP without affecting other PV sources in the circuit.
Appendix
WhenC= 1:
If voffset1is either 0 or 1 andvoffset2= 0, then:
SW1 is ‘on’ during intervalton1and ‘off’ otherwise;
SW2 is ‘off’ during entire periodTs.
If voffset1= 0 andvoffset2= 1, then:
SW1 is ‘off’ and SW2 is ‘on’ during entire periodTs.
If voffset1= 1 andvoffset2= 1, then:
SW1 is ‘on’ during interval ton1and ‘off’ otherwise;
SW2 is ‘on’ during entire periodTs.
WhenC= 2:
If voffset2is either 0 or 1 andvoffset1= 0, then:
SW1 is ‘off’ during entire periodTs;
SW2 is ‘on’ during intervalton2and ‘off’ otherwise.
If voffset2 is 0 andvoffset1= 1, then:
SW2 is ‘off’ and SW1 is ‘on’ during entire periodTs.
If voffset1= 1 andvoffset2= 1, then:
SW1 is ‘on’ during entire periodTs;
SW2 is ‘on’ during interval ton2and ‘off’ otherwise.
In Fig.1A,vref1andvref2are two reference voltages of the
five-level inverter. These signals are sampled at intervals Ts
yielding Mf samples for each reference signal over the time
period Tr(= 1/fr). At each intervalTs, the sampled values are
applied to the Eqs.(1) - (3) for generating the required control signals.
0 0.5 1 1.5 2 2.5 3 3.5 4 4.5 5 5.5 6 6.5 7 7.5 8 8.5 9 9.5 1010.51111.512 70
100 130 160 190 220 250
P
V
1
P
o
w
e
r
(W
)
0 0.5 1 1.5 2 2.5 3 3.5 4 4.5 5 5.5 6 6.5 7 7.5 8 8.5 9 9.5 1010.51111.512 70
100 130 160 190 220 250
PV2
P
o
w
e
r
(W
)
0 0.5 1 1.5 2 2.5 3 3.5 4 4.5 5 5.5 6 6.5 7 7.5 8 8.5 9 9.5 1010.51111.512 100
125 150 175 200 225 250
PV3
Po
w
e
r
(W
)
0 0.5 1 1.5 2 2.5 3 3.5 4 4.5 5 5.5 6 6.5 7 7.5 8 8.5 9 9.5 1010.51111.512 250
350 450 550 650 750
L
o
a
d
p
o
w
e
r
(W
)
0 0.5 1 1.5 2 2.5 3 3.5 4 4.5 5 5.5 6 6.5 7 7.5 8 8.5 9 9.5 1010.51111.512 450
550 650 750 850 950 1050
Irra
d
ia
n
c
e
(W
/m
)
Time (s)
PV3 PV2 PV1
[image:6.595.44.293.86.381.2]2
Fig. 6: Irradiance waveforms, the extracted power of PV1, PV2, PV3, and the load power of the seven-level DC-link converter
[image:6.595.309.551.384.730.2]References
[1] T. Shimizu, M. Hirakata, T. Kamezawa, H. Watanabe, "Generation control circuit for photovoltaic modules",
IEEE Trans. Power Electronics, Vol.16, No.3,
pp.293-300, May 2001.
[2] G. R. Walker, P. C. Sernia, "Cascaded DC-DC converter connection of photovoltaic modules", IEEE Trans.
Power Electronics, Vol.19, No.4, pp.1130-1139, July
2004.
[3] S. J. Lee, H. S. Bae, B. H. Cho, "Modeling and control ofthe single-phase photovoltaic grid-connected cascaded H-bridge multilevel inverter",IEEE Energy Conversion
Congress (ECCE’09), pp.43-47, (2009).
[4] S. Busquets-Monge, J. Rocabert, P. Rodriguez, S. Alepuz, J. Bordonau, "Multilevel diode-clamped converter for photovoltaic generators with independent voltage control of each solar array", IEEE Trans. Industrial Electronics, Vol.55, No.7, pp.2713-2723, July 2008.
[5] I. Abdalla, J. Corda, L. Zhang, "Multilevel DC-Link Inverter and Control Algorithm to Overcome the PV Partial Shading", IEEE Trans. Power Electronics, Vol.28, No.1, pp.14-18, Jan.2013.