Brazilian Amazon: Insights from Extensive Time-Series
Analysis of Remote Sensing Data
Joa˜o M. B. Carreiras1,2*, Joshua Jones3, Richard M. Lucas3,4, Cristina Gabriel1
1Tropical Research Institute (IICT), Lisboa, Portugal,2National Centre for Earth Observation (NCEO), Centre for Terrestrial Carbon Dynamics (CTCD), University of Sheffield,
Sheffield, South Yorkshire, United Kingdom,3Department of Geography and Earth Sciences, Aberystwyth University, Aberystwyth, Ceredigion, United Kingdom,4Centre
for Ecosystem Science, School of Biological, Earth and Environmental Sciences, University of New South Wales, Sydney, New South Wales, Australia
Abstract
Throughout the Amazon region, the age of forests regenerating on previously deforested land is determined, in part, by the periods of active land use prior to abandonment and the frequency of reclearance of regrowth, both of which can be quantified by comparing time-series of Landsat sensor data. Using these time-series of near annual data from 1973–2011 for an area north of Manaus (in Amazonas state), from 1984–2010 for south of Santare´m (Para´ state) and 1984–2011 near Machadinho d’Oeste (Rondoˆnia state), the changes in the area of primary forest, non-forest and secondary forest were documented from which the age of regenerating forests, periods of active land use and the frequency of forest reclearance were derived. At Manaus, and at the end of the time-series, over 50% of regenerating forests were older than 16 years, whilst at Santare´m and Machadinho d’Oeste, 57% and 41% of forests respectively were aged 6–15 years, with the remainder being mostly younger forests. These differences were attributed to the time since deforestation commenced but also the greater frequencies of reclearance of forests at the latter two sites with short periods of use in the intervening periods. The majority of clearance for agriculture was also found outside of protected areas. The study suggested that a) the history of clearance and land use should be taken into account when protecting deforested land for the purpose of restoring both tree species diversity and biomass through natural regeneration and b) a greater proportion of the forested landscape should be placed under protection, including areas of regrowth.
Citation:Carreiras JMB, Jones J, Lucas RM, Gabriel C (2014) Land Use and Land Cover Change Dynamics across the Brazilian Amazon: Insights from Extensive Time-Series Analysis of Remote Sensing Data. PLoS ONE 9(8): e104144. doi:10.1371/journal.pone.0104144
Editor:Bruno He´rault, Cirad, France
ReceivedMarch 14, 2014;AcceptedJuly 10, 2014;PublishedAugust 6, 2014
Copyright:ß2014 Carreiras et al. This is an open-access article distributed under the terms of the Creative Commons Attribution License, which permits unrestricted use, distribution, and reproduction in any medium, provided the original author and source are credited.
Funding:This study was supported by the ‘‘REGROWTH-BR - Remote sensing of regenerating tropical forests in Brazil: mapping and retrieving biophysical parameters’’ project (Ref. PTDC/AGR-CFL/114908/2009), funded by the Foundation for Science and Technology (FCT, http://www.fct.pt/index.phtml.en), Portugal. J.M.B. Carreiras’ work was partially funded by NERC National Centre for Earth Observation (Ref: R8/H12/82). The funders had no role in study design, data collection and analysis, decision to publish, or preparation of the manuscript.
Competing Interests:The authors have declared that no competing interests exist.
* Email: j.carreiras@sheffield.ac.uk
Introduction
Humans are increasingly changing the state and dynamics of the Earth system, affecting processes within and between the biosphere, hydrosphere and atmosphere. Climate change is a recognized consequence of such changes and would be occurring at a faster rate if several ecosystem services at the global scale were absent [1]. For example, less than half of the total amount of carbon dioxide (CO2) released to the atmosphere each year remains there because of removal by terrestrial and ocean carbon (C) sinks [2]. Losses of biodiversity from terrestrial ecosystems have also been substantial.
The role of terrestrial ecosystems in the global C cycle had been widely recognized in the literature (e.g., [3]), with particular recognition given to the pan-tropical belt [4,5]. In the past two decades, two main international conventions have sought to establish mechanisms aimed at stabilizing greenhouse gases (GHG) concentrations in the atmosphere (the United Nations Framework Convention on Climate Change; UNFCCC) and protecting biological diversity (Convention on Biological Diversity; CBD). Specifically, the alarmingly high rate of tropical land use and land
deforested areas to recover ecosystems is needed. This study addresses these issues by focusing on sites in the Brazilian Legal Amazon (BLA) that have experienced deforestation and variable histories of subsequent land use.
The BLA covers an area of approximately 5,000,000 km2and consists primarily of primary tropical forest (rain and seasonal forest) [12]. Brazil’s National Institute for Space Research (Instituto Nacional de Pesquisas Espaciais, INPE) has, since 1988, undertaken annual mapping of deforestation within the BLA using remote sensing data [13], which has been highly variable across the region. For example, an average deforestation rate of 21,050 km2 yr21 was reported between 1977 and 1988, which decreased subsequently to 11,030 km2 yr21 up to 1991; from 1991 to 2004 the deforestation rate increased to 27,772 km2 yr21(reaching a record high of 29,059 km2 yr21 from 1994 to 1995) and then decreased to a record low of 4,571 km2yr21in 2012 [13]. Currently, much of the deforested area is under agricultural use (following disturbance mainly with slash-and-burn practices) but in many areas, the land has been abandoned and frequently supports forests at different stages of regeneration [14]. Several estimates of the deforested land occupied with regeneration have been generated, mainly from interpretation of remote sensing data, but also using transition modeling. Data from the National Oceanic and Atmospheric Administration (NOAA) Advanced Very High Resolution Radiometer (AVHRR) from 1988–1991 were used by Stone et al., 1994 [15] to generate a land
cover map of South America, and subsequently Schroeder and Winjum, 1995 [16] used this dataset to estimate the extent of forest regeneration in the BLA at,1516103km2. Fearnside, 1996 [17], using a matrix of annual transition probabilities, estimated that approximately 48% (,1956103km2) of the deforested landscape in 1990 supported forest regeneration. Lucas et al., 2000 [18] using NOAA AVHRRR data estimated that ,1586103km2 supported some type of forest regeneration in the period 1991– 1994. Cardille and Foley, 2003 [19] used a matrix of annual transition probabilities to estimate that 36% (,916103km2) of the area deforested between 1980 and 1995 in the entire Amazon river drainage basin was in some stage of secondary succession forest. Carreiras et al., 2006 [20] exploited a time-series of 12 monthly composite images of the year 2000, derived from the
Satellite Pour l’Observation de la Terre(SPOT-4) VEGETATION sensor and estimated that, in 2000,,1406103km2of land was occupied by regenerating forests. Neeff et al., 2006 [21] used large-area land cover maps derived from remote sensing datasets to generate estimates of regrowth extent within the BLA and concluded that regrowth increased from,296103km2in 1978 to
[image:2.612.64.554.59.399.2],1616103km2 in 2002. Whilst providing information on the extent of regenerating forests at certain points in time, the dynamics of regenerating forests and the land on which they occupy has only been attempted using remote sensing by a few studies (e.g., [22]). However, such information is needed across large areas as regenerating forests may represent one of the prime
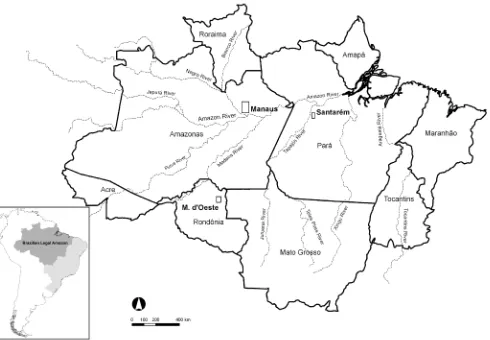
Figure 1. Location of the three study sites.Location of the three study sites: Manaus, Santare´m and Machadinho d’Oeste (M. d’Oeste), and the insertion (bottom left) of the Brazilian Legal Amazon (dark grey) in Brazil (light grey) and South American continent. Also shown are the major rivers included in the Amazon basin.
mechanisms by which biomass, biological diversity and ecosystem services can be restored [23–25].
The aim of this study was to establish the extent to which the age class distribution of regenerating forests was determined by the history of deforestation and subsequent use and management of the land, thereby giving insight into the potential for forest restoration and conservation into the future. This was achieved by comparing Landsat sensor data classified into the broad amalgamated categories of mature forest, non-forest (i.e.,
agricul-ture, including stock pasture) and secondary forest over decadal periods and time-separated by a maximum of four years. Three study areas were chosen to perform the analysis: Manaus (Amazonas state), Santare´m (Para´ state) and Machadinho d’Oeste (Rondoˆnia state). Several measures were used to compare the three areas since the inception of widespread agricultural practices in the region (1970s for Manaus and Santare´m and 1980s for Machadinho d’Oeste) up to the present: Deforestation (conversion from mature forest to forest or from secondary forest to non-Table 1.Landsat Multi-spectral Scanner (MSS), Thematic Mapper (TM) and Enhanced TM (ETM+) data available for the three Amazonian sites.
Manaus (Path 231, Row 62) Santare´m (Path 227, Row 62) Machadinho d’Oeste (Path 231, Row 67)
Date1
Sensor Date1
Sensor Date1
Sensor
19730707 MSS 19840824 TM 19840617 TM
19770731 MSS 19850726 TM 19860810 TM
19780822 MSS 19860729 TM 19870712 TM
19790703 MSS 19870716 TM 19890717 TM
19830709 MSS 19880803 TM 19900618 TM
19850604 TM 19890822 TM 19910925 TM
19880815 TM 19900809 TM 19940816 TM
19890802 TM 19910711 TM 19950803 TM
19910808 TM 19931020 TM 19960704 TM
19920607 TM 19951010 TM 19970723 TM
19941019 TM 19960825 TM 19980624 TM
19950920 TM 19970727 TM 19990729 TM
19960720 TM 19980815 TM 20010803 TM
19990713 TM 19990903 TM 20030724 TM
20010827 ETM+ 20000905 TM 20050713 TM
20020830 ETM+ 20010916 ETM+ 20060716 TM
20030809 TM 20030829 TM 20070703 TM
20060716 TM 20050701 TM 20080806 TM
20070804 TM 20060805 TM 20090809 TM
20080806 TM 20070621 TM 20100625 TM
20090910 TM 20081130 TM 20110612 TM
20100727 TM 20090712 TM
20110831 TM 20100629 TM
1
[image:3.612.61.561.89.423.2]Date format is yyyymmdd. doi:10.1371/journal.pone.0104144.t001
Table 2.Error matrix obtained from the accuracy assessment of the 2007 land cover map of the Manaus site (MF – mature forest, NF – non-forest, SF – secondary forest).
Classified
Reference MF NF SF Total Omission error
MF 186 4 10 200 0.070
NF 8 185 7 200 0.075
SF 11 2 187 200 0.065
Total 205 191 204 600
Commission error 0.093 0.031 0.083
[image:3.612.62.557.601.712.2]forest) and regrowth rates (conversion from non-forest to regeneration), the age of secondary forest, the period of active land use prior to abandonment to regeneration, and the frequency of clearance. The study builds on that of Prates-Clarke et al., 2009 [38] in that the time-series was extended from 2003 to 2011 for Manaus and Santare´m and a new time-series was generated for Machadinho d’Oeste.
Study Areas
For all three sites (Manaus, Santare´m and Machadinho d’Oeste; Figure 1), the natural vegetation prior to disturbance was primary (undisturbed)terra firme(i.e., non-flooded) forest. In each case, the canopy heights averaged between 25 and 35 m, with emergent trees exceeding 50 m at the more productive sites (e.g., Manaus). Species diversity is also high, often exceeding 225 species ha21 [26], with an estimated mean above ground biomass of approximately 270 Mg ha21[27].
The first site, north of Manaus, the capital of Amazonas state, occupied an area of 5,042 km2(2u3391199S, 60u59799W, Figure 1) and included the Instituto Nacional de Pesquisas da Amazoˆnia (INPA) and the Smithsonian Institution (SI) Biological Dynamics of Forest Fragments Project (BDFFP) research sites (established in 1979) [28], the Adolfo Ducke and Walter Egler forest reserves, and other state and federal environmental protection areas. Significant deforestation began in the area following construction in the early 1970s of the BR-174 highway connecting Manaus with Boa Vista in Roraima. Most deforestation activity occurred either side of the highway, with this fuelled primarily by agricultural expansion. Recognition of the opportunity to study the impacts of clearance and forest fragmentation on biodiversity as well as ecosystem
services spurred the preservation of fragments of various dimen-sions (typically less than 2 km2) prior to felling of the surrounding tropical forest. Many of these fragments were, however, recon-nected because of rapid regrowth of forests following abandon-ment of many clearances from the mid-1980s onwards. Up until the present, a substantial amount of research has been conducted, with these informing future management strategies across the Amazon [28].
The second site (3u109599S, 54u5594299W) covered an area of 1,118 km2and was located approximately 80 km to the south of Santare´m, the second main city in the Para´ state (Figure 1). This study area is within the Tapajo´s National Forest, between the Tapajo´s River and the BR-163 highway connecting Santare´m to the state capital of Mato Grosso, Cuiaba´. This conservation unit was created in 1974 and has been recognized as a model for sustainable forest management, including logging activities, at levels ranging from individuals to communities (e.g., [29,30]). Compared to Manaus, forests are less dense with a mixed arrangement of broadleaves and palm trees such as Ac¸aı´ (Euterpe oleracea) and Babac¸u (Orbignya phalerata) being commonplace [31].
The third site (9u3295699S and 62u692799W) occupied an area of 1,780 km2 and was located mostly within the Machadinho d’Oeste municipality, Rondoˆnia state. This municipality originat-ed from the former Machadinho settlement project, deployoriginat-ed by the Brazilian federal government (through theInstituto Nacional de Colonizac¸a˜o e Reforma Agra´ria, INCRA) in 1982 as part of the POLONORDESTE Program [32]. As such, the majority of its inhabitants are dependent on agriculture for subsistence [33]. Open rain forest is the dominant vegetation type in the municipality [32]. According to data from the Brazilian Ministry NF – non-forest, SF – secondary forest).
Classified
Reference MF NF SF Total Omission error
MF 196 0 4 200 0.020
NF 0 198 2 200 0.010
SF 23 11 166 200 0.170
Total 219 209 172 600
Commission error 0.105 0.053 0.035
[image:4.612.63.558.88.199.2]The overall accuracy was 0.93. doi:10.1371/journal.pone.0104144.t003
Table 4.Error matrix obtained from the accuracy assessment of the 2010 land cover map of the Machadinho d’Oeste site (MF – mature forest, NF – non-forest, SF – secondary forest).
Classified
Reference MF NF SF Total Omission error
MF 200 0 0 200 0.000
NF 0 197 3 200 0.015
SF 19 37 144 200 0.280
Total 219 234 147 600
Commission error 0.087 0.158 0.020
[image:4.612.61.557.602.712.2]of the Environment (MMA), this site includes several conservation units, mainly extractive reserves, which were established in and after 1995.
The area of the Manaus site was approximately three to four times the size of the other two study areas for several reasons. Deforestation in Manaus started in the early 1970s and land conversion from primary forest to agriculture/pasture was much more scattered. By comparison, deforestation patterns were more concentrated at Santare´m (either side of and in proximity to a highway) and Machadinho d’Oeste (a planned settlement). A larger area was also selected to encompass older deforestation within the BDFFP study area and more recent clearing towards the city of Manaus, thereby allowing a wide range of LULCC processes to be captured.
At all three sites, much of the history of deforestation and land use has been captured by optical (primarily Landsat) sensors during the dry season, when cloud cover is minimal. In Manaus, a moderately strong dry season occurs between June and October [28], in Santare´m between May and October [34], and in Machadinho d’Oeste between April and November [32]. Rainfall is generally higher at Manaus (between 1,900 and 2,500 mm annually) and lower at Santare´m and Machadinho d’Oeste with an annual average of 2000 mm. The mean annual temperatures at the sites range from 25uC to 26uC [32,34,35]. The distribution of forests types is determined in part by the topography and geology. The topography is moderately flat (up to 160 m elevation) north of Manaus and is divided by a large number of waterlines. Soils are nutrient-poor (i.e., Oxisols), with these being typical of many across the Amazon basin [36]. The area south of Santare´m is also moderately flat, ranging from approximately 50 to 240 m, and consists of nutrient poor soils (i.e., Oxisols and Ultisols) [34,37]. The terrain is moderately undulated at Machadinho d’Oeste, ranging from approximately 90 to 370 m, and the dominant soil types are Alfisols, Oxisols, Ultisols, and Alluvial [32].
Data
For Manaus, Landsat Multi-spectral Scanner (MSS), Thematic Mapper (TM) and Enhanced Thematic Mapper Plus (ETM+) data were acquired between 1973 and 2011 (path 231, row 62; Table 1). The Landsat MSS data acquired between 1973 and 1983 were only available as hard-copy prints [38]. The remaining Landsat TM and ETM+scenes (1985 onwards) were provided in digital format from both INPE and the United States Geological Service (USGS).
In the previous study of Prates-Clark et al., 2009 [38], scenes acquired between 1985 and 2003 were used to study forest
regeneration in this area. In this study, the time-series was extended to 2011 using six additional annual scenes, which were relatively cloud free (,20%), or cloud was distributed in only certain areas of the image. In total, the time-series extended over an approximate 40-year period from 1973 (when the deforested area was minimal) to 2011. For Santare´m, Prates-Clark et al., 2009 [38] again used Landsat TM and ETM+imagery acquired between 1984 and 2003 (path 227, row 62), with most scenes unaffected by substantive cloud cover. The time-series was extended using Landsat TM data acquired for each year from 2005 to 2010. Coverage for 2011 was actively sought but no data with minimal cloud coverage were available. Whilst most changes at Santare´m were associated with deforestation for agriculture and pasture, extensive wildfires damaged the surrounding forests in 1992 and 1997. The last fire episode was associated with the 1997–1998 El Nin˜o Southern Oscillation (ENSO) event. The time-series classification for Machadinho d’Oeste had not been undertaken previously and so 21 new time-series digital images acquired between 1984 and 2011 were obtained from the USGS. Gaps in the time-series ranged from between one (70%) to approximately three years (5%). Cloud cover was minimal on all but two dates, although the vast majority of the deforested area was visible within these.
Methods
4.1. Image pre-processing
Landsat images acquired by the USGS were orthorectified and calibrated to units of spectral radiance (W m22 sr21mm21) and then calibrated to top of atmosphere (TOA) reflectance using calibration factors and equations provided by Chander et al., 2009 [39]. Images acquired by INPE were processed to TOA reflectance and geometrically corrected using Environment for Visualizing Images (ENVI) software (Exelis Visual Information Solutions, Boulder, CO, USA), a third order polynomial and a nearest neighbor transformation [38]. Each Landsat image was then subsetted to encompass the main area of deforestation and the intersection of all images in the time series.
4.2. Image classification
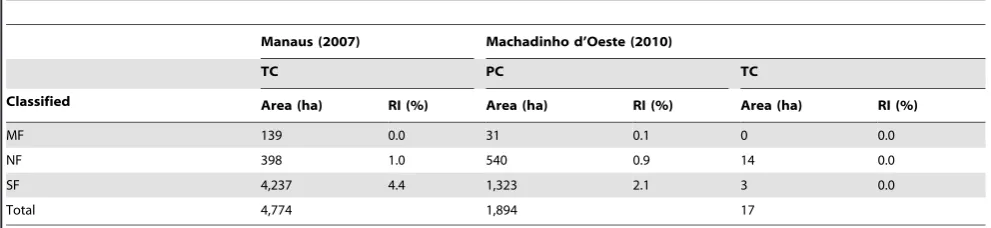
[image:5.612.61.557.89.203.2]As with Prates-Clark et al., 2009 [38], each digital image within the time-series for each site was classified into mature forest (MF), non-forest (NF), and secondary forest (SF), with the second category including crops (herbaceous and woody) and pastures. Areas of open water were also mapped and a common mask was applied to all dates in the time-series. Several classification approaches were utilized with the intention of providing the best Table 5.Area (ha) and relative incidence (RI, %) of perennial (PC) and tree (TC) crops with the mapped area of mature forest (MF), non-forest (NF) and secondary forest (SF).
Manaus (2007) Machadinho d’Oeste (2010)
TC PC TC
Classified Area (ha) RI (%) Area (ha) RI (%) Area (ha) RI (%)
MF 139 0.0 31 0.1 0 0.0
NF 398 1.0 540 0.9 14 0.0
SF 4,237 4.4 1,323 2.1 3 0.0
Total 4,774 1,894 17
classification of the desired categories. At Manaus, and for digital images acquired before 2006, supervised classifications based on the minimum distance or maximum likelihood algorithms were applied (e.g., [40]), with regions of interest representing the main cover types defined around a number of target areas described on the basis of field observations or through reference to very high resolution data. For the Landsat TM images acquired between 2006 and 2011, an object oriented classification (e.g., [41]) was followed and involved a decision-rule classification applied within the eCognition software (Trimble Geospatial Imaging, Munich, Germany). The rule base method used data from the available Landsat sensor bands as well as data layers derived from spectral indices, namely the Normalized Difference Vegetation Index (NDVI) and Normalized Difference Water Index (NDWI). The classification of MF was refined with a cloud-free mask of the MF area obtained through classification of the most-cloud-free and recent image in the time-series. Images acquired on the 31st August, 2011, 29th June, 2010 and 12th June 2011 were used to generate the MF mask, on the assumption that the land cover type had remained as MF for the whole of the time-series. If MF was covered by cloud in earlier images of the time-series, this was subsequently classified as MF. At Manaus, SF were older compared to the other sites and the structure of the upper canopy of the regenerating forests led to a spectral response in the near and shortwave infrared channels that was similar to MF; hence, reference to images earlier in the time-series was necessary [18,22,42]. At Santare´m, the Landsat data acquired between 1984 and 2003 were classified using a fuzzy logic approach that was applied to the original Landsat bands as well as derived fractional images (shade/moisture, vegetation and soil). Each pixel of the Landsat data acquired between 2005 and 2010 was classified into one of the three main land cover classes (described above) using the random forests machine learning classification algorithm (e.g., [43]) and training data. This algorithm has a number of options (e.g., [43]) that were tested for each date to obtain the best possible classifier. As with Santare´m, all Landsat TM dates for Macha-dinho d’Oeste were classified using the random forests algorithm. In all cases, the objective was to obtain the best classification of NF, MF and SF for each year of observation.
4.3. Post-classification
The comparison of the time-series of classified images (as MF, NF, or SF) identified several cases where some pixels classified as SF or NF in a given date were classified as MF in the following date. As this sequence is not plausible, in-house Interactive Data Language (IDL) code (Exelis Visual Information Solutions, Boulder, CO, USA) was written to identify these cases by comparing the classification over two consecutive dates. Where SF or NF areas were classified as such in one year and as MF in the next, the MF class was reallocated to SF. These areas were not reclassified as NF because it was assumed that spectral confusion between NF and MF was unlikely. This procedure was similar to that undertaken by Roberts et al., 2002 [44], who also considered ‘‘disallowed transitions’’ between cover types.
4.4. Deforestation and regrowth rates
Annual rates of change from MF (or SF) to NF (deforestation) and from NF to SF (regeneration) were calculated for consecutive
dates in the time-series using equations (1) and (2) [45]
r~ 1
t2{t1 lnA2
A1
ð1Þ
R~A1{A2
t2{t1
ð2Þ
where r and R are the annual rate of change expressed in percentage per year and hectares per year respectively;A1andA2 are the MF (or SF, in the case of deforestation occurring in regeneration areas) or NF cover areas (hectares) at timet1andt2 respectively (time period). These rates were used to characterize the temporal evolution of change across the three sites, to detect events (primarily clearance) and describe general trends.
4.5. Age of secondary forest, period of active land use, and frequency of clearance
Algorithms were written and implemented in IDL to compare the classifications of MF, NF, and SF between dates. Subsequently, datasets relating to the history and dynamics of land use, namely the age of secondary forest (ASF), the period of active land use (PALU) prior to abandonment, and the frequency of clearance (FC) were generated for each site and for each year in which an image had been acquired. The ASF was estimated by summing the time (in years) that each pixel was occupied by SF since the last clearance event. However, when SF occurs in the first date of the time series, and it is not subsequently cleared, the ASF can only be considered as a minimum age as the exact date of land abandonment is not known. The PALU was defined as the difference (in years) between the time of initial forest clearance and the onset of regeneration. However, where reclearance of regenerating forest had occurred, the PALU was calculated by summing the period since the last reclearance event until the forest cover had re-established. The FC was estimated by summing the frequency of transitions from MF (or SF) to NF. For both the Manaus and Santare´m study areas, fire scars were evident within some clearances by the lower near and shortwave infrared reflectance compared to the original vegetated surface [46]. However, many burned areas acquired a vegetated cover quite rapidly [47], and so only a partial fire history could be retained.
To better spatially represent and discuss the main results, classes of ASF, PALU, and FC were generated and used to assess their temporal evolution. Each metric was classified into three classes as to identify a lower, middle and upper interval range. However, these intervals do have some degree of subjectivity. ASF classes were defined as initial (#5 years), intermediate (6–15 years) and advanced ($16 years), adapted from Lucas et al., 2000 [18]. PALU classes were defined as short (#2 years), medium (3–4 years) and long ($5 years), with these representing various different crop or pasture cycles. FC classes were defined as low (1 time), medium (2 times) and high ($3 times), representing several land use patterns in terms of the frequency of the deforestation -. agriculture/pasture -. abandonment -. re-growth temporal sequence.
Figure 2. Land cover change (%) across the three selected sites.Land cover change (%) across the three selected sites; A) Manaus (1973– 2011), B) Santare´m (1984–2010), and C) Machadinho d’Oeste (1984–2011). Each dashed line represent the linear fit of the proportion of each land
cover class as a function of the year; also showing are the corresponding equations and coefficient of determination (R2).(#- mature forest,%-
non-forest,D- secondary forest).
time-series of classified images
The most recent very high resolution (VHR) imagery was used to carry out the accuracy assessment of the time-series classifica-tions at each site. As VHR data were not available to perform the accuracy assessment for all the classified images in the time-series, the accuracy in the classification of the image that was closest in time was assumed to be similar for the remaining images. To quantify the accuracy of the 2010 classification for Santare´m, reference was made to 5 m SPOT-5 panchromatic data from 2009 and 2011 whilst the 2007 and 2010 classifications for Manaus and Machadinho d’Oeste respectively were validated using GeoEye imagery available on Google Earth.
At each site, 200 random points located at the center of larger polygons (greater than 6 ha) were generated for each class. The points on the classification were compared with the VHR imagery from the same date. At Santare´m, it was assumed that if the same land cover was present in both the 2011 and 2009 image, the land cover in 2010 would be the same. The accuracy assessment was reported as a standard error matrix, including the overall accuracy and omission and commission errors (e.g., [48]). From the same VHR imagery and past field studies of the study sites (e.g., [32,38]), woody agriculture crops had established on some of the deforested areas. At Manaus, a large area of tree crops (TC, mainly oil palm) was progressively planted in the north west of the site from the 1983 to 1989, whilst at Machadinho d’Oeste, perennial crops (PC, mainly coffee plantations) were more common. To assess how well the areas of MF, NF and SF were discriminated using the classification, these areas were delineated manually from the VHR imagery and used in the generation of the error matrices.
The most straightforward way of estimating total areas for each class was to count the number of pixels in the MF, NF and SF classes with respect to the ground truth data. This is called ‘‘naı¨ve estimation’’ in the remote sensing literature [49]. As a matter of fact, areal estimates obtained this way are biased (e.g., [50]). Some post-classification methods have been used to improve these estimates, namely the so-called calibration techniques that are divided into classical and inverse methods. The information contained in the error matrix was used to correct for misclassi-fication bias [50]. Walsh and Burk, 1993 [50] carried out a simulation study and concluded that the inverse method consis-tently performed better than the classical method and lead to unbiased estimates for total areas. The idea behind this calibration technique was to use the misclassification probabilities among classes to revise the proportions given by pixel counting (pi) [51]. According to Tenenbein, 1972 [51] and Walsh and Burk, 1993 [50], the revised (calibrated) proportion of the total area occupied by classi(pi) can be estimated with equation (3)
pi~
Xk
j~1
fjzn:j
=N
nij=n:j
ð3Þ
Results
5.1. Accuracy assessment of land cover classification The error matrices resulting from the accuracy assessment over Manaus, Santare´m, and Machadinho d’Oeste are presented in Table 2, 3 and 4 respectively. For all three sites, the overall accuracy was high (above 0.90), although some relatively high omission and commission errors were identified, especially in Santare´m and Machadinho d’Oeste. For Manaus, the omission and commission errors were always below 10%. For Santare´m, a higher omission error in the SF class was detected (17.0%), mainly due to misclassification as MF (11.5%), which reflects also in the high commission error in the MF class (10.5%). At Machadinho d’Oeste, a major source of error also comes from a high omission error in the SF class (28%), with this mainly being a consequence
of misclassification as NF (18.5%) and to a lesser extent as MF (9.5%); a high commission error was also observed in the NF class (15.8%), with this being due to misclassification with SF.
[image:11.612.64.557.89.550.2]In Manaus, TC (4,774 ha) was mostly incorrectly classified as SF (89%), illustrating the similarity in their spectral signatures, but accounted only for 4.4% of the SF area in 2007 (Table 5). However, most of the TC classified as SF in Manaus was associated with the oil palm plantation situated in the north west of the study site. The majority of TC in Machadinho d’Oeste was correctly classified as NF, although the overall area was very small (17 ha). Conversely, 70% of the PC (mainly coffee plantations) at Machadinho d’Oeste was misclassified as SF, although this only accounted for 2.1% the entire SF area in 2010.
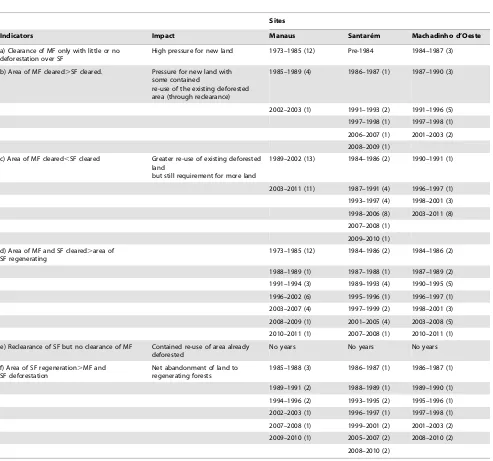
Table 10.An assessment of the dynamics of land use at Manaus, Santare´m and Machadinho d’Oeste (figures in brackets represent the number of years).
Sites
Indicators Impact Manaus Santare´m Machadinho d’Oeste
a) Clearance of MF only with little or no deforestation over SF
High pressure for new land 1973–1985 (12) Pre-1984 1984–1987 (3)
b) Area of MF cleared.SF cleared. Pressure for new land with
some contained
re-use of the existing deforested area (through reclearance)
1985–1989 (4) 1986–1987 (1) 1987–1990 (3)
2002–2003 (1) 1991–1993 (2) 1991–1996 (5)
1997–1998 (1) 1997–1998 (1)
2006–2007 (1) 2001–2003 (2)
2008–2009 (1)
c) Area of MF cleared,SF cleared Greater re-use of existing deforested
land
but still requirement for more land
1989–2002 (13) 1984–1986 (2) 1990–1991 (1)
2003–2011 (11) 1987–1991 (4) 1996–1997 (1)
1993–1997 (4) 1998–2001 (3)
1998–2006 (8) 2003–2011 (8)
2007–2008 (1)
2009–2010 (1)
d) Area of MF and SF cleared.area of
SF regenerating
1973–1985 (12) 1984–1986 (2) 1984–1986 (2)
1988–1989 (1) 1987–1988 (1) 1987–1989 (2)
1991–1994 (3) 1989–1993 (4) 1990–1995 (5)
1996–2002 (6) 1995–1996 (1) 1996–1997 (1)
2003–2007 (4) 1997–1999 (2) 1998–2001 (3)
2008–2009 (1) 2001–2005 (4) 2003–2008 (5)
2010–2011 (1) 2007–2008 (1) 2010–2011 (1)
e) Reclearance of SF but no clearance of MF Contained re-use of area already
deforested
No years No years No years
f) Area of SF regeneration.MF and
SF deforestation
Net abandonment of land to regenerating forests
1985–1988 (3) 1986–1987 (1) 1986–1987 (1)
1989–1991 (2) 1988–1989 (1) 1989–1990 (1)
1994–1996 (2) 1993–1995 (2) 1995–1996 (1)
2002–2003 (1) 1996–1997 (1) 1997–1998 (1)
2007–2008 (1) 1999–2001 (2) 2001–2003 (2)
2009–2010 (1) 2005–2007 (2) 2008–2010 (2)
2008–2010 (2)
5.2. Land cover change
The evolution of land cover change in Manaus, Santare´m and Machadinho d’Oeste is depicted in Figure 2A, 2B and 2C respectively and in Table 6, which shows that the most rapid change occurred in Machadinho d’Oeste, followed by Santare´m and Manaus. For all sites, there was a strong correspondence between the land cover percentage and time (year) for the MF class, with the rate decreasing by an average of 0.54% in Manaus to 1.39% in Santare´m and 2.33% in Machadinho d’Oeste. For all sites, a corresponding increase in the area deforested occurred, with the land cover alternating between NF and SF in all cases. The change rate in the NF class increased from 0.09% (Manaus) and 0.38% (Santare´m) to 1.29% (Machadinho d’Oeste) whilst the SF change rate progressively increased from Manaus (0.45%) to Santare´m (1.02%) and Machadinho d’Oeste (1.04%). The
relationships between the proportion (%) of MF, NF and SF and time (year) were significant at all sites (P,0.001).
5.3. Deforestation and regrowth rates
[image:12.612.75.541.64.506.2]Tables depicting relative and absolute deforestation and regeneration rates between consecutive dates for Manaus, Santare´m and Machadinho d’Oeste are presented as Supporting Information (Table S1, S2 and S3 respectively in File S1) and a summary is given in Tables 7, 8 and 9 respectively. The maximum relative annual rate of deforestation over MF was observed at Santare´m, with a 15.6% yr21loss between 1997 and 1998, with this associated with the extensive wildfires in 1997, and the highest average annual rate of deforestation was in Machadinho d’Oeste (3.9% yr21). The maximum relative rates of SF clearance were in Machadinho d’Oeste (88.1% yr21, 1990–1991) and Santare´m
Figure 3. Maps displaying the age of secondary forest (ASF, years) across the three selected sites.Maps displaying the age of secondary forest (ASF) across the three selected sites for areas undergoing secondary forest (SF) in the last year of the corresponding time-series; A) Manaus (2011), B) Santare´m (2010), and C) Machadinho d’Oeste (2011).
(82.3% yr21, 1987–1988), with average rates being 19.5% and 16.7% for these sites respectively. The maximum and the highest average relative rates of regeneration were observed at Santare´m, with 261.5% yr21(1997–1998) and 78.5% yr21respectively. The lowest relative rates of regrowth were at Machadinho d’Oeste, with these averaging 25.8% yr21. The average overall relative deforestation rates (combined MF and SF) were greatest for Machadinho d’Oeste (7.2% yr21), followed by Santare´m (4.9% yr21) and Manaus (1.4% yr21). On average, deforestation rates over SF were higher than those over MF, indicating reclearance at all sites and particularly Machadinho d’Oeste (averaging 19.5% yr21) and Santare´m (averaging 16.7% yr21).
Absolute areas (annual or based on periods of observation) are useful when comparing deforestation and regeneration rates
between sites and the processes of change. Several key indicators are then listed in Table 10 together with the dates for each site to which these apply. For all sites, a trend from indicators a) to f) was observed with the majority being cleared initially, regenerating forests progressively establishing with these then recleared to varying degrees, and, of these, several are then abandoned to regrowth again.
5.4. Age of secondary forest (ASF), period of active land use (PALU), and frequency of clearance (FC)
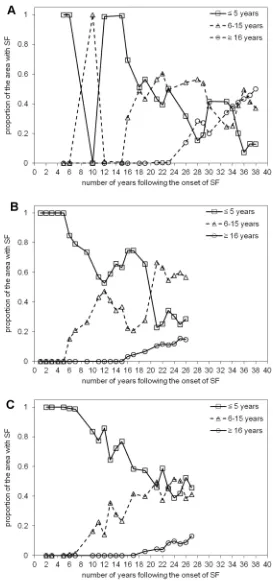
[image:13.612.69.546.63.515.2]Maps of the ASF, PALU, and FC for the last date of the time-series are presented in Figures 3, 4 and 5 for Manaus (2011), Santare´m (2010) and Machadinho d’Oeste (2011) respectively and the proportion of areas with respect to these classes is indicated in
Figure 4. Maps displaying the period of active land use (PALU, years) across the three selected sites.Maps displaying the period of active land use (PALU, years) across the three selected sites for areas undergoing secondary forest (SF) in the last year of the corresponding time-series; A) Manaus (2011), B) Santare´m (2010), and C) Machadinho d’Oeste (2011). An area of 667 ha (1.5%) with a PALU of zero in the Santare´m site
was included in the short PALU class (#2 years) and corresponds to areas that were SF from 1984 to 2010.
Figure 6. At Manaus, regrowth forests were comparatively older, with 50% occupied by forests $16 years (Figure 6A). At Santare´m, 57% of forests were aged 6–15 years, and at Machadinho d’Oeste, the majority of the area occupied by SF aged #5 years (46%). Hence, the three sites contain different distributions of age classes, with this attributable to differences in the time since deforestation but also the PALU and the frequency of clearance events. At all sites, the majority of land has been used actively for #2 years (Figure 6B), either following the initial clearance of the primary forest or subsequent reclearance events, but the deforestation had commenced at different times. At Manaus, the PALU was also#2 years for over 64% of the area and many of the forests had been able to regenerate undisturbed,
with some approaching 40 years in 2011, and had been cleared mainly on one (65%) occasion (Figure 6C). At Santare´m, 88% of the area under regrowth had been used actively for#2 years prior to the last abandonment and the majority (53%) cleared only once. At Machadinho d’Oeste, the PALU was typically#2 years (75%), and again, forests were relatively young because most of the clearance occurred only on one (57%) occasion. Hence, different typologies of SF were observed at each site.
[image:14.612.74.534.58.507.2]As a result of combining the 3-class PALU and FC maps for the last date of the time-series, a proxy for land use intensity in each site was generated (Table 11). At Manaus, of the 65% of land occupied by SF in 2011 that was subjected to only one clearing event, 41% had a short PALU but a significant proportion (16%
Figure 5. Maps displaying the frequency of clearance (FC) across the three selected sites.Maps displaying the frequency of clearance (FC) across the three selected sites for areas undergoing secondary forest (SF) in the last year of the corresponding time-series; A) Manaus (2011), B) Santare´m (2010), and C) Machadinho d’Oeste (2011). In Manaus, Santare´m and Machadinho d’Oeste an area of 103 ha (0.1%), 726 ha (1.6%), and 55 ha (0.1%), respectively, with a PALU of zero was included in the low FC class (1 time) and corresponded to areas that were non-forest (NF) in the first date of the time-series and no clearance has occurred in the secondary forest (SF) that persisted until the end of the time-series. In Santare´m, the 726 ha also included areas that were already SF in 1984 that persisted until 2010.
and 9%) had a medium and long PALU respectively. Santare´m is paradigmatic, as almost all land with SF in 2010 that was cleared only once was subjected to a short PALU. Assuming that a high FC and short and medium PALU will represent a higher land use intensity, then Manaus had 13% of the area undergoing SF in 2011 in these conditions, while Santare´m and Machadinho d’Oeste had 20% and 15% in 2010 and 2011 respectively.
To investigate whether these typologies were dependent on the last date of the time-series, the same analysis was performed for all the dates in the time-series. At Manaus, the proportion of the area with SF in the#5 year ASF class decreased irregularly with the onset of regeneration up to approximately 15% in the last date of the time-series (Figure 7A), with this pattern being mirrored for the 6–15 year ASF class, and the $16 year ASF class steadily increasing up to around 50% in 2011. At Santare´m (Figure 7B), the proportion of the area with SF in the initial ASF class decreased to around 30% in 2010, again mirrored by an overall increase to about 60% in the 6–15 year ASF class. As with Manaus, the proportion of the area with SF in the advanced ASF class increased from 15 years following the onset of regeneration to cover approximately 15% in 2010. In Machadinho d’Oeste (Figure 7C), the proportion of SF in the initial ASF class systematically decreased from the onset of regeneration leveling at around 45% in 2011, and an opposite pattern was observed in the intermediate ASF class, with a systematic increase since the onset of regeneration up to approximately 40% in 2011. As in Manaus and Santare´m, a steady increase in the proportion of area with regeneration in the advanced ASF class was observed, from 17 years after the onset of regeneration up to around 15% in 2011. By combining the initial and intermediate ASF classes, a more
consistent but asymptotic increase in the area of SF was observed, with this compensating for the interplay between these ASF classes, which occurs because of reclearance. The general trend across all sites is a decrease in the proportion of the area with SF in the initial ASF class up to the present, with a simultaneous increase in the proportion of the intermediate and advanced ASF classes. No asymptotic pattern is visible in the relationship between the proportion of the area with SF and the number of years following the onset of regeneration for this variable in the three selected sites. At Manaus, the proportion of areas with a short PALU was initially high (100%) but, over time, this area decreased to about 40% but then increased subsequently to 60%, where it remained constant 32 years from the onset of regeneration (Figure 8A). This decrease was associated with an increase in the area with a medium and long PALU (14–16 years after the onset of SF regeneration). At Santare´m (Figure 8B), the proportion with short PALU remained high, with this suggesting clearance of SF was common practice. The areas with medium and long PALU remained relatively low (,5–10%) but increased slightly towards the end of the time-series. At Machadinho d’Oeste, the temporal pattern was similar to that observed at Manaus; after 12–14 years, the proportion of short, medium and long PALU stabilized around 75%, 15% and 10% respectively.
The FC over areas undergoing SF also varied between sites (Figure 9). At Manaus, the SF had been cleared only once until about 14 years after the onset of SF, but this proportion decreased, stabilizing at approximately 65% in 2011. This occurred because SF began to be cleared again 15 years after the onset of regeneration and again after 19 years (i.e., 3 FC events), with these areas stabilizing at approximately 20% and 15% respectively. At of secondary forest (ASF), B) period of active land use (PALU), and C) frequency of clearance (FC) for the three sites, as a proportion of the area with
secondary forest (SF) in the last date of the time-series. The proportion of the area with SF in the first class of PALU (#2 years) in the Santare´m site
includes a small proportion (1.5%) corresponding to areas of SF persisting in all dates of the time-series. The proportion of the area with SF in the first class of FC (1x) in Manaus, Santare´m and Machadinho d’Oeste includes a small percentage (0.1%, 1.6%, 0.1%, respectively) corresponding to those cases where non-forest (NF) was observed in the first date of the time-series and no clearance has occurred (i.e., the only transition was from NF to SF).
[image:16.612.62.553.499.723.2]doi:10.1371/journal.pone.0104144.g006
Table 11.Percentage of area with SF in the last date of the time-series, per combination of PALU and FC classes.
PALU (classes) FC (classes) Total
Manaus Low (1x) Medium (2x) High ($3x)
Short (#2 years) 41 13 10 64
Medium (3–4 years) 16 5 3 24
Long ($5 years) 9 2 1 12
Total 66 20 14
Santare´m Low (1x) Medium (2x) High ($3x)
Short (#2 years) 51 20 17 88
Medium (3–4 years) 1 1 3 5
Long ($5 years) 0 2 5 7
Total 52 23 25
Machadinho d’Oeste Low (1x) Medium (2x) High ($3x)
Short (#2 years) 48 17 11 75
Medium (3–4 years) 5 7 4 16
Long ($5 years) 4 4 1 9
Total 57 28 16
Figure 7. Proportion of the area with secondary forest (SF) as a function of the number of years following the onset of SF for the three classes of age of secondary forest.Proportion of the area with secondary forest (SF) as a function of the number of years following the
onset of SF for the three classes of age of secondary forest (ASF) in A) Manaus, B) Santare´m, and C) Machadinho d’Oeste: initial,#5 years;
intermediate, 6–15 years; advanced,$16 years.
Figure 8. Proportion of the area with secondary forest (SF) as a function of the number of years following the onset of SF for the three classes of period of active land use.Proportion of the area with secondary forest (SF) as a function of the number of years following the
onset of SF for the three classes of period of active land use (PALU) in A) Manaus, B) Santare´m, and C) Machadinho d’Oeste: short,#2 years; medium,
3–4 years; long,$5 years.
Figure 9. Proportion of the area with secondary forest (SF) as a function of the number of years following the onset of SF for the three classes of frequency of clearance.Proportion of the area with secondary forest (SF) as a function of the number of years following the onset of SF for the three classes of frequency of clearance (FC) in A) Manaus, B) Santare´m, and C) Machadinho d’Oeste: low, 1 time; medium, 2 times;
high,$3 times.
Santare´m, SF was cleared within 2–4 years from the onset of regeneration and continually thereafter. This was reflected in the increase in the proportion of SF areas cleared twice (after 4 years) and three times (after 7 years) with these both stabilizing at approximately 20%. At Machadinho d’Oeste, the proportion of areas with only a clearing event decreased to 55% 28 years after the onset of regeneration. The medium and high FC classes commenced after 4 years and 7 years respectively with the proportions of these remaining relatively constant (25% and 15%).
Discussion
6.1. Accuracy assessment of the land cover time-series Several studies carried out in the Amazon have acknowledged some issues in discriminating SF from MF and, sometimes, NF. Lucas et al., 2000 [18] reported omission and commission errors ranging from 55–75% and 51–76%, respectively, associated with a greater confusion between NF and SF rather than between MF and SF. Carreiras et al., 2006 [20] reported an omission and commission error in the SF class of 66% and 43%, respectively, due to confusion between the SF, MF and NF classes. These authors concluded that misclassification among SF, MF, and NF was understandable, since from a spectral standpoint, SF is a transitional class between NF (i.e., agriculture/pasture) and MF. The initial stages of regeneration are spectrally similar to agriculture/pasture. Conversely, final stages of regrowth are more related to MF. The values reported in the two previous studies are much higher than those from this study, and that could be associated with the spatial resolution of the datasets that were used:
,1-km SPOT 4 VEGETATION and NOAA AVHRR vs. the 30-m spatial resolution Landsat TM and ETM+ data. The spatial arrangement of SF in the BLA, dominated by small previously abandoned areas, especially in Rondoˆnia (e.g., [52]), creates an additional difficulty when trying to discriminate these from the surrounding land cover classes with coarse spatial resolution data. Kimes et al., 1999 [53] used 20-m spatial resolution SPOT High Resolution Visible (HRV) data between 1986 and 1994 to
discriminate MF, NF and SF in Rondoˆnia and reported an accuracy of 95% in the SF class with misclassification happening mostly with the MF class. Metzger, 2002 [54] used Landsat TM data over the Bragantina region (Para´ state) in 1996 to map various land cover classes and reported omission and commission errors in SF age classes ranging from 8–11% and 7–10%, respectively, with misclassification occurring mainly from confu-sion with MF. Vieira et al., 2003 [55] used Landsat 7 ETM+data to map different stages of SF in Sa˜o Francisco do Para´ (northeastern Para´ state) and reported omission and commission errors between 17–25% and 22–40% respectively, due mainly to misclassification among SF stages. Kuplich, 2006 [56] used Landsat TM and Synthetic Aperture Radar (SAR) data to discriminate various land cover classes in Manaus (included the BDFFP) and reported omission and commission errors in the SF age classes of 10–99% and 32–80% respectively, but those errors decreased when the SF age classes were aggregated into a unique class (78% and 25%, respectively). Although errors are still high in some studies (e.g., [18,20,56]), others have been able to discriminate SF from MF and NF with a high degree of accuracy (e.g., [53–55]).
[image:20.612.127.486.60.290.2]Prates-Clark et al., 2009 [38] validated the 1995 and the 2001 land cover maps over Manaus and Santare´m respectively using field-based reference data. For the validation of the 1995 land cover map over Manaus, field data collected in 1995 were used [22,42] and the authors reported an overall accuracy of,99%, with omission errors in the MF, NF and SF classes of 0.3%, 3.5% and 1.9%, respectively, and commission errors of 0.5%, 7.0% and 9.5%, respectively. The major source of error in the SF class (higher commission error) was misclassification as MF class. At Santare´m, field data collected in 2002 [57] were used to validate the 2001 land cover map. The overall accuracy was 88%, the omission errors were 2.2%, 1.1% and 4.2% for the MF, NF and SF classes respectively, and the commission errors were 0.6%, 28.8% and 71.9% respectively. The particularly high commission error in the SF class was essentially the consequence of misclassification as MF. The NF class displayed a high commission
Figure 10. Deforestation rates in the Amazonas, Para´ and Rondoˆ nia states according to INPE, 2013[13].Deforestation rates since 1988
(ha yr21) in the Amazonas, Para´ and Rondoˆnia states according to the data reported by INPE, 2013 [13].
error that was related to misclassification as both MF and SF. Higher errors indicated in Prates-Clark et al., 2009 [38] for the Santare´m site were also depicted in our accuracy assessment of the 2010 land cover map, although of much lower magnitude.
A major limitation of the accuracy assessment carried out in this study it that only one date (classification) of each time-series per study area was validated with very high spatial resolution data. Nevertheless, a 10-fold cross-validation procedure was implement-ed for those dates classifiimplement-ed with the random forests algorithm, i.e., the 21 Landsat TM images of the Machadinho d’Oeste time-series (1984–2011) and the post 2003 Santare´m Landsat TM images (2005–2010). In Machadinho d’Oeste, the average overall accuracy was,98%, the omission errors of the MF, NF and SF classes ranged from 0.0–4.4%, 0.0–2.1% and 0.7–7.6% respec-tively, and the commission errors were between 0.0–4.2%, 0.0– 0.3% and 1.7–7.1% respectively. At Santare´m, the 2005–2010 time-series of classified Landsat TM data resulted in an average overall accuracy of 95%, the omission errors of the MF, NF and SF classes ranged between 1.8–6.7%, 0.0–0.9% and 8.1–16.7%, respectively, and the commission errors were between 3.7–7.5%, 0.0–0.6% and 4.1–13.2% respectively. Both the omission and commission errors of the NF class were very low, thus indicating that the major source of error of the SF class was misclassification as MF.
6.2. Differences of land cover change patterns among sites
Extensive deforestation across the BLA started in the 1970s and was concentrated along the southern and eastern rims of the region [58]. The main deforestation drivers were conversion of forest to cropland and/or cattle ranching, which were carried out both by small farmers and large landholders [59]. According to the data provided by INPE, 2013 [13], the states where the three sites are located displayed different deforestation rates (Figure 10). Deforestation rates were always higher in Para´, followed by Rondoˆnia and Amazonas. However, since 2003–2005, deforesta-tion rates have been decreasing, with Rondoˆnia experiencing a rapid decrease leading to values closer to those observed in the Amazonas state. Several factors contributed to this decline, namely the improvement of market-driven environmental governance [60]. Para´ experienced the highest number of settled families by agrarian reform in the nine states composing the BLA (,31,000 settled families per year in the period 2003–2006), and the number has been increasing since the 1960s [61]. Although the vast majority of deforestation in the BLA can be tracked to large landholders occupying the land for cattle ranching, the imple-mentation of planned settlements is not negligible at all, especially in Rondoˆnia, which is known by its small farmers’ radial, fishbone and watershed deforestation patterns (e.g., [58]). For example, up to the mid-1990s, the number of settled families in Rondoˆnia was only second to Para´, with 1,423 settled families per year against 1,462 settled families per year in Para´ [61].
The three study areas have different socio-economic drivers leading to deforestation, different land uses and subsequent regeneration. The Manaus site is mostly included in the Manaus municipality, although 24% is also included in the Rio Preto da Eva municipality. This study area basically encompasses several environmental protection areas. As such, it seems that these conservation areas have been critical at preserving most of the forest in the region. The conservation units (CUs) limits accessed from the Brazilian Ministry of the Environment (MMA, available at http://mapas.mma.gov.br/i3geo/datadownload.htm) were used to estimate the ratio of relative incidence of deforestation (NF and SF) outside and inside the CUs in the last date of the
time-series for each site. The three sites had a significant proportion of the area included in the CUs: 43% in Manaus, 37% in Santare´m and 23% in Machadinho d’Oeste. In Manaus, the relative incidence of deforestation outside the CUs was twice that inside CUs and in Santare´m and Machadinho d’Oeste that value increased to five times. In fact, several studies have concluded that protected areas in the Amazon region are indeed effective at reducing deforestation rates (e.g., [60,62,63]). Figure 2A illustrates the lower amount of land cover change in Manaus, with approximately 20% of MF lost between 1973 and 2011, when compared with Santare´m (more than 30% of MF lost between 1984 and 2010) and Machadinho d’Oeste (,40% of MF lost between 1984 and 2011). Deforestation in the Manaus study area started in the 1970s, with the construction of the BR-174 highway connecting Manaus and Boa Vista. Early deforestation is traceable along this highway, but many areas were abandoned as a result of poor soil fertility; indeed, many small farmers moved to Roraima, which was considered to have younger fertile soils [64]. The area of forest in 2011 was approximately 69% and 81% of the territory of the Manaus and Rio Preto da Eva municipalities respectively [13]. Figure 2A shows that the proportion of MF in the Manaus site decreased from approximately 90% in 1973 to 71% in 2011, which is similar to the value reported by INPE, 2013 [13] for the Manaus municipality.
The Santare´m site is located south of the city of Santare´m, in the Belterra municipality, along the BR-163 highway, and including part of the Tapajo´s National Forest. This highway links Santare´m and Cuiaba´ in the south. According to Scatena et al., 1996 [65] and Brondizio and Moran, 2012 [66], this region has a tradition of agriculture and agroforestry since the early 1900s, which has further escalated as a consequence of the construction of the BR-163 in the 1970s. In fact, of the three sites Santare´m had the lowest proportion of MF at the beginning of the time-series (,80%) and the highest proportion of SF (,20%), thus suggesting that deforestation was commonplace in the area in the early 1980s. According to INPE, 2013 [13], approximately 68% of the forest area in the Belterra municipality was remaining in 2011, whereas we report a proportion of MF in 2010 of 46%. A vast majority of the Belterra municipality is included in the Tapajo´s National Forest, mainly the part that is west of the BR-163 highway. So, it is not surprising that the proportion of remaining forest in this municipality is higher than the proportion of remaining forest in the study area that includes the fraction east of the BR-163 highway that is not a protected area.
deforested areas of Machadinho d’Oeste. In 1988, approximately 2% was covered by SF, the value increasing to approximately 13% in 1998; our study mapped SF in 1987 and 1998 and the proportion was ,13% and ,29% respectively. Again, when considering the entire Machadinho d’Oeste municipality, there are extensive areas to the north and east of the study area that remained intact, with these covered by MF. Nevertheless, there is a coincident temporal trend that is the increase of SF from 1988 to 1998.
6.3. Land abandonment and the emergence of secondary forest
Land abandonment in the BLA is a consequence of a range of factors that have changed across the last decades since the inception of large scale deforestation in the region. Namely these are; reduced crop productivity as a consequence of poor soil fertility; lack of financial incentives, migratory patterns; non-traditional land uses and market fluctuations [67]. At Manaus, in 2011, land abandonment resulted in SF that was comprised mainly of areas with advanced ASF (50% $16 years), although large areas of intermediate ASF (37% between 6–15 years) were also present (Figure 3A and Figure 6). This suggests that the conservation areas were not only effective at preserving MF but also SF areas. As mentioned before, deforested areas in this study area were abandoned mainly because of poor soil fertility, with settlers moving to the nearby state of Roraima [64]. It is clear from Figure 3A that the higher proportion of advanced ASF in the study area is in the northern half of the site. These areas undergoing regeneration in 2011 had mostly short PALU (64%) as a consequence of intensification of land use and requirement for new land, and 65% was deforested only once. In comparison, the Santare´m site, which included parts of the Tapajo´s National Forest, had regrowth dominated by intermediate ASF in 2010. Those areas experienced essentially short PALU (88%#2 years) and low FC (52% deforested once). According to Brondizio and Moran, 2012 [66], land abandonment in the region, and associated regeneration, was high until 1999. At this point, large-scale soybean cultivation started, mainly because of the decay of primary and secondary roads, lack of social services, and limited access to water. On the other hand, land abandonment in Machadinho d’Oeste resulted in SF that was mainly in the initial (46%) and intermediate (41%) ASF classes, with these areas experiencing mostly (75%) short PALU and low FC (57%). This was a planned settlement and most of the deforested area is under agriculture and or pasture use, suggesting that a vast majority of the area undergoing SF could be indeed forest fallow that might be under cattle ranching use or being subjected to subsistence agriculture in a crop/fallow cycle [66].
One important aspect worth mentioning is the large proportion of SF in the Santare´m site that resulted from the 1997 wildfires. This area of regeneration was not the consequence of land abandonment but a natural process following fire-induced disturbance. This wildfire was just one among many others that occurred in the BLA as a consequence of the 1997–1998El Nin˜o
Southern Oscillation (ENSO) event (e.g., [68]). In fact, the proportion of NF in 1997 (prior to the wildfire) was around 6% and in 1998 had increased to approximately 15%, mainly as a consequence of that large wildfire, perfectly visible in Figure 3B as the orange irregular zone of intermediate ASF in the centre of the study area. As a consequence of the natural regeneration process, the SF proportion increased to approximately 44% in 2000 (,32% in 1997). Therefore, approximately 20% of the area of SF
following that wildfire event.
6.4. Implications of prior land use for biomass
accumulation and biodiversity restoration in secondary forests
Regenerating forests in the three selected sites have been classified in terms of ASF, PALU prior to abandonment and FC. Prior LULCC practices have a fundamental influence on the vegetation regener-ating following land abandonment in the Amazon [10,22,69–75]. Vegetation structure, species composition and dominance are just some of the parameters of the regenerating vegetation that have been studied to identify the impact of prior land use practices (e.g., [76]). As such, these have an impact on the capability of these forests to accumulate biomass (and to act as a C sink at a greater or lesser extent) and to restore biodiversity (e.g., [77]).
Uhl et al., 1988 [71] studied areas undergoing secondary succession following pasture abandonment in Para´ (Paragominas municipality) and identified major patterns related to prior land use intensity; light use sites, characterized by a lower PALU (0–4 years) and with no reclearance or just one slash-and-burn episode, had high species richness dominated by pioneer species (e.g.,
Cecropiasp. andSolanumsp.), and a,13 m closed canopy with an AGB accumulation rate of 10 Mg ha21yr21(8-year old sites); comparatively, moderate use sites, having higher PALU (6–12 years) and with 1 to 5 clearing episodes, had lower species richness dominated by a 7–8 mVismiasp. partially developed canopy and an AGB accumulation rate of 5 Mg ha21yr21; heavy use sites, subjected to large-scale mechanized operations, had poor species richness (Solanum sp. and Cecropia sp.), mainly composed by scattered trees and an AGB accumulation rate of only 0.6 Mg ha21yr21. Mesquita et al., 2001 [75] studied regeneration pathways in a region north of Manaus that is included in our Manaus site (BDFFP) and identified major differences related to prior land use. Basically, areas that were deforested and abandoned immediately were dominated byCecropia spp. trees, whereas those that were abandoned after some years of pasture use were dominated byVismiaspp. trees. Lucas et al., 2002 [22], also identified two distinct regeneration pathways in a region north of Manaus and in the same way as Mesquita et al. [75]; the authors identifiedVismiaspp. dominated regeneration associated to sites with more intensive land use and those dominated byCecropia
Concluding Remarks
An accurate assessment of large-scale land use and land cover change dynamics over remote areas (e.g., Amazon) can only be carried out with an adequate monitoring system. Remote sensing data, in this case annual or quasi-annual time-series of high spatial resolution optical data (Landsat program), has proven its ability to accurately discriminate MF, SF and NF over three sites in the BLA experiencing several decades of deforestation. Lower deforestation rates and a greater proportion of intermediate and advanced ASF classes were characteristic of the Manaus site. On the other hand, Machadinho d’Oeste had the highest deforestation rates and lower regrowth rates, with most of its regeneration occurring in areas abandoned over the past 5 years. LULCC at Santare´m displayed an intermediate behavior, with intermediate deforestation rates and the highest regrowth rates, which lead to regeneration dominated by areas of intermediate ASF. Conservation units were effective at reducing deforestation at all three sites. The temporal evolution of the spatial arrangement of the various parcels of land identified as one of the three classes could provide new insights about the fragmentation patterns in the region (Ewers et al. 2013 [81]).
Although several generalizations about the type and composi-tion of secondary forest occurring in each of the three sites can be made, a correct assessment can only be made after an in situ
assessment. Therefore, the research presented here will provide the opportunity to assess the influence of previous LULCC dynamics on the biomass accumulation and biodiversity restora-tion and to further investigate hypothesis related to differences
among the three sites. A field campaign is foreseen for 2014 to collect forest inventory data that will be used to study the influence of prior LULCC on the capability of regrowth areas to accumulate AGB and to restore biodiversity. In the end, a framework related to the influence of prior LULCC on the biomass accumulation and biodiversity will be built and could be used to inform land management policies in the region.
Supporting Information
File S1 Relative and absolute deforestation and regen-eration rates between consecutive dates for Manaus, Santare´m and Machadinho d’Oeste.
(DOC)
Acknowledgments
The United States Geological Survey (USGS) and Brazil’s National Institute for Space Research (INPE) are particularly thanked for providing free access to the Landsat sensor data used in this study. Nathan Thomas (Department of Geography and Earth Sciences, Aberystwyth University, Aberystwyth, United Kingdom) is particularly acknowledged for reviewing earlier versions of the manuscript.
Author Contributions
Conceived and designed the experiments: JC RL. Performed the experiments: JC JJ RL CG. Analyzed the data: JC JJ RL. Contributed reagents/materials/analysis tools: JC JJ RL CG. Wrote the paper: JC JJ RL.
References
1. Falkowski P, Scholes RJ, Boyle E, Canadell J, Canfield D, et al. (2000) The global carbon cycle: A test of our knowledge of earth as a system. Science 290: 291–296.
2. Raupach M (2011) Pinning down the land carbon sink. Nature Climate Change 1: 148–149.
3. Heimann M, Reichstein M (2008) Terrestrial ecosystem carbon dynamics and climate feedbacks. Nature 451: 289–292.
4. Pan Y, Birdsey R, Fang J, Houghton R, Kauppi P, et al. (2011) A Large and Persistent Carbon Sink in the World’s Forests. Science 333: 988–993. 5. Gibson L, Lee T, Koh L, Brook B, Gardner T, et al. (2011) Primary forests are
irreplaceable for sustaining tropical biodiversity. Nature 478: 378–381. 6. Achard F, Eva H, Stibig H, Mayaux P, Gallego J, et al. (2002) Determination of
deforestation rates of the world’s humid tropical forests. Science 297: 999–1002. 7. Hooper D, Adair E, Cardinale B, Byrnes J, Hungate B, et al. (2012) A global synthesis reveals biodiversity loss as a major driver of ecosystem change. Nature 486: 105–108.
8. Lederer M (2011) From CDM to REDD+2What do we know for setting up effective and legitimate carbon governance? Ecological Economics 70: 1900– 1907.
9. Olson D, Dinerstein E, Wikramanayake E, Burgess N, Powell G, et al. (2001) Terrestrial ecoregions of the worlds: A new map of life on Earth. Bioscience 51: 933–938.
10. Chazdon RL (2003) Tropical forest recovery: legacies of human impact and natural disturbances. Perspectives in Plant Ecology Evolution and Systematics 6: 51–71.
11. Cardinale B, Duffy J, Gonzalez A, Hooper D, Perrings C, et al. (2012) Biodiversity loss and its impact on humanity. Nature 486: 59–67.
12. Goulding M, Barthem R, Ferreira EJG (2003) The Smithsonian atlas of the Amazon. Washington, D.C.: Smithsonian Books. 253 p.
13. INPE (2013) Projeto PRODES: Monitoramento da Floresta Amazoˆnica Brasileira por Sate´lite. Instituto Nacional de Pesquisas Espaciais. Available: http://www.obt.inpe.br/prodes/index.php. Accessed 11 March 2014. 14. Davidson EA, de Araujo AC, Artaxo P, Balch JK, Brown IF, et al. (2012) The
Amazon basin in transition. Nature 481: 321–328.
15. Stone TA, Schlesinger P, Houghton RA, Woodwell GM (1994) A map of the vegetation of South America based on satellite imagery. Photogrammetric Engineering and Remote Sensing 60: 541–551.
16. Schroeder PE, Winjum JK (1995) Assessing Brazil carbon budget: II. Biotic fluxes and net carbon balance. Forest Ecology and Management 75: 87–99. 17. Fearnside P (1996) Amazonian deforestation and global warming: Carbon stocks
in vegetation replacing Brazil’s Amazon forest. Forest Ecology and Management 80: 21–34.
18. Lucas RM, Honzak M, Curran PJ, Foody GM, Milne R, et al. (2000) Mapping the regional extent of tropical forest regeneration stages in the Brazilian Legal Amazon using NOAA AVHRR data. International Journal of Remote Sensing 21: 2855–2881.
19. Cardille J, Foley J (2003) Agricultural land-use change in Brazilian Amazonia between 1980 and 1995: Evidence from integrated satellite and census data. Remote Sensing of Environment 87: 551–562.
20. Carreiras JMB, Pereira JMC, Campagnolo ML, Shimabukuro YE (2006) Assessing the extent of agriculture/pasture and secondary succession forest in the Brazilian Legal Amazon using SPOT VEGETATION data. Remote Sensing of Environment 101: 283–298.
21. Neeff T, Lucas RM, dos Santos JR, Brondizio ES, Freitas CC (2006) Area and age of secondary forests in Brazilian Amazonia 1978–2002: An empirical estimate. Ecosystems 9: 609–623.
22. Lucas RM, Honzak M, Amaral ID, Curran PJ, Foody GM (2002) Forest regeneration on abandoned clearances in central Amazonia. International Journal of Remote Sensing 23: 965–988.
23. Fearnside PM (2000) Global warming and tropical land-use change: Greenhouse gas emissions from biomass burning, decomposition and soils in forest conversion, shifting cultivation and secondary vegetation. Climatic Change 46: 115–158.
24. Houghton RA (2005) Aboveground forest biomass and the global carbon balance. Global Change Biology 11: 945–958.
25. Silva JMN, Carreiras JMB, Rosa I, Pereira JMC (2011) Greenhouse gas emissions from shifting cultivation in the tropics, including uncertainty and sensitivity analysis. Journal of Geophysical Research-Atmospheres 116. doi:10.1029/2011JD016056.
26. Laurance S, Laurance W, Andrade A, Fearnside P, Harms K, et al. (2010) Influence of soils and topography on Amazonian tree diversity: a landscape-scale study. Journal of Vegetation Science 21: 96–106.
27. Saatchi S, Houghton R, Alvala R, Soares J, Yu Y (2007) Distribution of aboveground live biomass in the Amazon basin. Global Change Biology 13: 816–837.
28. Laurance WF, Camargo JLC, Luizao RCC, Laurance SG, Pimm SL, et al. (2011) The fate of Amazonian forest fragments: A 32-year investigation. Biological Conservation 144: 56–67.
29. van Gardingen PR, Valle D, Thompson I (2006) Evaluation of yield regulation options for primary forest in Tapajos National Forest, Brazil. Forest Ecology and Management 231: 184–195.