THE EFFECT OF SALINITY ON THE CONCENTRATIONS
OF RADIUM AND THORIUM IN SEDIMENTS
Gary J. Hancock (BSc, University of Adelaide)
A thesis submitted for the degree of Master of Science of the Australian National University
Department of Geology
' U B R A K ^ x y
Except where due acknowledgement is g iven, the contents o f t h i s t h e s i s is a l l my own work.
Abstract
The effect of salinity on the sorption behaviour of radium and thorium has been studied with the aim of assessing the suitability of the 226Ra/232Th activity ratio (AR) as a tracer in saline waters. Radium has been reported in the literature as being highly mobile in saline water, and easily desorbed from sediments, whereas thorium is believed to remain tightly bound. Results of analyses of bed sediments from an inland river system with a record of past regimes of high dissolved salt concentrations were consistent with this behaviour. Radium-226 activity in the bed sediments was shown to be deficient with respect to its parent, 23°Th, indicating a
loss of radium from the sediments.
A more detailed field study examined the extent of radium loss as a function of salinity in an estuary. Desorption of 226Ra from freshwater suspended sediment increased to a maximum value (58% ±7 of the total sediment concentration) as the salinity of the estuary rose. Maximum radium desorption was reached in the 6-10 ppt salinity range. Net desorption then remained unchanged despite further rises in salinity.
Laboratory experiments indicated that the kinetics of radium desorption is rapid, with maximum desorption from river sediments reached within 1 h of contact with saline water. The net radium loss from freshwater sediment occurs as a result of the competition effects from other dissolved cations for ion-exchange sites on the sediment. Cation exchange is probably the dominant mechanism of radium release, although alpha recoil appears to be at least partly responsible for the higher losses of 224Ra and 223Ra by
increasing their accessibility for ion-exchange reactions.
T h e r e was no e v i d e n c e of any net loss of t h o r i u m f r o m s e d i m e n t as s a l i n i t y is increased. In fact, l a b o r a t o r y e x p e r i m e n t s i n d icate that the t r a n s f e r of d i s s o l v e d or c o l l o i d a l t h o r i u m o n t o s e d i m e n t p a r t i c l e s is e n h a n c e d in s a l i n e water. F r o m the d i f f e r i n g s o r p t i o n b e h a v i o u r of r a d i u m and t h o r i u m it is c o n c l u d e d that the 2 2 6 R a / 2 3 2 Th AR is not a s u i t a b l e s e d i m e n t t r a c e r in s a l i n e water. H o w ever, t h e 2 3 ° T h / 2 3 2 Th AR can p r o v i d e a s t a b l e t r a c e r of s e d i m e n t m o v e m e n t in e s t u a r i e s and is t h e p r e f e r r e d s e d i m e n t t r a c e r in s a l i n e rivers. In s ome c i r c u m s t a n c e s the 2 2 8 R a / 2 2 6 Ra AR m a y a l s o be u s e f u l .
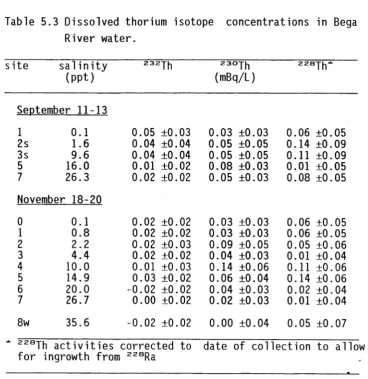
The d i s s o l v e d c o n c e n t r a t i o n s of all r a d i u m isotopes s how s t r o n g l y n o n - c o n s e r v a t i v e increases in the B e g a es t u a r y . The s h o r t e r - 1 ived
Acknowledgements
I a c k n o w l e d g e the s u p p o r t g i v e n by C S I R O D i v i s i o n of W a t e r R e s o u r c e s in terms of tim e and f a c i l i t i e s .
I w o u l d like to th a n k m y s u p e r v i s o r s , Dr. A. E g g l e t o n ( A u s t r a l i a n Na t i o n a l U n i v e r s i t y ) and Dr. G. T a y l o r ( U n i v e r s i t y of C a n b e r r a ) f o r th e i r a s s i s t a n c e t h r o u g h o u t the study.
M y c o l l e a g u e s at CSIRO, p a r t i c u l a r l y Jon O l l e y and Dr. A. M u r r a y p r o v i d e d c o n s t r u c t i v e c r i t i c i s m of the work. A n d r e w M u r r a y r e q u i r e s special than k s f o r s u g g e s t i n g the s u b j e c t of r e s e a r c h for this thesis, and f o r his w i l l i n g n e s s to p r o v i d e helpful a d v i c e a n d ideas on the i n t e r p r e t a t i o n of
the re s u l t s .
O t h e r st a f f at C S I R O als o p r o v i d e d a n a l y t i c a l s u p p o r t and h elp in the field. Rob S a g e m a n p e r f o r m e d A A S a n a l y s e s and CEC d e t e r m i n a t i o n s . Peter W a l l b r i n k h e l p e d wit h g a m m a s p e c t r o s c o p y . G r a e m e C h i l e s ai d e d w i t h s a mple c o l l e c t i o n at t h e L o d d o n R i v e r region, and G a r y C a i t c h e o n o p e r a t e d the e c h o - s o u n d e r in the B e g a River. T e c h n i c a l s u p p o r t w a s p r o v i d e d at the A.N.U. d e p a r t m e n t of G e o l o g y b y R o b i n W e s t c o t t , w h o p e r f o r m e d XRD a n a l y s e s .
Contents
1. Introduction ^ 1
1.1 Uranium and Thorium Decay Series 1
1.2 Radionuclides as Sediment Tracers 2
1.3 Thesis Aims and Structure 3
2. Literature Review 4
2.1 Thorium Chemistry 4
2.2 Radium Chemistry 5
2.3 The Partitioning of Radium and Thorium Between Solid and
Solution 6
2.4 Laboratory Sorption Studies 7
2.5 Estuarine Studies 11
2.6 Summary 13
3. Analytical Techniques 15
3.1 Alpha Spectrometry 15
3.2 Gamma Spectrometry 17
3.3 Liquid Scintillation 18
3.4 Atomic Adsorption Spectrophotometry 19
3.5 Sedimentation Analysis 19
3.6 Cation Exchange Capacity 20
3.7 X-Ray Diffraction Analysis 20
4. Sediment Tracing in a Saline Inland River System 21 4.1 The Loddon River-Barr Creek Confluence 21
4.2 Methods 22
4.3 Results and Discussion 22
5. The Behaviour of Radium and Thorium in an Estuary 28
5.1 Introduction 28
5.2 The Bega River Catchment 30
5.3 Sample Collection and Analyses 32
5.4 Water Quality Parameters 34
5.5 Dissolved Radionuclides 38
5.6 Radionuclides in Suspended Sediment 40
5.7 Bottom Sediments 50
5.8 Sources of Dissolved Radium to the Water Column 54
6. Labo r a t o ry Experiments 61
6.1 Introduction 61
6.2 Methods 63
6.3 Adsorption Experiments - Results and Discussion 67 6.4 Desorption Experiments - Results and Discussion 72
6.5 The Effect of Solid/Liquid Ratio 79
6.6 The Fraction of Sediment-bound Radium Available for
Exchange 80
6.7 Summary 83
7. Discussion and Conclusions 85
7.1 The Behaviour of Thorium in Saline Water 85 7.2 The Behaviour of Radium in Saline Water 85 7.3 Other Factors Influencing Radium Desorption 87
7.4 Implications for Sediment Tracing 90
7.5 Radium Isotopes as Tracers of Water Movement in an Estuary 91
7.6 Conclusions 92
List of F i g u r e s
1.1 The 2 3 8 U d e c a y s e r i e s 2
1.2 T h e 2 3 2 Th d e c a y s e r i e s 2
3.1 A typical t h o r i u m a l p h a - p a r t i c l e s p e c t r u m ( s e d i m e n t sample). 17 3.2 (a) Count r a t e as a f u n c t i o n of 2 2 6 Ra a c t i v i t y and
(b) its d e v i a t i o n f r o m linearity. 20 3.3 T h e effect of s a l i n i t y on the 2 2 6 Ra count rate. 20 4.1 The L o d d o n - B a r r C r e e k c o n f l u e n c e , sho w i n g the l o c a t i o n of
s a m p l i n g sites. 22
5.1 The Bega R i v e r c a t c h m e n t . 31 5.2 T h e Bega R i v e r e s t u a r y , s h o w i n g the location of s a m p l i n g
sites. 31
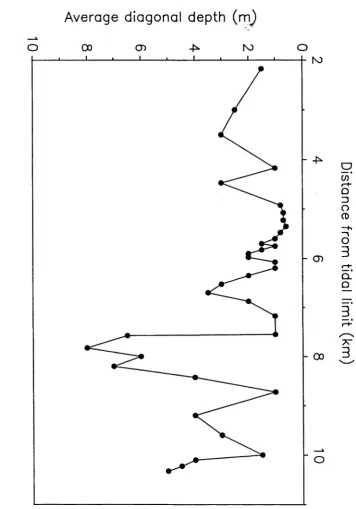
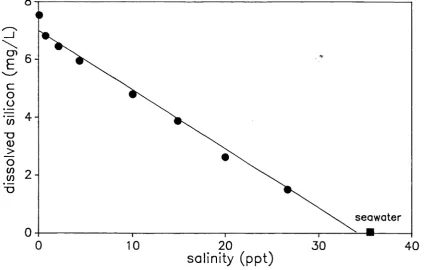
5.3 A depth p r o f i l e of t h e B ega R i v e r estuary. 32 5.4 D i s s o l v e d s i l i c o n a n d s a l i n i t y in the Bega R i v e r estuary. 37 5.5 D i s s o l v e d 2 2 6 Ra c o n c e n t r a t i o n s as a f u n c t i o n of s a l i n i t y in
the Bega R i v e r estuary. 37
5.6 E s t u a r i n e s u s p e n d e d s e d i m e n t c o n c e n t r a t i o n s of 2 3 2 Th as a
f u n c t i o n of salinity. 44
5.7 The 2 3 ° T h / 2 3 2 Th a c t i v i t y r a t i o of s u s p e n d e d s e d i m e n t p l o t t e d
a g a i n s t salinity. 44
5.8 The s u s p e n d e d s e d i m e n t 2 2 8 T h / 2 3 2 Th a c t i v i t y r a t i o and
s a l i n i t y ( N o v e m b e r d a t a only). 44 5.9 T h e s u s p e n d e d s e d i m e n t 2 2 6 R a / 2 3 2 Th a c t i v i t y r a t i o and
salinity. 46
5.10 The 2 2 8 R a / 2 2 6 Ra a c t i v i t y r a t i o and salinity. 46 5.11 The d i s s o l v e d c o n c e n t r a t i o n s of all r a d i u m i s otopes. 57 5.12 The d i s s o l v e d 2 2 8 R a / 2 2 6 Ra a c t i v i t y rat i o of s a m p l e s
c o l l e c t e d in S e p t e m b e r and N o v e m b e r 1991. 59 5.13 The d i s s o l v e d 224R a / 2 2 3 Ra a c t i v i t y rat i o of s u r f a c e w a t e r
List of Figures (contd.)
6.1 228Th d i s tr i b u ti o n coefficient (Kd) as a function of
s a l i n i t y in adsorption experiments. 69
6.2 Radium dis tr ib u ti o n coef fic ien t (Kd) as a function of
s a l i n i t y in adsorption experiments. 71
6.3 (a) RaF (see section 6.3.3) as a function of s a l i n i t y .
(b) An expansion of (a). 71
6.4 Desorption of radium isotopes and the ir a c t i v i t y ratios
as a function of time. 74
6.5 Desorption of radium isotopes and t he ir a c t i v i t y ratios
as a function of s a l i n i t y . 77
6.6 The desorption of 226Ra as a function of s a l i n i t y from two
d if f e re n t size fractions of Bega River sediment. 77
6.7 226Ra desorption (%) at 7 ppt s a l i n i t y from <63 /zm Bega River sediment plotted against the inverse of sediment
concentration. 81
6.8 The effect of repeated leaching on the % 226Ra desorbed from
<63/zm Bega River sediment. 81
7.1 An expansion of Figure 5.9, i l l u s t r a t i n g the approximate l i n e a r i t y between the 226Ra/232Th a c t i v i t y ra t io and
L i s t of Tables
4.1 Flow, co n d u c t iv it y and suspended sediment data f o r the
Loddon River and Barr Creek on the date of sample
c o l l e c t i o n . 23
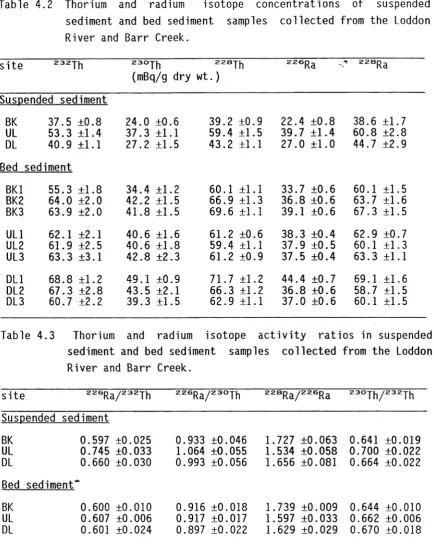
4.2 Thorium and radium isotope concentrations of suspended
sediment and bed sediment samples col lected from the Loddon
River and Barr creek. 25
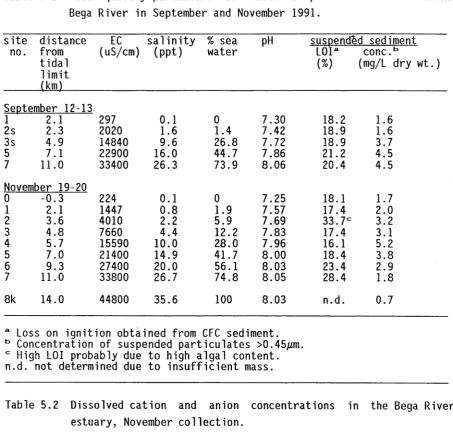
5.1 Water q u a l i t y parameters of water samples c o l l e c t e d from
the Bega River estuary. 35
5.2 Dissolved cation and anion concentrations in the Bega River
estuary. 35
5.3 Dissolved thorium concentrations in the Bega River estuary. 38
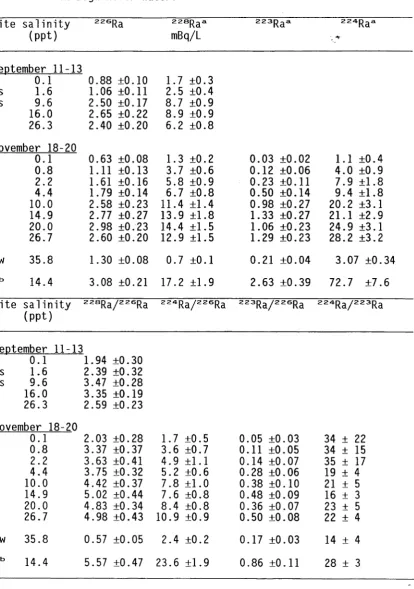
5.4 Dissolved radium isotope concentrations and a c t i v i t y r a t i o s
in the Bega River estuary. 41
5.5 Thorium and radium isotope concentrations and a c t i v i t y
r a t i o s in CFC sediments, Bega River. 42
5.6 Comparison of thorium and radium isotope concentrations and a c t i v i t y r a t i o s in p a r ti c u l a te s and CFC sediment,
Bega River. 49
5.7 Thorium and radium isotope concentrations and a c t i v i t y
r a t i o s in p a r t i c l e size fr a c ti o n s of bed sediments,
Bega River. 52
6.1 228Th adsorption as a function of s a l i n i t y . 67
6.2 Results of 226Ra adsorption experiments. 70
6.3 Radium isotope concentrations and CECs of sediments used
in desorption experiments. 73
6.4 The e f f e c t of e q u i l i b r a t i o n time on the desorption of
radium isotopes. 73
6.5 The e f f e c t of e q u i l i b r a t i o n time on the desorption of
radium isotopes. 76
6.6 The e f f e c t of s o l i d / l i q u i d (S/L) r a t i o on the desorption
of 226Ra from <63 /zm Bega River sediment. 79
1. I n t r o d u c t i o n
D e t e r m i n i n g the s o u r c e of t r a n s p o r t e d s e d i m e n t s u s i n g t r a c e r s o f f e r s a d i r e c t m e t h o d of t a r g e t i n g soil c o n s e r v a t i o n w o r k s by s p a t i a l l y i d e n t i f y i n g the s o u r c e of er o s i o n . To be s u c c e ssful , a s e d i m e n t t r a c e r n e e d s to h a v e a high d e g r e e of s patial v a r i a b i l i t y t h r o u g h o u t t h e l a n d s c a p e so t h a t it has a high p r o b a b i l i t y of p r o v i d i n g a c h a r a c t e r i s t i c label for s e d i m e n t f r o m a p a r t i c u l a r area. In general, s o u r c e areas c a n n o t be d i s t i n g u i s h e d u s i n g s e d i m e n t p r o p e r t i e s such as m i n e r a l o g y , colour, and m a j o r e l e m e n t c o n t e n t ( W a l l i n g and K a n e 1984). However, it has b e e n d e m o n s t r a t e d t h a t l i t h o s p h e r i c r a d i o n u c l i d e s can be used s u c c e s s f u l l y as s e d i m e n t t r a c e r s ( M u r r a y et al. 1990, 1991). In p a r t i c u l a r , t h o r i u m a n d r a d i u m c o n c e n t r a t i o n s in s e d i m e n t s t r a n s p o r t e d by f r e s h w a t e r r i v e r s a n d s t r e a m s hav e been used to i d e n t i f y the sour c e s of the s e d i m e n t , and t h e r e l a t i v e c o n t r i b u t i o n s o f each s o u r c e q uantified .
T h e m a i n o b j e c t i v e of thi s thesis is to d e t e r m i n e the r e l a t i v e s t a b i l i t y of r a d i u m a n d t h o r i u m c o n c e n t r a t i o n s of t r a n s p o r t e d s e d i m e n t in s a l i n e w a t e r , and so assess w h e t h e r t h e s e t r a c i n g t e c h n i q u e s can be e x t e n d e d to r i v e r s y s t e m s w h e r e t h e total d i s s o l v e d salt (TDS) c o n c e n t r a t i o n is v a r i a b l e .
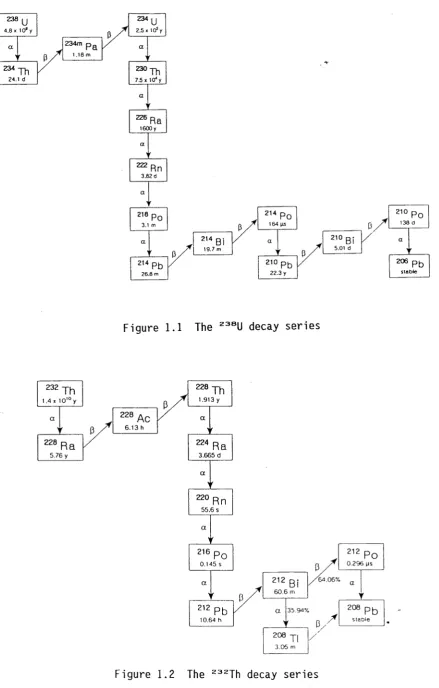
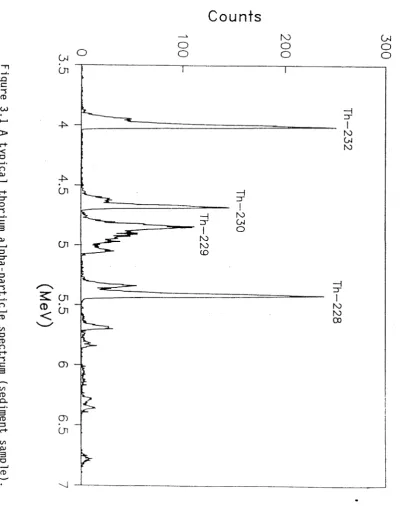
1.1 Uranium a n d T h or i u m Decay Series
The two m o s t a b u n d a n t l i t h o s p h e r i c r a d i o n u c l i d e s are t h o r i u m ( 2 3 2 Th) and u r a n i u m (2 3 8 U). Both t h e s e r a d i o n u c l i d e s u n d e r g o r a d i o a c t i v e d e c a y to f o r m t h e i r own d e c a y series ( F i gures 1.1 and 1.2). In r o c k - f o r m i n g m i n e r a l s w h i c h r e m a i n g e o c h e m i c a l l y u n d i s t u r b e d , all n u c l i d e s in t h e s e s e r i e s wil l e v e n t u a l l y r e a c h a state k nown as s e c u l a r e q u i l i b r i u m . In t his state the a c t i v i t y c o n c e n t r a t i o n s of all m e m b e r s of a s e r i e s are equa l , and the a c t i v i t y ratio (AR) of a n y two m e m b e r s of t h e s e r i e s is e q u a l to one. H o w ever, b e c a u s e of the d i f f e r e n t c h e m i s t r i e s of the n u c l i d e s in e a c h series, p e r t u r b a t i o n s f r o m s e c u l a r e q u i l i b r i u m are c o m m o n in n a t u r e
( I v a n o v i c h and H a r m o n 1982). G e o c h e m i c a l p r o c e s s e s , s u c h as the p r e f e r e n t i a l d i s s o l u t i o n or p r e c i p i t a t i o n of a r a d i o n u c l i d e can give r i s e to an e n h a n c e m e n t or r e d u c t i o n of the a c t i v i t y of t h a t n u c l i d e r e l a t i v e to o t h e r n u c l i d e s in the series.
2.5 x 10s
3.62 d
3.1 m 7.5 x 10* y
1600 y
5.01 d
4.8 x 10s y
22.3 y
164 us 1 .1 6 m
19.7 m
138 a
Figure 1.1 The 238U decay series
35.94%
3 .0 5 m 1.913 y
10.64 h 55.6 s 6 .1 3 h
0.1 45 s 3.665 d
6 0 6 m
sta o le 0 .2 9 6 us
[image:12.539.47.487.62.751.2]The c o n v e r s i o n f r o m t h o r i u m (an a c t i n i d e e l e m e n t ) to r a d i u m (an a l k a l i n e ear t h element) is an i m p o r t a n t p a r e n t - d a u g h t e r r e l a t i o n s h i p , as this d e c a y step involves a m a r k e d c h a n g e in c h e m i c a l b e h a v i o u r (Molinari and S n o d g r a s s 1990). T h e d i f f e r e n t g e o c h e m i c a l b e h a v i o u r of r a d i u m and t h o r i u m d u r i n g soil f o r m a t i o n can lead to R a / T h a c t i v i t y r a t i o s in soils w h i c h are s p a t i a l l y h i g h l y v a r i a b l e . W h e r e t h e r a d i u m a n d t h o r i u m i s o t o p e s are f r o m d i f f e r e n t de c a y series, spatial v a r i a b i l i t y is f u r t h e r e n h a n c e d by the natural v a r i a b i l i t y of t h e U/Th r a t i o in the s o u r c e rocks. C o n s e q u e n t l y , the a c t i v i t y r a t i o of 2 2 6 Ra, a m e m b e r of the 2 3 8 U d e c a y series, to that of
2 3 2 Th has been f o u n d to have d i s t i n c t i v e v a l u e s in soils f r o m d i f f e r e n t areas, a n d can be used to 'fin g e r p r i n t ' soils f r o m tha t area.
1.2 Radionuclides as Sediment Tracers
C o r r e l a t i o n s b e t w e e n 2 2 6 Ra and 2 3 2 Th c o n c e n t r a t i o n s of s e d i m e n t s t r a n s p o r t e d f r o m t h e i r s o u r c e have b e e n used to i d e n t i f y the spa t i a l s o u r c e of that s e d i m e n t , w h e r e each s o u r c e has a u n i q u e 2 2 6 R a / 2 3 2 Th AR ( M u r r a y et al. 1990, 1992b; O l l e y et al. 1993). W h e r e m o r e than one s o u r c e is i d e n t ified , an e s t i m a t e of the r e l a t i v e s e d i m e n t f l u x f r o m e a c h of t h e s e s o u r c e s has been d e r ived. For a t r a c e r to be of gen e r a l v a l u e it mus t not o n l y sho w spatial v a r i a b i l i t y , but it mus t a l s o be c o n s e r v a t i v e , i.e. the s e d i m e n t c o n c e n t r a t i o n s of 2 2 6 Ra and 2 3 2 Th s h o u l d be c o n s t a n t w i t h r e s p e c t to time and d i s t a n c e of t r a n s p o r t of t h e s e d i m e n t ( M u r r a y et al. 1991). If the s e d i m e n t c o n c e n t r a t i o n of e i t h e r r a d i u m or t h o r i u m s h o u l d c h a n g e d u r i n g t r a n s p o r t , the s o u r c e signal is lost.
So far t h e s e t r a c i n g t e c h n i q u e s have b e e n s u c c e s s f u l l y a p p l i e d to a n u m b e r of f r e s h w a t e r systems. In f r e s h w a t e r , r a d i u m a n d t h o r i u m are b e l i e v e d to be t i g h t l y b o u n d to the s e d i m e n t p a r t i c l e s ( M o o r e and E d m o n d 1984; M u r r a y et al. 1992a), a n d so the 2 2 6 R a / 2 3 2 Th AR is l i k e l y to p r o v i d e a r e l i a b l e
label of that s ediment. However, the e f f e c t s of v a r i a b l e w a t e r c o m p o s i t i o n on the s t a b i l i t y of s e d i m e n t signal have not bee n inves t i g a t e d . One p a r a m e t e r which varies s i g n i f i c a n t l y in m a n y A u s t r a l i a n r i v e r s is the T D S c o n c e n t r a t i o n . The salt c o n t e n t of rivers in some areas of inland A u s t r a l i a is high, and the e s t u a r i e s of coa s t a l r i v e r s e x h i b i t a r a n g e of s a l i n i t i e s as r i v e r and o c e a n w a t e r mix. It is i m portant t h e r e f o r e to e s t a b l i s h w h e t h e r the use of r a d i u m and t h o r i u m isotopes as s e d i m e n t t r a c e r s c a n be e x t e n d e d to r i v e r systems of v a r y i n g salt c o n t e n t .
Where the TDS concentration of a riv e r changes, preferential adsorption or desorption of either radium or thorium from the suspended sediment may a lte r the tracer signal.
•v 1 .3 Thesis Aims and S tru c tu re
The aim of this thesis is to determine the e ffe c t of the TDS concentration of riv e r water on the concentrations of radium and thorium isotopes in the suspended sediment and bed load compartments in rive rs. This is done by studying th e ir re la tiv e sorption behaviour in fresh and saline waters. An assessment is then made of the s u i t a b i lit y of radium and thorium isotope AR's as sediment tracers in saline riv e r systems.
The following chapter is a lite ra tu re review of the factors lik e ly to affect the sorption of radium and thorium. P articular emphasis is placed on sediment-solution interactions, and the behaviour of radium and thorium in saline waters. Chapter 3 describes the principal analytical techniques employed in the study.
The problems associated with sediment tracing using Ra/Th AR's in a saline inland riv e r system are illu s tra te d in chapter 4, and potential alternative tracers highlighted. The changes in radium and thorium isotope concentrations in suspended sediment and solution with discrete increases in TDS concentration ( s a l i n i t y 1) are then investigated in more detail by studying th e ir behaviour in an estuary (chapter 5). The s u it a b ilit y of some radium and thorium isotope a c t iv it y ra tio s as potential sediment tracers in saline waters are assessed.
Laboratory experiments are then used to examine more closely radium and thorium sorption as a function of s a lin it y and s o lid /liq u id ra tio (chapter 6). The extent of radium loss from the sediment, and the mechanisms of release are discussed.
A summary of the results of th is study, and the implications fo r sediment tracing in saline waters are presented in chapter 7.
1 The term ' s a l in i t y ' is used in th is thesis in the oceanographic sense only, i.e . its use is re s tricte d to marine or coastal waters where the salt content is dominated by seawater, and major ion ratios are constant.
2. Literature Revi e w
This chapter reviews what is known of the environmental chemistry of thorium and radium, with particular reference to the effects of ionic strength (TDS concentration) on sediment/solution interactions.
2.1 T h o r i u m C h emistry
All thorium isotopes are radioactive. The most abundant naturally-occurring isotope, 232Th, has a half-life (ti/ 2 ) of 1.4 x 10¹⁰ y, and is the parent of a decay series which includes 228Th (ti/2 = 1.9 y) (Figure 1.2). The other common thorium isotope is 23°Th which forms part of the 238U decay series (Figure 1.1).
In nature thorium exists as a small highly charged cation, Th4^. It has an ionic radius of 0.99 angstrom. Between pH 2-3 thorium undergoes extensive interaction with one or more 0H~ ligands in aqueous solutions to form a range of hydrolysis products (Baes and Mesmer 1976). It is generally believed that the species T h ( 0 H ) % is the predominant species above pH 5 (Ames and Rai 1978; Langmuir and Herman 1980; LaFlamme and Murray 1987; Hunter et al. 1987), although Harmsen and deHaan (1980) consider Th(0H)22H_ to be the major species in soil solutions above pH 4. Above 5, pH does not affect the solution concentration of hydrolysed thorium (Ames and Rai 1978).
The calculated solubility of thorianite (Th02 ) in pure water is 10~5 ppb (Langmuir and Herman 1980). The presence of inorganic ions such as sulphate and phosphate can significantly increase thorium solubility at pH <6. Between pH 6-8 the strong thorium complexes formed with the organic ligands often present in surface waters are considered to dominate, increasing thorium solubility by many orders of magnitude.
2.1.1 T h e distribution of thorium in the en vi r o n m en t
Thorium is usually found in trace amounts in geological materials, although its content can vary considerably in rocks and soils. Its concentration is typically in the range 0.03-50 ppm (Ames and Rai 1978).
Thorium is gen era lly assumed to be immobile in surface waters, based on i t s
low s o l u b i l i t y at pH 6-8, and i t s high p a r t i c l e r e a c t i v i t y , i . e . i t s
a b i l i t y to sorb onto and remain f i x e d to clays and s o i l c o l l o i d s . Soluble
thorium in surface waters is p r i m a r i l y present as complexed or c o l l o i d a l
species. Concentrations often exceed 0.01 ppb, which is at least three
orders of magnitude higher than the computed s o l u b i l i t y of Th02 (Langmuir
and Herman 1980). These elevated concentrations are a t t r i b u t e d to organic
ligands present in most surface waters. Humic substances associated with
s o i l s and organic matter dissolve to form humic and f u l v i c acids capable of forming c o l l o i d a l complexes with thorium (Harmsen and de Haan 1980; Choppin
1988). Wahlgren and Orlandini (1982) observed a c o r r e l a t io n between
soluble thorium and dissolved organic matter in a series of lakes.
The low concentrations of thorium in seawater (less than 10~* ppb), are
probably due to the lack of dissolved organic species (Knauss et a l . 1978).
The dissolved s a l t s present in seawater tend to f l o c c u l a t e c o l l o i d a l and
suspended material which subsequently aggregate to form larger p a r t i c l e s
(Scott 1982; Gibbs and Konwar 1986). Li et a l . (1984) suggested th a t t h i s
was the dominant mechanism by which metals are removed from the open ocean.
2.2 Radium Chemistry
There are four n a t u r a l l y - o c c u r r i n g isotopes of radium, a l l of which are
ra dio ac tiv e. The lo n g e s t- 1ived of these, 226Ra, has a h a l f - l i f e of 1600 y,
and occurs as pa rt of the 238U series (Figure 1.1). 228Ra ( t i / 2 = 5.8 y)
and 22*Ra ( t i /2 = 3.7 d) occur as part of the thorium decay series
(Figure 1.2). Radium-223 ( t i /2 = 11.3 d) occurs as part of the 235U decay
s e r i e s .
The outer e l e c tr o n i c con figu ra tion of radium is 7s2, and i t s ion has a +2
charge. Radium is situated in Group 11A of the Periodic Table, together
with Be, Mg, Ca, Sr and Ba. C o l l e c t i v e l y these elements are known as the
a lk a li n e earth elements. Radium shares s i m i l a r chemical properties with
the other a l k a l i n e earths, p a r t i c u l a r l y strontium and barium. The
geochemistry of these elements is dominated by t h e i r ease of o x id at io n , the
ionic nature of t h e i r metal-oxygen bonds and the i n s o l u b i l i t y of t h e i r
sulphate and carbonate s al ts (Molinari and Snodgrass 1990).
The thermodynamic properties of radium have been evaluated recently by Langmuir and Riese (1985), and the speciation of radium in aqueous solutions has been studied by Benes et al. (1982). Of the aqueous species, Ra2+ and the ion-pair (RaS0*)° are likely to have the most significance in the environment, although Benes (1982) suggested that dissolved organic species were capable of complexing radium.
2.2.1 The d i stribution of radi u m in the environment
The radium content of various igneous and sedimentary rocks has been summarised by Ames and Rai (1978), and range from 0.01-1.4 x 10~6 ppm- Concentrations of radium in surface waters are usually less than 10~13M, and probably never reach saturation. Instead, radium concentrations in solution are limited by adsorption and/or solid solution formation (co-precipitation) processes (Langmiur and Riese, 1985).
In the pH range of most natural waters containing low TDS concentrations (pH 6-8), Ra2+ is strongly adsorbed by clay minerals (Benes 1985, 1986a). However in saline groundwaters (Dickson 1990) and estuaries (section 2.5 below) elevated concentrations of radium have been found.
2.3 The Partitioning of R a di u m and Thorium Between Solid and Solution 2.3.1 R a di u m /thorium d i s e q u i l i b r i u m
The different chemical behaviour of radium and thorium in the environment is best illustrated by the degree of their radioactive disequilibrium. Although all radium isotopes are formed as a result of the decay of their parent thorium isotopes, deviations from secular equilibrium for the thorium-parent/radium-daughter relationship in the biosphere are common, (Molinari and Snodgrass 1990). Geochemical sorting processes, such as solution and precipitation can result in disequilibrium where one daughter is more mobile than the other (Osmond and Cowart 1982). This is likely to be the case in river systems, and 226Ra/23°Th activity ratios (AR's) differing significantly from unity have been reported in the dissolved and particulate phases of a freshwater creek (Murray et al. 1992a) and estuarine river sediments (Li et al. 1977, Elsinger and Moore 1980).
2.3.2 The d i stribution coefficient (Kd )
A common concept used to indicate the degree of partitioning between the solid and solution phases is that of the distribution coefficient or Kd , given by
Kd (mL/g) = concentration of cation in the solid phase concentration of cation in solution
Because the Kd incorporates both the solution and solid concentrations, small changes in the adsorption of an ion may result in large changes in the Kd . The behaviour of radionuclides in natural systems depends on numerous factors, and so the absolute K d values derived for a particular system cannot in general be extended to other natural environments. The main advantage of the Kd concept lies in its ability to indicate the fate of dissolved species involved in solid-solution interactions (Li et al. 1984).
2.4 Laboratory Sorption Studies 2.4.1 Thorium
Results of laboratory studies on thorium adsorption have been summarised by Ames and Rai (1978). Thorium was found to be strongly adsorbed to clay sized particles, and concentrations decreased with increasing soil particle size (Nishiwaki et al. 1972). However, organic complexing agents such as calcium citrate are capable of removing sorbed thorium from clay minerals (Bondietti 1974). Hunter et al. (1987) noticed reduced adsorption of thorium from seawater by 6Mn02 in the presence of the competing ligands EDTA and CDTA.
Thorium adsorption onto clay minerals increases with increasing pH, and is practically complete at pH 6.5 (Bondietti 1974). Experiments by LaFlamme and Murray (1987) and Hunter et al. (1987) showed that adsorption of thorium onto hydrous iron and manganese oxides is strongly dependent on pH in the range 2 to 5. Adsorption is essentially complete above pH 6. The latter study was performed using marine electrolytes of varying major
ion composition. The authors concluded that changes in the concentrations of the major cations Ca^ and Mg^ did not affect thorium adsorption, but the presence of SCUZ~ decreased adsorption at pH <6 due to the formation of
ion pairs.
LaFlamme and Murray (1987) concluded that above pH 9 thorium adsorption onto goethite decreased with increasing carbonate alkalinity. Experimental variations of ionic strength at pH 8.9 did not have any influence on adsorption. Nishiwaki et al. (1972) also did not observe any effect of sa linity on thorium adsorption on fine sand and si l t-c la y suspensions spiked with 232Th.
2 . 4 . 2 Radium
Laboratory studies on the sorption properties of radium have been undertaken utilizing radiotracers (Havlik et al. 1967; Ames and Rai 1978; Barney 1984; Benes et al. 1984, 1985, 1986). These studies indicate that the equilibration of radium between solid and solution occurs primarily by ion-exchange (Ames and Rai 1978; Barney 1984; Benes 1990). In a detailed summary of papers dealing with the sorption properties of radium, Benes (1990) found that the distribution of radium between water and sediments was influenced by the time of contact, suspended solids concentration (solid/liquid ra tio ), composition of the water and composition of the sediment. The effects of each of these factors is summarised below.
Contact time
In general, surface adsorption of radionuclides which appear to be controlled by ion-exchange occur rapidly (Serne and Relyea 1981). Havlik et al. (1967) reported that desorbed radium reached ion-exchange equilibrium within 15 min. Benes (1990) concluded that the radium adsorbed onto model solids did not change from 1 h to 17 h of contact. Over longer periods (days-months) however, Dickson (1985) observed a decrease in the amount of radium released into saline water from crushed ore. He postulated that this decrease may be due to mineralogical alteration in the ore, or slow radium sorption processes.
Li et al. (1984) observed that the adsorption rate constant in seawater for a number of elements, including barium, depended on the suspended sediment concentration. They suggested that these reactions took place as surface processes involving isotopic exchange and/or coagulation of colloids which subsequently adsorbed onto surface sites of clays.
Solid/liquid (S/L) ratio
Laboratory studies with radiotracers have generally shown that adsorption of a cation from solution increases as the S/L ratio increases, and is due to the greater number of available adsorption sites (Balistrieri and Murray 1984). However Kd values for many species tend to be higher at low S/L ratios; i.e . the extent to which they are adsorbed per unit mass of the solid phase is greater at low concentrations of the solid phase (O'Connor and Connolly 1980). This trend has also been observed for radium (Benes et al. 1984, 1985, 1986a), barium (Li et al. 1984) and strontium (Schell and Sibley 1982). Li et al. (1984) considered that soluble metal ions may form colloids which subsequently coagulate onto larger particles. This process would only be significant at low suspended solid concentrations, as it would be masked by surface adsorption processes at high concentrations. In addition, the higher degree of particle aggregation associated with high suspended solid concentrations may decrease the effective surface area for adsorption. Both these processes would tend to the lower Kd value as the suspended solid concentration increased.
Water composition
a) Ionic strength
Adsorption of radium from solution decreases with increasing ionic strength of the solution (Serne and Relyea 1981; Benes et al. 1984, 1985, 1986a, 1986b). This effect is ascribed to the competing effects of the other cations in solution for the same ion-exchange sites on the surface of the solid phase (Barney 1984). Sayles and Mangelsdorf (1977) concluded that on introduction to seawater, fluvial clays give up their exchangeable Ca2+ for Na+. Inasmuch as Na'*' may also replace Ra2+ on exchange si tes, the result will be an overall net desorption of radium as freshwater sediment is exposed to increasing salinity.
Results of laboratory desorption experiments performed on freshwater river sediments (Elsinger and Moore 1984) and crushed ore (Dickson 1985) showed that a positive correlation exists between soluble radium concentration and dissolved salt concentration. Elsinger and Moore used seawater to desorb radium, and found that radium desorption reached a maximum at about 18 parts per thousand (ppt) salinity.
Havlik et al. (1967) studied the effect of different cations on radium release from ore and sediments. They found that KCL and NaCl leached the most radium, and SrCl2 and BaCl2 leached the least. However, Benes (1982) noted that the desorption effects of monovalent and bivalent cations varied considerably, suggesting that differences in sediment type and in the nature of the radium bond were responsible.
The sulphate anion can enhance the retention of radium by solids by suppressing the dissolution of barite and other sulphate minerals containing radium (Benes 1990). Dickson (1985) found that the addition of up to 10 g/L of sulphate decreased the leaching of radium by a NaCl solution. He considered that this decrease may be due to the formation of RaSO* complexes which were unable to diffuse from the rock matrix.
b) pH
For most minerals adsorption of radium increases with rising pH in the range 2-9. The same effect was noted for barium adsorption onto interfacial sediments in seawater (Balistrieri and Murray 1984). This pH dependence can be explained by the competition of H+ ions with radium for ion-exchange s i t e s , and by the possible decomposition of some minerals at pH <3. Also, soil colliods and crystalline solids carry a net negative charge which increases with rising pH, giving rise to an increased cation exchange capacity (CEC) (Ames and Rai 1978).
Havlik et al. (1967) found that for typical surface waters pH did not play a major role in releasing radium from sediments. However (Benes et al. 1984, 1985, 1986a) found that in the pH range 6-8 the adsorption behaviour of radium may depend on the mineralogical composition of the solid. Adsorption of radium by fe rric hydroxide, quartz, and to lesser extent
k a o l i n i t e showed a s i g n i f i c a n t dependence on pH in t h i s range.
Sediment properties
■v a) P a r t i c l e size
In general, the f i n e f r a c t i o n of sediments and s o i l s contains more radium
than the coarser f r a c t i o n s (Scott 1968; Megumi and Mamuro 1977; Benes
1990). Megumi and Mamuro (1977) suggested tha t t h i s r e la t i o n s h i p is due to
the f a c t that surface area plays an important ro le in the enrichment of
radionuclides on the surfaces of s o il p a r t i c l e s , and th a t the surface area
per u n i t mass of s o i l p a r t i c l e s increases with decreasing p a r t i c l e size.
b) Mineralogical composition
Ames at a l . (1983) studied the adsorption of radium onto a range of
secondary minerals, and found th a t c l i n o p t i l o l i t e , i l l i t e and n o n t r i t e were
the most e f f i c i e n t adsorbers of radium. They also observed a general
c o r r e l a t io n between radium adsorption and the CEC of the substrate.
Benes et al . (1984, 1985, 1986a) found that the adsorption a b i l i t y towards
radium in the pH range 7.4-8.1 followed the sequence: muscovite > a l b i t e >
montmori1 Ion ite > k a o l i n i t e > quartz. They concluded that the extent of
radium adsorption by each mineral depends on the nature of the bond formed,
and the structure of the mineral. However the re s u lt s of subsequent
experiments using freshwater r i v e r sediments were co n tr a d ic to ry (Benes et
a l . 1986b), and the authors concluded that they could not e a s i l y r e l a t e
radium sorption behaviour to the composition of the sediments.
2.5 Estuarine Studies
As mentioned above, changes in the s a l i n i t y of the water may s i g n i f i c a n t l y
a f f e c t the behaviour of soluble metals. Where r i v e r and ocean waters mix a
s a l i n i t y gradient is formed r e s u l t i n g in the coagulation and adsorption of
some cations, and the progressive desorption of others, including radium,
from the river-borne p a r t i c u l a t e s .
The behaviour of radium in estuarine systems has been extensively studied
(Li et a l . 1977; Li and Chan 1979; Moore 1981; Elsinger and Moore 1980,
1983, 1984; Key et a l . 1985; Moore and Scott 1986). In a l l these studies,
radium exhibited non-conservative behaviour. Li and Chan (1979) estimated
th a t desorption increases the t o t a l r i v e r f l u x of radium to the ocean by 9
to 22 times that of freshwater input alone. They suggested th a t t h i s f l u x
is due to desorption from r i v e r sediments. Elsinger and Moore (1980)
showed that the increase in dissolved 22GRa concentrations with r i s i n g
s a l i n i t y in Winyah Bay was accompanied by a corresponding decrease in the
suspended sediment 226Ra concentrations. Moore and Scott (1986) compared
the desorption curves of dissolved 22eRa f o r three r i v e r estuaries. They
found that the desorption maximum occurred at a d i f f e r e n t s a l i n i t y f o r each
r i v e r , and that t h i s s a l i n i t y was determined by the c h a r a c t e r i s t i c s of the
water, sediment and hydrography of the r i v e r .
Measurements of other radium isotopes, p a r t i c u l a r l y 220Ra (Moore 1981;
Elsinger and Moore 1984; Key et a l . 1985) have shown th a t bottom sediments
are an additional source of radium to the estuary. The enrichment of
dissolved 228Ra is gr eater than 226Ra, and is probably due to d i f f u s i o n of
radium from bottom sediments where, because of i t s much shorter h a l f - l i f e ,
the rate of re-generation of 228Ra a c t i v i t y f a r exceeds that of 226Ra.
D i ff u s i v e losses of radium from bottom marine sediments are often r e f l e c t e d
by radioactive d i s e q u i 1i b r i a in these sediments. Because thorium is not
mobilized, a 226Ra/23°Th AR <1 in bottom sediments w i l l normally indicate a
loss of radium to the water column. A defic ienc y of 22GRa with respect to
i t s parent 23°Th was observed in Winyah Bay (Elsinger and Moore 1980), and in acid leachates of surface sediments in Hudson Bay (Li et a l . 1977).
Dissolved thorium in r i v e r water which mixes with saline water in an
estuary is ra p i d l y removed onto p re c i p i ta te d iron and manganese
oxyhydroxides and fl o c c u l a t e d organic c o l l o i d s . Consequently, thorium
removal by p a r t i c u l a t e matter in seawater is expected to be rapid (e.g.
Bacon and Anderson 1982, Nozaki et a l . 1981). I t s removal rate in marine
systems has also been found to be cor relat ed with the p a r t i c u l a t e matter
concentration in the water column (Sanstchi et a l . 1979; McKee et a l .
1986).
2 . 6 Summary
Broadly, water and sediment composition are the two factors which govern the sorption behaviour of radium and thorium in surface waters. Salinity is the major factor influencing the behaviour of radium. As salinity increases, radium is released from freshwater sediments. Radium is probably replaced on ion-exchange sites on the sediment by major cations present in solution. Other factors such as the S/L ratio of sediment suspensions, and contact time may also affect radium sorption. The extent to which pH effects radium sorption appears to depend on the sediment composition.
Thorium is strongly adsorbed onto sediments in the pH range of most surface waters (6-8). The presence of organic colloids in freshwater may increase the mobility of thorium, but in saline water thorium is likely to retain its particle reactive nature due to the flocculation of colloidal material.
Given the difficulty in relating the sorption behaviour of radium for individual minerals to sediments as a whole, i t is appropriate that this study focus on the effects of variable sal i ni t y on radium and thorium sorption using a typical river sediment at a typical pH range for surface waters. Furthermore, if the sui t abi l i t y of the 226Ra/232Th AR as a sediment tracer in saline surface waters is to be properly assessed, the following points need particular attention;
- the relative sorption behaviour of both radium and thorium isotopes in suspended sediment over a wide salinity range. The behaviour of radium as a function of TDS concentration is well documented, but data for thorium is sparse, particularly at low salt concentrations. None of the previous studies have studied the behaviour of the isotopes of both of these elements in the same material with changing TDS concentration.
- the response of radium and thorium sorbed onto freshwater sediment to small increases in TDS concentration, such as those which often occur in Australian inland water. At what salt concentration will changes in the sediment 226Ra/232Th AR become significant?
- the e ff e ct of S/L ratio on radium loss in saline waters. If radium Kc's in saline waters vary with S/L ratio, losses of radium from suspended sediment may diff er from that of bottom sediments.
3. Analytical Techniques
3.1 Alpha Spectrometry
•v
Alpha-particle spectrometry following radiochemical separation is the most sensitive method of analysis of radium and thorium isotopes, p a rtic u la rly for environmental samples where a c tiv itie s are low, and sample size is limited- The procedures used in th is work have been described in d e ta il by Hancock and Martin (1991) and Martin and Hancock (1992). A b rie f summary follows.
3 .1 .1 Sample dissolution and radiochemical separation
Water samples: The tracer solution used was a calibrated 229Th
( t i/ 2 = 7340 y) solution (Amersham, ±1%) containing 225Ra ( t i /2 = 14.8 d)
in secular equilibrium. After addition of a known quantity of the tracer nuclides to 2-5 L of a cid ifie d f i l t r a t e , radium and thorium isotopes were concentrated by co-precipitation with manganese dioxide at pH 10. This precipitate was recovered by f i l t r a t i o n , dissolved in a HC1/H202 solution and evaporated to dryness. The residue was dissolved in 0.1 M HC1 and radium and thorium isotopes co-precipitated with lead sulphate. After decanting the supernatant and washing, the precipitate was dissolved in an ammoniacal EDTA solution. This solution was poured onto an anion exchange column. Thorium was retained on the column, whereas radium passed through and was collected fo r furthe r p u rifica tio n (see below). The column was then washed with 8 M HN03 solution and thorium eluted with 9 M HC1. This eluate was evaporated to dryness and electrodeposited onto a stainless steel disc (20 mm diameter) from a sulphate electrolyte. The active area of the disc was approximately 250 mm2.
The radium fraction (above) was further purified using a cation exchange column. Alkaline earth cations were sequentially eluted from the column by washing with 1.5 M ammonium acetate and 2.5 M HC1 solutions. Radium was f i n a l l y eluted with 6 M HN03. After evaporation to dryness, radium was electrodeposited onto a stainless steel disc from an aqueous/ethanol solution at pH 2.
Sediment samples: The tracer isotope was added to 0.5-1 g of dry sediment in a platinum dish, 2-3 mL each of n itr ic and hydrofluoric acids were added and the slurry evaporated to dryness. The residue was then solubilised by fusion with potassium fluoride, followed by transposition to a pyro- sulphate cake. This cake was then dissolved in 0.1 M HC1 and the thorium and radium isotopes separated from the sample matrix by co-precipitation with lead sulphate. Analysis then proceeded as described for water samples.
Virtually all chemical yields for both radium and thorium determinations were in the range 60-90%.
3.1.2 Spectrometry
Electrodeposited discs were counted using an Ortec silicon surface barrier detector (active area 450 mm2) connected to a Canberra Multi-Channel Analyser. The duration of counting varied from 1-4 days depending on the activity of the source.
The unit of activity used in this work is the Bequerel (Bq). One Bq is equal to 1 disintegration/sec. The detection limits for the determination of radium and thorium isotopes by alpha-particle spectrometry are dependent on the count time and background count rates, but are typically in the range 0.4-1.0 mBq per sample.
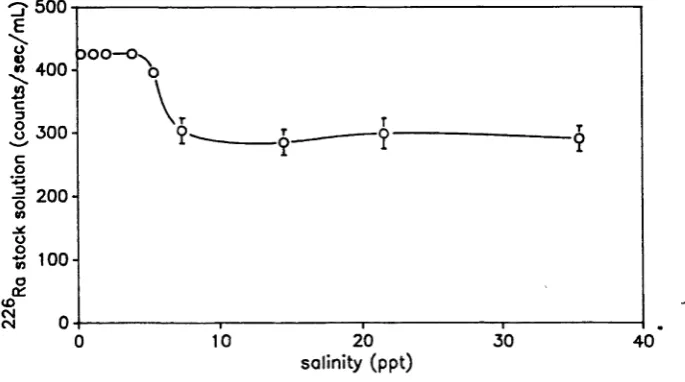
Thorium
A typical thorium spectrum produced from a source prepared from a sediment sample is shown in Figure 3.1. The positions of the three naturally-occurring thorium isotopes, 232Th, 23°Th and 228Th are shown, together with the 229Th trac er. The concentration of each isotope in the sample can be calculated by integrating the counts for that isotope over its energy region, and deducting the calculated number of counts present in this region due to interfering peaks and background activity. The net count of each isotope is then compared to the net tracer peak count, and the isotope activity derived from the known activity of the tracer.
F ig u re 3 .1 A ty p ic a l th o ri u m a lp h a -p a rti c le s p e c tr u m (s e d im e n t s a m p le ).
Co u nt s
OJ
Cn
O OO
[image:28.539.75.481.188.695.2]Radium
The activities of the four naturally-occurring radium isotopes were obtained from three different counting periods of the same source. An initial count within two days of electrodeposition enabled the determination of the ratio of the short-lived radium isotopes (223Ra and 224Ra) to that of 226Ra. A second count 2-3 weeks later enabled the recovery of the 225Ra tracer to be calculated via ingrowth of its alpha-emitting daughters, and the absolute concentration of 226Ra in the sample determined. Using the ratios determined in the first count, the activities of 223Ra and 224Ra could then be calculated. A third count 6-12 months later enabled a measurement of 228Ra by determining the ingrowth of 228T h .
3.1.3 Calculation of errors
The accuracy of measurements by alpha spectrometry is usually limited by counting statistics. The standard deviation (o) of N random counts is given by
a = N1/2
and the uncertainty of analysis, at the 67% confidence limit, is given by ±o. This calculation has also been used for the determination of counting errors for determinations by gamma spectrometry and liquid scintillation counting (sections 3.2 and 3.3 below). Unless otherwise stated, the quoted uncertainty of all determinations using counting techniques in this thesis will be ±o. The other major source of analysis error is the uncertainty in the activity of the standards used, usually less than ±1%.
3.2 Gamma Spectrometry
Where sufficient sample was available (>40 g ash weight), sediment samples were analysed by gamma spectrometry. The procedure is discussed in detail by Murray et al. (1987), and involves the forming of solid samples, previously ashed at 450°C, into a reproducible geometry by casting them in polyester resin. The samples were then counted on a high resolution, low background germanium detector. The resin allows complete retention of
222Rn gas, and 226Ra can be determined with high s e n s itiv ity after a suitable ingrowth period (3 weeks) fo r 222Rn and daughters. The other radionuclides determined by th is technique were 220Th and 228Ra. Detection lim its fo r a 40 g sample counted fo r 24 h are ty p ic a lly 200 mBq fo r 226Ra, and 1 Bq for 228Ra and 228Th. Although this technique is less sensitive than alpha spectrometry, i t is less labour intensive, and there is no delay
in the measurement of 228Ra.
3.3 Liquid S c i n t i l l a t i o n
This method is in s u ffic ie n tly sensitive fo r the analysis of 226Ra in environmental water samples in this study, but is rapid and has application in the laboratory studies (chapter 6). The method used here is based on that of Cooper and Wilkes (1981). In summary, a weighed amount (~7 g) of f ilt e r e d water sample and 15 mL s c in t illa n t (5 g PBBO, 400 g napthalene in 1 L toluene) were added to a glass s c in t illa t io n v ia l, and the v ia l capped and shaken. A ll via ls were stored fo r at least 3 weeks to allow 222Rn and daughters ( 214Po and 218Po) to grow into secular equilibrium with 226Ra. The via ls were stored in an inverted position to lim it radon loss through the cap.
Samples were counted using a photomultiplier (PM) tube. The base of the via l was o p tic a lly coupled to the face of the PM tube, and a matt white re fle c to r placed around the v ia l. Pulses from the PM tube were recorded using a multi-channel analyser with a conversion gain of approximately 17 channels/MeV. The observed counts were integrated in the energy region 3.8-10.5 MeV. The background count rate in this region fo r a v ia l containing only demineralised water and s c in t illa n t was ~1 count/sec. For a ll determinations a minimum of 5000 counts were accumulated.
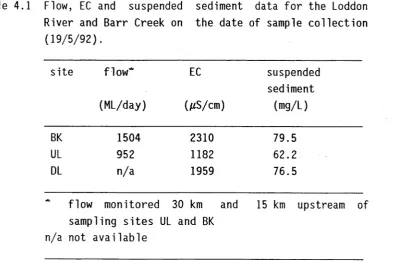
226Ra standards were prepared from the stock solution in t r ip l ic a t e over a range of s a lin it ie s . In general the standard error on the mean of each t r ip l ic a t e set of standards was greater than the error (at the lo level) due counting s t a t is t ic s . Williams (1985) noted that losses of radon through the f o i l - l i n e d caps of s c in tilla t io n vials was the major factor causing v a r i a b ili t y in the determination of 226Ra by this method. He claimed that 'v it o n ' discs inserted in the cap v ir t u a lly eliminated radon loss. Unfortunately, viton discs were not acquired u n til after the
completion of the laboratory analyses. Nevertheless, tests were run to compare the activity of the 226Ra standards in vials containing viton seals with those using the foil-lined cap. In general, the mean of standards in vials containing foil-lined caps were 5% ±3 lower in activity than the
•v
those containing viton. This suggests that the variability in the activity of standards described above was due to variable radon loss.
A plot of the observed count rate against the amount of 22<5Ra added to each vial was found to be linear (r2 = 0.99) in the concentration range of the solutions measured in these experiments (Figure 3.2.a). Deviations from the line of best fit show no trend with increasing 226Ra concentration (Figure 3.2.b). However, count rates were found to be depressed at salinities greater than 3.5 ppt (Figure 3.3), probably as a result of quenching by the chloride ion (M. Cooper, pers. comm.). Quenching refers to losses that can occur during energy transfer from the radioactive particle to the light detecting surface (Williams 1985). Consequently the 226Ra content of all samples were referenced to the mean value of standards of the same salinity.
3.4 Atomic Adsorption Spectrophotometry
Flame atomic adsorption spectrophotometry was used to determine concentrations of the major cations, Na, Ca, Mg, K, Fe and Mn in filtered water. An air-acetylene flame was used, and the samples were aspirated directly into the flame. The high salt content of some samples was found to give spurious results for Fe. Consequently, Fe standards were prepared in solutions containing a range of NaCl concentrations, and a series of calibration curves generated. The Fe concentration of each sample was then obtained by relating its absorbance to the calibration curve of closest salinity.
3.5 Sedimentation Analysis
Sedimentation techniques were used to fractionate sediment particles in the <63/zm size range. The method used was similiar to the pipette method described by Gee and Bauder (1986), with the exception that the sediment pre-treatment consisted of ultrasonic rather than chemical dispersion.
Ra added to vial (Bq)
0.0 —
0 . 5
-'Ra added to vial (Bq)
Fi gure 3.2 (a) Count r a t e as a f u n c t i o n o f 226Ra a c t i v i t y and (b) i t s d e v i a t i o n from l i n e a r i t y .
o
300-2 0 0
-20
salinity (p p t)
[image:32.539.90.460.62.466.2] [image:32.539.100.443.523.714.2]3.6 Cation Exchange Capacity (CEC)
Sediment CECs were determined using the compulsive exchange method described by Gillman (1979). The sediment was first saturated with Ba2_h,
**■
equilibrated with BaCl2 solution equivalent in ionic strength to the sediment solution, and then reacted with MgS04 to replace Ba with Mg. The amount of Mg adsorbed is determined from the loss the MgS04 solution, and is equivalent to the CEC of the sediment.
3.7 X-Ray Diffraction (XRD) Analysis
XRD analyses were carried out with a Siemens D-501 automated 0:20 goniometer using Cu Ka radiation and a graphite monochromater at 50 kV and 30 mA. Scans were made from 4-60° 20 with 1° divergence and scatter slits. Sediment samples were initially run air-dried, and then with ethylene glycol in order to detect smectite minerals.
4. Sediment Tracing in a Saline Inland River System
The o b je c tiv e of t h i s f i e l d study was to assess e m p ir ic a lly whether the
22<5Ra/232Th AR could provide a r e li a b l e tr a c e r signal f o r sediment
transported through an inland r i v e r system which was known to c a rry high
concentrations o f t o t a l dissolved s a lts (TDS). A simple system was chosen,
in v o lv in g the tra n s p o rt and mixing o f sediment from two known sediment
sources. The system consisted o f the confluence of a r i v e r con taining
water w ith a low s a l t content, and i t s t r i b u t a r y con taining water with a
r e l a t i v e l y high s a l t content. Downstream of t h e i r confluence the TDS
concentration o f the r i v e r water had ris e n s i g n i f i c a n t l y . The radium and
thorium concentrations of suspended and bed sediment samples from the two
upstream arms were examined, and compared w ith sediments downstream o f
t h e i r confluence.
4.1 The Loddon R iv e r-B a rr Creek Confluence
A section of the Loddon River downstream of Kerang in V ic t o r ia , and i t s
t r i b u t a r y Barr Creek was selected as the study s i t e (Figure 4 .1 ) . The
Loddon River is a t r i b u t a r y o f the Murray R iver, entering i t near Swan
H i l l . Barr Creek jo in s the Loddon River about 20 km north o f Kerang. The
Kerang region is a groundwater discharge zone, and is responsible f o r
increases in the TDS concentration o f the Murray River. Barr Creek
receives h ig h ly s a lin e groundwater outseepage and is the la rg e s t single
p o in t source of soluble s a lts to the Murray River (Macumber 1991).
Water q u a l i t y monitoring o f Barr Creek has shown th a t periods o f high
e l e c t r i c a l c o n d u c tiv ity (EC), up to 34,900 //S/cm, have occurred between
1978 and 1986 (Mackay et a l . 1988). This EC corresponds to about
21,000 mg/L TDS ( c . f . seawater -45,000 //S/cm, or 35,500 mg/L TDS). The
mean c o n d u c tiv ity over the same period was 8,495 //S/cm. By c o n tra s t, the
EC of the Loddon River was lower by about an order of magnitude. At
Kerang, upstream of i t s confluence with Barr Creek, the Loddon had a mean
EC of 760 //S/cm, and a maximum recorded EC of 3800 //S/cm. The Loddon River
downstream of i t s confluence w ith Barr Creek does not appear to have been
monitored. However Mackay et a l . 1988 re p o rt flow data f o r both Barr Creek
and the Loddon R iver, tog eth er w ith t h e i r t o t a l s a lt load. This data
</d
0)
w
O)
c
Q .
E
03 C/3
C
o To
o o
0
- C
Z3 0 3
U_
4.
1
The
L
o
d
d
o
n
R
iv
er
-B
arr
C
re
e
k
c
o
n
flu
e
n
c
e
,
sh
o
w
in
g
t
indicates that the TDS concentration of the Loddon River more than doubles downstream of its junction with Barr Creek.
4.2. Methods
4.2.1 Sample c o ll e c t i on and analysis
Sediment and water samples were collected in May 1992 from three sites; the Loddon River (site UL) and Barr Creek (BK), 3 and 5 km respectively upstream of their confluence, and the Loddon River 6 km downstream of its confluence with Barr Creek (DL). The locality of the sites are shown in Figure 4.1. Three river bed sediment samples were collected from each site along a 1 km reach of the river using an Eckman grab sampler. A 20 L water sample was also collected from each site, and its EC measured (ßS/cm @ 25*C). The suspended sediment in each water sample was allowed to settle over a period of 3 days, and the water decanted. The sediment was recovered, dried and the concentrations of radium and thorium isotopes determined by alpha spectroscopy. Radium and thorium isotope concentrations of bed sediment samples were determined by gamma and alpha spectrometry respectively.
4.3 Results and D i s c u s s i o n 4.3.1 Suspended sediment
Table 4.1 gives the EC and suspended sediment concentrations of the water samples. The EC of both the Loddon River and Barr Creek were well below their recorded maxima (section 4.1) at the time of sampling, probably due to the recent heavy rains and high river flows in the region. Flow data for the date of sampling (also included in Table 4.1) was available for the Loddon River at Kerang, and for Barr Creek about 15 km upstream of site BK (Rural Water Authority of Victoria). No flow data are available for the Loddon River downstream of the confluence, but if it is assumed that there
is no other significant contribution to the flow of either arm between the point of monitoring and site DL, these data indicate that Barr Creek contributed 75% of the total flow downstream of the confluence. This calculation is supported by both EC and suspended sediment measurements. Using a simple two-component mixing model, the downstream vaJue of a
conservative parameter can be calculated using the r e la t i o n s h i p
Ax + By = C (1)
where x and y are the r e l a t i v e co n tr ib u tio n s of the two sources, so that
x + y = 1, and A and B are the upstream, and C the downstream values of the
parameter. Using the fl o w data to qu an ti fy the con tri bu ti ons of the Loddon
River and Barr Creek (x and y in equation ( 1 ) ) , the measured EC at s i t e DL
(1960 pS/cm) corresponds well with the calculated EC (1870 pS/cm).
Likewise, the suspended sediment concentration at s i t e DL (76.5 mg/L) is
also close to i t s c a l c u la te d value (72.7 mg/L). The f r a c t i o n of the t o t a l
suspended sediment load at s i t e DL car rie d by arm B can be calculated from
By/(Ax + By)
For Barr Creek t h i s f r a c t i o n is 0.67, and by diffe ren ce the f r a c t i o n
contributed by the Loddon River upstream of the confluence is 0.33.
Table 4.1 Flow, EC and suspended sediment data f o r the Loddon
River and Barr Creek on the date of sample c o l l e c t i o n
(19/5/92).
s i t e fl ow *
(ML/day)
EC
(pS/cm)
suspended sediment
(mg/L)
BK 1504 2310 79.5
UL 952 1182 62.2
DL n/a 1959 76.5
flow monitored sampling s i t e s UL n/a not a v a ila b le
30 km and
and BK
15 km upstream of
Radium and thorium isotope concentrations and AR's are presented in
Tables 4.2 and 4.3. The 226Ra/232Th AR of the suspended sediment of the
Loddon River at s i t e UL (ARul = 0.745 ±0.033) is s i g n i f i c a n t l y d i f f e r e n t to
th a t of Barr Creek at s i t e BK (ARBk = 0.597 ±0.025). As expected the AR at
[image:37.539.52.472.348.610.2]