Institute of Integrative Biology
Specificities of the interaction of fibroblast
growth factor and heparan sulfate
Thesis submitted in accordance with the requirements of the University of Liverpool for the degree of doctor in Philosophy
Yong Li
i
Author’s declaration
I declare that the work in this dissertation was carried out in accordance with the
regulations of the University of Liverpool. The work described is original and has
not been submitted for any other degree. All aspects of the experimental design and
planning for the study were conducted by me in conjunction with my supervisors, Dr.
M Wilkinson and Professor D Fernig. The experimental work in this dissertation has
been undertaken by me, with specific contributions that I have indicated below and
in the text.
Dr. Ed Yates provided a library of chemical modified heparin. Mr. Changye Sun
assisted me in the production of fibroblast growth factors and cell culture. Dr. Igor
Barsukov and Dr. Barbara Franke aided with experiments performed on
SEC-MALLS.
Any views in this thesis are those of the author and in no way represent those of the
University of Liverpool. This thesis has not been presented to any other university
ii
Acknowledgements
I would like to express my sincerest gratitude and appreciation to those
who have been generous to guide, advice, and support me for my PhD study through
the valuable four years.
First of all, I would like to extend my thanks to both Dr. Mark Wilkinson
and Prof. Dave Fernig for your wealth of knowledge and experience that help me
tremendously with my work. They have been supporting me in terms of
encouragement, guidance and advice, not only just in academic work, but also in
challenging moment in my personal life.
I am grateful to my assessors, Caroline Dart and Olga Mayans, for being
generous to guide me on the right track and offer the advice to enrich my study. Big
thanks to Ed Yates and Quentin Nunes for helping with my experiments and
editing my paper and thesis.
I would also like to thank the colleagues I have worked with in these four
years, especially my friends from Lab D. I have had lots of advice from them, which
has been very useful in my work. Their friendship has helped me have a better
understanding of British culture and get used to British life, which made my PhD life
very enjoyable. My special thanks to Changye Sun, for being my friend, which
helped me get through many challenges over the past 4 years.
Last but not the least, special thanks to my parents, Futian Li and Dexin
Geng for being so supportive of my decision to study aboard. It has been really hard
for you to let me studying four years far from home and the financial support also
iii
Abstract
More than 883 extracellular proteins that bind heparan sulfate (HS) and heparin have
been identified whose activities are regulated by their interactions with these
polysaccharides. FGFs are heparin-binding proteins (the physiological ligand is HS)
and the interactions of FGF with HS determine their transport between cells and the
assembly of signalling complexes with their cognate receptor tyrosine kinases,
FGFRs. The FGF family has expanded from two or three FGF ligands in the worm
C. elegans and the fly Drosophila to 18 FGFs in vertebrates and mammals, which is
directly linked to the more complex specifications required in the development for
increasingly complex body parts. However, the level of specificity of the interaction
of FGFs with HS is still debated. Previous work generally focused on just one or two
FGFs and a limited repertoire of sugar structures, so a systematic investigation of the
interaction of FGFs with heparin/HS is required to determine at what level, if any,
there is specificity at the molecular level underlying these interactions. The strategy
of this work was to use the evolutional relationship of the FGF family as a defined
system to explore the specificity of interactions of FGFs and heparin/HS. Six FGFs
(FGF3, FGF4, FGF6, FGF10, FGF17, and FGF20) from 4 subfamilies have been
produced and purified as recombinant proteins, to investigate the interaction between
FGFs and HS from two different perspectives. The polysaccharide structure required
for binding to the FGFs was determined by differential scanning fluorimetry (DSF)
using a library of chemically modified heparins and model glycosaminoglycans. The
heparin binding sites on the FGFs were then identified by a lysine selective technique called ‘protect and label’. For systemic analysis of the interactions, all of
iv acid sequence alignment, alongside previous work. This shows a clear pattern: FGF
members from the same subfamily have a similar preference for binding particular
subsets of HS/heparin structures and model glycosaminoglycans, and share similar
secondary heparin binding sites on their surface. In contrast, FGFs from different
subfamilies have a more divergent preference for binding structures in the
polysaccharide and secondary binding sites on their surface. The secondary heparin
binding sites (HBS) of FGF2 were mutated to begin the characterization of their
functions. The properties of the mutants of FGF2’s secondary HBSs (HBS2, HBS3)
were measured in terms of their preference for binding structures in heparins, their
ability to stimulate the phosphorylation of p42/44MAPK and cell proliferation. FGF2 (HBS2) mutant was found to be distinct to wild-type only in its interactions with low
sulfated heparins where mutant FGF2 (HBS2) exhibited a stronger preference for
N-sulfated heparin. For mutant FGF2 (HBS3), a larger sugar structure was required for
binding than wild type FGF2. Finally, since both lysine and arginine residues in
HBSs contribute to the interaction between protein and polysaccharide, an arginine
targeted protect and label method was developed. Phenylglyoxal (PGO) was
successfully used in the protection step and was demonstrated to be capable of
achieving full arginine labelling. However, arginine labelling with
4-azidophenylglyoxal (APG) suffered from a ring expansion side reaction and this
second step still needs to be optimized. Overall the thesis demonstrates that there is
specificity in the interaction of FGFs and glycosaminoglycans. Although this is not a
simple one-to-one code, it has clearly been subjected to the same natural selection
that led to the expansion and diversification of the FGF family, the specificities of
FGFs for particular isoforms of the FGFRs and selective activities of the FGF family
v
Contents
Author’s declaration ... i
Acknowledgements ... ii
Abstract ... iii
Contents ... v
List of Figures: ... ix
List of Tables: ... xi
List of Abbreviations ... xii
Chapter 1 General Introduction ... 1
1.1 The discovery of FGFs ... 1
1.2 Evolution of the FGF gene family ... 2
1.3 Phylogenetic and gene location analysis of the human/mouse fgf gene family ... 4
1.4 FGF ligands ... 6
1.4.1 FGF ligand structure ... 6
1.4.2 The functions of FGFs ... 8
1.5 Heparin/Heparan sulfate ... 10
1.5.1 Heparin/heparan sulfate structure ... 10
1.5.2 Heparin/HS biosynthesis ... 11
1.5.3 The functions of Heparin/HS ... 13
1.6 FGF receptors ... 15
1.6.1 FGF receptors ... 15
1.6.2 FGF signalling pathway... 18
1.6.3 Specificity of FGF and FGFR interactions ... 19
1.7 Models for complexes of FGFs and their receptors ... 21
1.8 Specificity of FGF and HS interactions ... 25
1.9 Aims ... 27
vi
2.1 Electrophoresis ... 29
2.1.1 Agarose electrophoresis ... 29
2.1.2 SDS-PAGE ... 29
2.1.3 Western Blot ... 30
2.1.4 Coomassie Staining and Destaining ... 31
2.1.5 Silver staining ... 31
2.2 cDNA cloning ... 32
2.2.1 Polymerase chain reaction (PCR) ... 32
2.2.2 DNA digestion ... 34
2.2.3 Ligation ... 34
2.2.4 Mutagenesis ... 35
2.3 Protein expression ... 35
2.3.1 Materials ... 35
2.3.2 Competent cell preparation ... 36
2.3.3 Bacterial transformation ... 36
2.3.4 Miniprep ... 36
2.3.5 Sequencing ... 37
2.3.6 Bacterial culture ... 37
2.4 Protein purification ... 37
2.4.1 Cell breakage ... 37
2.4.2 Chromatography ... 38
2.5 Mammalian cell culture ... 39
2.5.1 Cell lines ... 39
2.5.2 Tissue culture reagents ... 39
2.5.3 Cell culture ... 40
2.5.4 Cell counting ... 40
2.5.5 Freezing cells ... 40
vii 2.7 Size exclusion chromatography-multi-angle laser light scattering (SEC-MALLS)
... 41
2.8 Differential Scanning Fluorimetry (DSF) ... 42
2.9 Identification of heparin binding sites by Protect and Label ... 43
2.9.1 Protection labelling on heparin ... 43
2.9.2 HBS Lysine Biotinylation ... 43
2.9.3 Protein Digestion ... 44
2.9.4 Biotinylated Peptide Purification... 44
2.9.5 Identification of Labelled Peptides ... 45
Chapter 3 Expression, purification and characterisation of recombinant FGFs ... 46
3.1 Subcloning of FGF cDNAs ... 46
3.1.1 Materials ... 46
3.1.2 Methods ... 47
3.2 Paper: HaloTag is an effective expression and solubilisation fusion partner for a range of fibroblast growth factors ... 49
3.3 Supplemental results of expressions and purification of FGFs ... 74
3.3.1 Bacteria transformation ... 74
3.3.2 Bacterial cultures ... 74
3.3.3 Results of purification of FGFs ... 75
3.4 Size exclusion chromatography-multi-angle laser light scattering (SEC-MALLS) ... 82
Chapter 4 Heparin binding preference and structures in the fibroblast growth factor family parallel their evolutionary diversification... 86
4.1 Paper: Heparin binding preference and structures in the fibroblast growth factor family parallel their evolutionary diversification... 87
Chapter 5 Characterization of HBS mutants of FGF2 ... 127
5.1 Introduction ... 127
5.2 Methods ... 128
5.2.1 Production of FGF2 mutants ... 128
viii
5.2.3 Phosphorylation of p42/44MAPK ... 128
5.2.4 MTT assay ... 129
5.3 Results and Discussion ... 130
5.3.1 The sugar structure required for binding to FGF2 mutants ... 130
5.3.2 Biological activities of FGF2 and its HBS mutants on Rama 27 fibroblasts 137 5.4 Conclusions ... 141
Chapter 6 Arginine-targeted protect and label ... 144
6.1 Introduction ... 144
6.2 Materials and methods ... 147
6.2.1 Materials ... 147
6.2.2 Arginine targeted ‘protect and label’ ... 147
6.3 Results ... 148
6.3.1 Method development for arginine protection by phenylglyoxal ... 148
6.3.2 Method development of arginine labelling by azidophenylglyoxal (APG) .. 154
6.4 Discussion: ... 156
Chapter 7 General discussion and perspective ... 163
7.1 Discussion: ... 163
7.2 Further work: ... 172
Supplemental data ... 176
Papers and manuscripts ... 176
ix
List of Figures:
Figure 1.1 Possible evolutionary relationships between the fgf genes 3 Figure 1.2 Evolutionary relationship tree of FGF family 5 Figure 1.3 Schematic diagram of the core structure unit of the β-trefoil motif 7
Figure 1.4 Ribbon diagram of crystal structure of FGF2 7
Figure 1.5 Heparin/HS disaccharide units 11
Figure 1.6 FGFR domain structure 16
Figure 1.7 Models of FGF signalling complexes 22
Figures 3.1 Expression of plasmid map of FGF4 and FGF2 mutants 46 Figure 3.2 SDS PAGE of different stage of FGF2 purification 74 Figure 3.3 SDS PAGE of samples containing FGF2 (HBS2) (Mw≈ 18.7 kDa) 76
Figure 3.4 SDS PAGE of samples containing FGF2 (HBS3) (Mw≈ 21 kDa) 77 Figure 3.5 SDS PAGE of different stage of FGF4 purification (Mw≈ 13.7 kDa) 79
Figure 3.6 The average molecular mass per volume unit volume and the differential refractive index of FGF2 and FGF20 81 Figure 3.7 The average molecular mass per volume unit and the differential refractive index of FGFs (FGF2 mutants, FGF4, FGF10, Halotag-FGF6 and FGF17) 83
Figure 5.1 The crystal structure of FGF-2 (residues 143-288; PDB 2FGF) (Zhang et al., 1991) 128 Figure 5.2 Melting temperature curves of FGF2 (blue), FGF2 (HBS2) (black) and FGF2 (HBS3) (red) 130 Figure 5.3 Differential scanning fluorimetry analysis of binding of GAG derivatives to FGF2 (HBS2) (black) and FGF2 (HBS3) (red) 133 Figure 5.4 Kinetics of phosphorylation of p42/44 MAPK induced by FGF2 and its mutants 136 Figure 5.5 Incorporation of MTT by Rama 27 fibroblasts stimulated by FGF2 or its mutant 137
Figures 6.1 Sequence alignment of the FGF7 subfamily 142
x Figure 6.3 Reaction between P-azidophenylglyoxal (APG) and biotin DIBO alkyne 143
Figure 6.4 Mass spectra of the digestion of unmodified and modified FA 148 Figure 6.5 Mass spectra of BF reacted with 200 mM phenylglyoxal for 30 min 150 Figure 6.6 Mass spectra of peptide I and II reacted with 200 mM phenylglyoxal for 30 min 150
Figure 6.7 Mass spectra of FA 155
Figure 6.8 Mass spectra of FA reacted with PGO 156
Figure 6.9 Mass spectra of FA reacted with PGO 157
Figure 6.10 Ring expansion caused by the reaction of the nitrene group with double bonds 152
Figure 6.11 Mass spectra of FA reacted with APG 158
xi
List of Tables:
Table 1.1 Summary of some physiological roles of FGF 9
Table 1.2 FGFR binding specificities of FGFs 18
Table 2.1 SDS-PAGE 28
Table 2.2 PCR reaction setting 31
Table 2.3 Digestion system 32
Table 2.4 Ligation system 33
Table 3.1 Primers designed for amplifying FGFs 44
xii
List of Abbreviations
ACN: acetonitrile
APG: 4-azidophenylglyoxal
Arg: arginine
BF: Bradykinin fragment 2-9
BSA: bovine serum, albumin
CBB: Coomassie Brilliant Blue
CS: chondroitin sulfate
DMSO: dimethyl sulphoxide
DMEM: Dulbecco’s modified Eagle medium
dp: degree of polymerization
DS: dermatan sulfate
DSF: differential scanning fluorimetry
DTT: dithiothreitol
ECM: extracellular matrix
EDTA: ethylenediamine tetra-acetic acid
FA: Fibronectin adhesion-promoting peptide
xiii FGF: fibroblast growth factor
FGFR: fibroblast growth factor receptor
HA: hyaluronic acid
HBS: heparin binding site
HEPES: N-2-Hydroxyethylpiperazine-N’-2-ethanesulphonic acid
HRP:Horseradish peroxidase
HS: heparan sulfate
HSPGs: heparan sulfate proteoglycans
GAG: glycosaminoglycans
GlcNAc: N-acetylglucosamine
GlcNS: N-sulfoglucosamine
IdoA: L-iduronic acid
IPTG: isopropyl β-D-1-thiogalactopyranoside
LB: lysogeny broth
Lys-lysine
MTT:3-(4, 5-dimethylthiazol-2-yl)-2, 5-diphenyltetrazolium bromide
MW: molecular weight
xiv NHS: N-hydroxysuccinimide
PAGE: polyacrylamide gel electrophoresis
PBS: phosphate-buffered saline
PCR: polymerase chain reaction
PDB: protein data bank
PGO: phenylglyoxal
PI: phosphatidylinositol
RE: reducing end
RM: routine medium
Rama: rat mammary
SD: standard derivation
SDM: step down medium
SDS: sodium dodecyl sulphate
SE: standard error
SRCD: synchrotron radiation circular dichroism
TB: Terrific Broth
TCA: trichloroacetic acid
xv TFA: trifluoroacetic acid
TM: Melting temperature
Tris: Tris (hydroxymethyl) methylamine
1
Chapter 1 General Introduction
1.1 The discovery of FGFs
In 1974, the term fibroblast growth factor (FGF) was first used by Gospodarowicz to
describe a polypeptide found in pituitary and in brain that stimulated the initiation of
DNA synthesis in resting 3T3 fibroblasts [1]. This was purified from both of these sources and was termed basic FGF (bFGF), because the protein was basic and
stimulated mitogenesis in 3T3fibroblasts [2, 3]. Subsequently, brain tissue was found to also contain a second molecule with FGF activity, which was called acidic FGF
(aFGF), because its isoelectric point was the opposite to that of bFGF’s [4]. Thereafter, additional FGFs were identified and isolated by a variety of methods.
According to the number-based nomenclature system, aFGF and bFGF were
renamed as FGF1 and FGF2, respectively. FGF3 (int-2) [5], FGF4 (kFGF/hst) [6], FGF5 [7] and FGF6 [8] were originally isolated as oncogene products. FGF7 was identified as keratinocyte growth factor (KGF) with the distinctive properties of a
mesenchyme-derived stimulator of epithelial cell growth [9]. FGF8 was isolated and characterized as causing unusual male sex hormone-dependent growth of mouse
mammary carcinoma cells [10]. After a series of analyses of cDNA structure, Miyamoto et al. determined that glia-activating factor (GAF) was the ninth member
of the FGF family, FGF9 [11]. FGF10 was isolated from rat embryos by homology-based polymerase chain reaction (PCR) [12]. Four further members of the FGF family, called FGF homologous factors (FHFs), FGF11 (FHF3), FGF12 (FHF1), FGF13
(FHF2) and FGF14 (FHF4) were found by a combination of random cDNA
2 laboratory successfully isolated and identified FGF16, FGF17, FGF18, FGF20, and
FGF21 by homology-based polymerase chain reaction [14], [15], [16], [17], [18]. FGF19, FGF22 and FGF23 were originally isolated by searching genome data bases [19], [20],
[21]
. Parallel discovery, allied to rapid analysis following completion of the human
genome project resulted in the finding that human FGF19 correspond to mouse
FGF15; there is no human FGF15 or mouse FGF19 [22].
1.2 Evolution of the FGF gene family
The fgf genes have not been found in unicellular organisms such as Escherichia coli
and Saccharomyces cerevisiae. After sequencing of the Caenorhabditis elegans and
Drosophila genomes, two (egl-17 and let-756) and three (branch-less, pyramus and
thisbe) FGF genes were identified, respectively [23-27]. Six fgf-like genes were then identified in a basal chordate, the ascidian Ciona intesinalis thatare considered to be
potential ancestral genes of human FGF subfamilies, which include fgf4-like,
fgf5-like, fgf8-fgf5-like, fgf9-fgf5-like, fgf10-like and fgf13-like[28]. Twenty-two fgf genes have been identified in the human, mouse and zebra fish fgf families [29]. The ancestral genes of
fgf gene subfamilies have been hypothesized to be the result of gene duplication
following the divergence of protostomes and deuterostomes [30]. A model of the evolutionary history of the fgf gene family has proposed that gene expansion presents
in two phases (Fig. 1.1). In the first phase, there was gene duplication of the fgf gene
from two or three to six genes during the early evolution of metazoans. In the second
phase, the full complement of vertebrate genes was generated by two large-scale
3 Figure 1.1 Possible evolutionary relationships between the fgf genes. The fgf13-like is the ancestral gene of the whole fgf gene family. The fgf4-like was generated by
gene duplication from fgf13-like at an early stage. In the first phase (phase I),
fgf5-like, fgf8-fgf5-like, fgf9-fgf5-like, fgf10-like and fgf15/19-like were generated by gene
duplication. All of these expanded into three or four members by two large-scale
4
1.3 Phylogenetic and gene location analysis of the
human/mouse
fgf
gene family
The fgf evolutionary relationship has been determined by the analysis of gene
location on chromosomes [29, 30, 32, 33]. Seven fgf subfamilies have been suggested by gene location analysis: fgf1, fgf2 and fgf5; fgf3, fgf4 and fgf6; fgf7, fgf10 and fgf22;
fgf8, fgf17 and fgf18; fgf9, fgf16 and fgf20; fgf11, fgf12, fgf13 and fgf14; fgf15/19,
fgf21 and fgf2 (Fig 1.1).
Apart from gene location analysis, phylogenetic analysis has also been applied to
determine the relationship of FGFs from their amino acid sequence(Fig 1.2) and also
indicates that there are seven subfamilies: fgf1 and fgf2 (fgf 1 subfamily); fgf4, fgf5
and fgf6 (fgf4 subfamily); fgf3, fgf7, fgf10 and fgf22 (fgf7 subfamily); fgf8, fgf17 and
fgf18 (fgf8 subfamily); fgf9, fgf16 and fgf20 (fgf9 subfamily); fgf11, fgf12, fgf13 and
fgf14 (fgf11 subfamily); fgf15/19, fgf21, and fgf23 (fgf19 subfamily) (Fig. 1.2). The
members of the fgf8, fgf9, fgf11 and fgf19 subfamilies are consistent with the
phylogenetic and gene location analyses. However, fgf5 and fgf3 are indicated to be
members of fgf4 subfamily and fgf7 subfamily, respectively, by phylogenetic
analysis. The phylogenetic relationship based on sequence maps to functional
5 Figure 1.2 Evolutionary relationship tree of FGF family. According to amino
acid sequence, Dendroscope was used to show that FGF family is divided into seven
subfamilies. The branch lengths relate directly to the evolutionary relationship of
[image:21.595.122.495.72.517.2]6
1.4 FGF ligands
1.4.1 FGF ligand structure
The molecular weights of the FGFs range from 17 to 34 kDa in vertebrates, whereas
it reaches 84 kDa in Drosophila. All FGFs share an internal core of similar structure
with 28 highly conserved, and 6 invariant amino acid residues [36]. X-ray crystallography of FGFs shows that the FGF family possesses a similar folding
pattern to the interleukins IL-1β and IL-1α [37]. FGFs possess a β trefoil structure, which is formed by three sets of four β strands connected by loops (Fig. 1.3) [38]. A variety of studies have demonstrated that the primary heparin binding site of FGF2 is
formed by the strand β1/β2 loop, strands β10 / β11 loop, strand β11 and strands β11 / β12 loop (Fig. 1.4) [38-42]
. The receptor tyrosine kinase (FGFR) binding site involves
the strand β8-β9 loop and is distinct from the heparin binding site. This suggests that
receptor binding and the binding of heparin and HS are likely to be physically
7 Figure 1.3 Schematic diagram of the core structure unit of the β-trefoil motif.
The first ascending strand (βA) is connected to a descending strand (βB). The
following “horizontal” strand (βC) is connected to the return strand (βD). Three of
these units arranged around a pseudo three fold axis of symmetry form the β trefoil.
Figure 1.4 Ribbon diagram of crystal structure of FGF2. PDB ID: 2FGF [38]. The β trefoil structure is made up of 12 anti-parallel β strands. The structure of FGF2 was
generated from the crystallographic coordinates with PyMol. The heparin binding
8 1.4.2 The functions of FGFs
According to their mechanism of action, FGF activities can be classified into three
types: intracrine, paracrine and endocrine. The paracrine FGF subfamilies are the
FGF1 and FGF2; FGF3, FGF7, FGF10 and FGF22; FGF4, FGF5 and FGF6; FGF8,
FGF17 and FGF18; FGF 9, FGF16 and FGF20. Most of these members of the FGF
family have a cleavable N-terminal secretory signal peptide for export through the
classical endoplasmic reticulum (ER)/ Golgi pathway. However, FGF1 and FGF2,
which have no secretory signal peptide and have been shown to be exported from
cells through mechanisms independent of the conventional endoplasmic reticulum -
Golgi pathway [43-46]. Although members of FGF9 subfamily share the classical secretory pathway, they do not have a cleavable signal sequence. Instead, they
possess a bipartite secretory signal sequence for their interaction with the secretory
machinery [47, 48].
The paracrine FGFs all bind strongly to HS, a major glycosaminoglycan in
pericellular and extracellular matrix, through their heparin binding sites. This
interaction limits their radius of diffusion so consequently these FGFs exert their
biological effects near their source of synthesis. The intracrine FGFs are the
members of the FGF11 subfamily that are expressed in cells as intracellular proteins.
The intracrine FGFs have been shown to have a crucial role in regulation of the
9 this context they all have at least one non-redundant biological function (Table 1.1)
[33, 55, 56]
.
Table 1.1 Summary of some physiological roles of FGF.
Reference for each FGF (FGF1 [56]; FGF2 [57-62]; FGF3 [63]; FGF4 [64-66]; FGF5 [67-69]; FGF6 [70, 71]; FGF7 [72, 73]; FGF8 [74-76]; FGF9 [77, 78]; FGF10 [79]; FGF16 [80]; FGF17
[81]
10
1.5 Heparin/Heparan sulfate
1.5.1 Heparin/heparan sulfate structure
Heparan sulfate (HS) is a member of the family of glycosaminoglycans (GAGs),
containing repeating disaccharide units joined by 1-4 linkages. As well as HS, the
GAG family includes hyaluronic acid (HA), chondroitin sulfate (CS), dermatan
sulfate (DS) and keratan sulfate (KS). The complex structure of HS distinguishes it
from other GAGs [102]. The repeating units of HS consist of a glucuronic acid (β-D-GlcA) or its C5-epimer α-L-IdoA, and α-D-glucosamine (GlcN). The glucosamine
may be N-acetylated (GlcNAc), N-sulfated (GlcNS), or unsubstituted (GlcN).
O-sulfation can occur at position 2 of the uronic acid and position 3 and 6 of the
glucosamine (Fig. 1.5). Heparin shares the same repeating disaccharide units as HS,
but presents a far more homogeneous and higher level of sulfation [103]. Since it shares similarity in structure and is commercially available, heparin or its derivatives
11 Figure 1.5 Heparin/HS disaccharide units. The repeating units of HS consist of a
uronic acid (β-D-GlcA) or its C5-epimer α-L-IdoA, and D-glucosamine (α-GlcN). R1
can be H, COCH3 or SO3- ; R2/3/4 can be H or SO3-.
1.5.2 Heparin/HS biosynthesis
The pathway of biosynthesis of HS can be divided into three sets of reactions: chain
initiation, chain polymerization and polymer modification. Its biosynthesis occurs in
the Golgi apparatus and begins with a linker tetrasaccharide being assembled on a
specific serine residue of newly translated core proteins. Subsequently, the
polymerization of the heparin/HS chain is performed by alternate addition of
glucuronic acid and N-acetyl glucosamine to the non-reducing end of the growing
polysaccharide. The repeated addition of these two saccharides is catalyzed by the
tumor suppressor EXT family genes (EXT1 and EXT2) that form a stable
N-12 deacetylase / N-sulfotransferases (NDSTs) catalyses the replacement of the N-acetyl
group of glucosamine with a sulfate group. The presence of N-sulfate marks this
disaccharide and the adjacent ones for further modifications. The C5 epimerization
of glucuronic acid to iduronic acid through the C5 epimerase has been shown to only
happen to the GlcA substrate that is attached to the reducing end of a GlcNS residue
[107]
. O-sulfation can then take place on position 2 of the uronic acid and position 3
and 6 of the glucosamine, catalysed by 2-O, 3-O and the 6-O sulfotransferases [108,
109]
. Any GlcNS can be the substrate for 6-O sulfotransferases, whereas the
2-O-sulfotransferases cannot modify the IdoA attached to GlcNS(6S), which indicates
that the 6-O-sulfation of GlcNS follows the 2-O-sulfation of IdoA [110]. The action of the N-deacetylase / N-sulfotransferases (NDSTs) is clustered. Thus, they will ignore
a sequence of saccharide, and then act on alternating disaccharides, followed by
every sequential disaccharide, and then alternating ones and so on. Since all the other
modifications depend on the presence of N-sulfated glucosamine, the result is that
HS chains have a domain structure: NA domains with no sulfation structure, NS
domains of highly sulfated structures, and NA/NS domains comprising mixed
regions of GlcNAc and GlcNS. The sulfated structures are of functional significance,
forming the protein binding sites. Heparin chains contain more GlcNS residues than
HS (the ratio of GlcNS to GlcNAc is around 4:1 in heparin and 1:1 in HS) and also
contain more sulfated structures at an average of 2.4 sulfates/disaccharide than HS,
which has O-sulfate structures in the range of 0.2-0.7 O-sulfate/disaccharide [103]. The sequential application of the biosynthetic enzymes does not readily explain such
disaccharides as GlcA-GlcNAc6s or IdoA-GlcNAc6s, which have been found. An
alternative view, implying enzymes capable of such conversion, has been proposed
13 1.5.3 The functions of Heparin/HS
The HS chains are always synthesized attached to a core protein to form heparan
sulfate proteoglycans (HSPGs) [112]. It is the core protein that directs the HS chains to specific locations, the cell surface or the extracellular matrix, where the
polysaccharide chains bind and regulate the activity of proteins (883
HS/heparin-binding proteins identified to date [113, 114]). Thus, a large body of evidence demonstrates the function of HSPGs in many signalling pathways. For example,
mutations in the Drosophila of genes encoding sugarless (sgl) and sulfateless (sfl)
have been shown to have similar phenotypes as Wingless (Wg) or Hedgehog (Hh)
signalling mutants [115]. In addition, the HS biosynthetic enzymes in Drosophila, Tout-velu (ttv), Sister of ttv (sotv) and brother of ttv (botv) are also required for Wg
signalling gradient formation [116]. Indeed, studies of morphogen activity have shown the function of HSPGs in regulation of morphogen movement and intercellular
trafficking [117]. A model of morphogen mobility suggests morphogen proteins can move from regions of high concentration to ones of low concentrations regions by
transferal from one HSPG to the next in the pericellular matrix [118].
HS regulates several aspects of FGF function. The interaction of paracrine FGFs
with HS is absolutely required for the formation of an efficient signalling complex
with the FGFRs. Thus, HS was shown to be required for FGF2 to stimulate cell
division in heparan sulfate-deficient Chinese hamster ovary (CHO) cells [119]. The same result was obtained by treating cells with heparitinase or culturing cells in
sodium chlorate to block sulfation of heparan [120]. However, experiments on overexpression of branchless in Drosophila suggested that FGFR can be activated by
14 been measured in cell cultures in the absence of HS [121-123]. Nonetheless, in all cases the usual paracrine FGF biological response (development of the trachea, cell
division) required HS. Thus, the above work is also the first genetic evidence to
show that HS is essential for normal FGF signalling in vivo[122].Additional studies have shown that the function of HS may be to stabilize the active receptor complex
for enough time for it to signal [36]. Moreover, structure defined oligosaccharides have also shown to differently activate FGFs, which indicates that different FGFs are
likely to possess distinct affinities for unique HS structures [124, 125].
The role of heparan sulfate intracellular has also been explored. Intracellular heparan
sulfate was first identified in the nucleus of hepatoma cells [126]. This HS was found to be enriched in 2-O sulfated glucuronic acid residues and to correlate with the
control of cell growth and to originate from the extracellular space [126-128]. Since, intracellular HS binding proteins have been identified. For example, the catalytic
activity of topoisomerase I, which changes the superhelical state of duplex DNA, has
been shown to be inhibited by interaction with heparan sulfate [129]. Indeed, many nucleic acid binding proteins also bind heparin and presumably heparan sulfate. This
is not surprising, since the sugar phosphate backbone of nucleic acids is analogous
the sulfated glycosaminoglycans. Recently, the translocation of 3-O-sulfated heparan
sulfate from the extracellular space to the neuronal cytoplasm has been shown,
caused by the overexpression of 3OST2. This heparan sulfate binds to tau, which leads to the latter’s hyperphosphorylation, a molecular change that drives
Alzheimer’s disease [130]
. The intracellular presence of HS is established and some
15 particularly with nucleic acid binding proteins have often only been demonstrated in
vitro and whether they occur in the cell remains to be established.
Other functions of HS are demonstrated by genetic diseases associated with
mutations in the genes encoding some of the biosynthetic enzymes. The EXT1 and
EXT2 genes, whose products catalyse the elongation of the HS chain, have been
shown to be tumour suppressor genes. Thus, studies of sporadic and exostosis
derived chondrosarcomas show that a loss of heterozygosity for chromosomes 8 and
11 markers linked to EXT1 and EXT2 loci causes the disease [131, 132]. Idiopathic hypogonadotropic hypogonadism (IHH) is associated with mutations in heparan
sulfate 6-O-sulfotransferase 1 (HS6O1) and has been linked to idiopathic
hypogonadotropic hypogonadism pathogenesis by both Kallmann syndrome 1
(KAL1) -dependent and -independent mechanisms [133].
1.6 FGF receptors
1.6.1 FGF receptors
The FGFRs are encoded by five fgfr genes, fgfr1-fgfr4 and fgfr-L1, which have been
identified in humans, mice and zebrafish. Four of these receptors, fgfr1-fgfr4 encode
tyrosine kinases (ca.800 amino acids) [31, 55]. One and two fgfrs genes were identified in C. elegans (egl-15) and Drosophila (breathless and heartless), respectively. The
receptor contains an extracellular region with three immunoglobulin domains (I, II,
16 1.6). The related fgfr gene, fgfr-L1 (also called FGFr5) lacks an intracellular tyrosine
kinase domain.
There are a large number of alternative RNA splicing events that generate different
FGFR isoforms. The latter include two or three Ig loop isoforms that lack the D1 Ig
domain and in some cases, e.g. Drosophila heartless, the gene only encodes this two
Ig loop isoform [31]. In mammals there are three different exons encoding the C-terminal half of D3, Ig loop 3 in FGFR 1, 2 and 3. One, the “a” exon, encodes a
secreted receptor extracellular domain while the “b” and “c” exons alter the sequence
of D3 of the transmembrane receptor and provide a means to impact on ligand
selectivity, such that the fgfr gene product can recognise preferentially different FGF
ligand subfamilies [134, 135]. Immunoglobulin domain I and the adjacent acid box have no independent FGF ligand binding activity, but play an important role in receptor
auto-inhibition [136] and in binding an alternative set of ligands, the cadherins [137]. FGF ligands mainly interact with the immunoglobulin domains II, III and the linker
17 Figure 1.6 FGFR domain structure. There are three immunoglobulin domains (I,
II, and III). The heparin binding site is colored orange on domain II. The black box
between domains I and II is the acid box. FGF binds to Ig II and most FGFs ligands
interact with the adjacent surface of Ig III. The green region is the alternatively
18 1.6.2 FGF signalling pathway
The dimerisation of FGFR induced by engagement of the FGF ligand and HS
co-receptor allows the transphosphorylation of the activation loop of the intracellular
tyrosine kinase domain. Subsequent transphosphorylations by the activated FGFR
kinase occur on other tyrosine residues on the intracellular domain of the receptor
that act as docking sites for the initiators of intracellular signalling pathways. In
addition the FGFR kinase phosphorylates tyrosine residues on the adaptor protein
fibroblast growth factor receptor substrate 2α (FRS2α) and on the phosphatase SHP2.
FRS2 binds the juxtamembrane region of the FGFR and this interaction does not
require phosphorylated tyrosine, while SHP2 binds to phosphorylated FRS2. The
growth factor receptor-bound protein 2 (GRB2) binds to either phosphorylated
tyrosines on the FGFR or on FRS2. The adaptor protein GRB2-associated binding
protein 1 (GAB1), commonly associated with the hepatocyte growth factor/scatter
factor receptor MET also bind to FRS2, and when phosphorylated on tyrosine
residues by the FGFR acts as a further binding site for GRB2. The bound GRB2 in
turn binds son of sevenless (SOS), which recruits RAS, leading to activation of
mitogen-activated protein kinases (MAPK) via the kinases RAF and mitogen
activated protein kinase kinase (MEK). GAB1 is essential for binding and activating
phosphatidyl inositol 3 kinase (PI3K), which causes the downstream
phosphorylation and activation of the AKT pathway. In terms of the signal outcome
of the FGFR, the GRB2-MAPK pathway is associated with cell division, whereas
the PI3K/AKT pathway is associated with cell survival and cell fate determination
[138-140]
. Another well-established pathway is that of PLCγ, which binds directly to a
phosphorylated tyrosine residue in the FGFR (tyr-766 in FGFR1). PLCγ is
19 diacyglycerol (DAG) by the hydrolysis of phosphatidylinositol, leading to the
IP3-mediated release of calcium from the endoplasmic reticulum. Calcium ions and DAG
together cooperate to activate protein kinase C (PKC). Even though the physiological
role of this pathway is not well elucidated, it has been shown to be involved in cell
adhesion[141].
The RAS-MAPK, PI3K and PLCγ pathways are the most studied and best described
ones leading from the activated FGFR. These pathways cause changes in the
activity of downstream kinases, phosphatases and proteins that result in the
biological output of the FGF ligand. Generally, this is cell division or cell migration
[140-143]
, but this may be a bias due to these being the most studied changes in cell
behavior in the growth factor field.
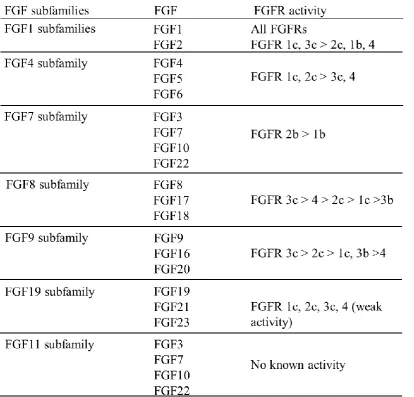
1.6.3 Specificity of FGF and FGFR interactions
Except for FGF1, which interacts with all FGFRs and their isoforms, all other FGFs
exhibit a greater or lesser degree of receptor and receptor isoform selectively (Table
1.2). Although there is usually no absolute specificity (a notable exception is FGF7,
Table 1.2), it is the case that FGFs from the same subfamilies have a clear preference
to bind particular FGFR isoforms, whereas FGFs from different subfamilies differ in
this respect (Table 1.2). The expression of at least some FGFR isoforms is tissue
specific: for example, FGFR b isoforms are generally expressed in the epithelial
compartments, while the FGFR c isoforms are normally produced in the
mesenchymal tissue compartment. A general theme is that the FGFs expressed in
epithelial or mesenchymal tissues interact with FGFR produced in the opposite tissue
[55]
20 Table 1.2 FGFR binding specificities of FGFs. Data from Ornitz et al. and Zhang
21
1.7 Models for complexes of FGFs and their receptors
There have been many studies aimed at establishing what the exact role of HS may
be in the formation of signalling complexes with the FGFR. Although there is
currently a consensus view on the role of HS, only some of the contradictory body of
data has been resolved, a number of proposals exist to explain how the signalling
complex is formed, and open questions remain.
Based on the idea that the FGF ligand has to cause dimerisation of the FGFR to
activate the tyrosine kinase, there are data indicating that binding of the FGF to HS
causes dimerisation of the former. A dimeric ligand would enable receptor
dimerisation. Heparin induced oligomerisation of FGF1 [144] and cis dimers of FGF2 was demonstrated on a heparin octasaccharide, but not on shorter structures such as a
disaccharide or a tetrasaccharide [145, 146]. This suggested that the specific side-by-side heparin-induced FGF2 dimer would be the minimal active structure required for its
biological activity. In support of the dimersation model, an asymmetric
crystallographic co-complex of 2:1:2 FGF1: heparin decasaccharide: FGFR complex
has been proposed [147]. This ‘asymmetric’ model was formed by the dimerization of two FGF-FGFR complexes induced by heparin. Moreover, the decasaccharide
interacts with both ligands in two 1:1 FGF1-FGFR2 complexes, but with just one of
two receptors (Fig. 1.7B). In this and the symmetric model (see below) the atomic
contacts between molecules are preserved, but the relative orientation of the
receptors is quite different. Due to the lack of the contact between proteins, the role
of heparin seems to be critical in the assembly of the ‘asymmetric’ complex [147]. Biophysical analysis was performed to validate the asymmetric model. This
22 However, the dimerisation of FGFs on heparin and derived oligosaccharides requires
a very high concentration of FGFs, where it is well established that the multivalency
of the polysaccharide enables multiple FGFs to bind [148, 149].
An early biophysical analysis of FGF2 and FGFR1 using isothermal titration
calorimetry, ultracentrifugation, molecular modeling and site-directed mutagenesis
indicated that FGF2 binds to two receptors and one HS (FGF2: FGFR1: HS, 1:2:1)
[150]. The affinity of FGF2 for FGFR1 was increased 10-fold by the presence of the
heparin. In this model, the second FGFR1 was recruited to a secondary low affinity
binding site on FGF2 with heparin stabilizing the complex (Fig. 1.7A). Since the
second binding site of FGF2 has 250-fold lower affinity compared with the primary
binding site mutation of the second binding site did not change measurable FGFR
binding, but did cause a reduction of its mitogenic activity [151]. A similar effect was observed in FGF7 when point-mutations were proposed in the low affinity binding
sites located loop between strands β9 and β10 [152]. This model, called “the growth hormone model” due to its mechanism being analogous to that of growth hormone,
has since fallen out of favour, but there are as yet, no data to contradict it. One
uncertainty, however, is whether some of the residues contributing to the secondary
FGFR binding site on the FGF2 are also involved in the packing of the hydrophobic
core of the protein, hence the absence of mitogenic activity seen when these residues
are mutated, which may be due to a loss of stability of the FGF2.
The current consensus model is called the symmetric model and is based on data
from co-crystals of a 2:2:2 complex of FGF2, a heparin-derived hexasaccharide and
the extracellular Ig loops Ⅱ and Ⅲ of FGFR1, this is called the ‘symmetric’ model
23 FGF2 and FGFR1 to form a 1:1:1 complex. After that, dimerization of the two
complexes is mediated by direct FGFR-FGFR interaction and secondary interaction
between ligand in one ternary complex and receptor in the other ternary complex,
with the FGF-FGFR interaction regulated by the sugar. It is important to note that
these secondary contacts between FGF and FGFR are different from those in the
growth hormone model. Since the non-reducing ends of both oligosaccharides face
each other, this model was also called ‘two-end’ model [113]. The direct FGFR-FGFR and the secondary FGF-FGFR interaction were not sufficient for appreciable
dimerization of the FGFR without the polysaccharide [112]. It is worth noting that, although the arrangements of the components differ in the symmetric and
asymmetric models, the atomic contacts between FGF, heparin oligosaccharide and
FGFR are very similar. Interestingly, in the symmetric model, the atomic contacts of
the low affinity secondary FGFR binding site of FGF2 of the growth hormone model
are free and exposed to solvent.
There may be more than one functional complex. For example, Zhu et al. (2010),
provided evidence for different signalling complexes forming on fibroblasts with
FGF2 and the endogenous FGFR1 [121]. These different intracellular signals are identified due to differences in signalling observed for complexes of FGF2: FGFR1
24 Figure 1.7 Models of FGF signalling complexes. Heparin chains are coloured
black. FGF is coloured green. For FGFR, only the Ig II (D2) and Ig III (D3) domains
are shown, coloured in purple. A, the growth hormone model; B, the ‘asymmetric’
model; C, the ‘symmetric’ model.
One fundamental difference between the ‘symmetric’ and ‘asymmetric’ model is the
conformation of the invariant proline residue in the D2-D3 linker region. The
invariant proline in the ‘symmetric’ model assumes a trans conformation, whereas
the proline in the ‘asymmetric’ model is in cis. The cis and trans proline
conformations were proposed to represent the active and inactive state of FGFR,
respectively [147]. These two models have also been analysed in solution using size-exclusion chromatography, analytical ultracentrifugation and mass spectrometry.
This work suggests that both structures were present, but that the ‘asymmetric’
model complex predominates [153]. However, the FGFR with cis proline was used, so an alternative interpretation, given that the symmetric complex was detected, is that
the latter is physiologically relevant. Moreover, the disruption of the low affinity
FGFR binding site of FGF caused a reduction in cell signalling, which supported the
25 of Ni2+ ions in the crystallization buffer, so pushing the equilibrium between these two proline conformations towards to cis, which supports the idea that this may be
an artefact of expression and purification [155].
1.8 Specificity of FGF and HS interactions
Heparan sulfate is a key regulator that controls the functions of a large number (883)
of extracellular regulatory proteins [114, 156] (Section 1.5.3). FGFs are heparin-binding proteins and interactions with HS determine their transport between cells, as well as
the assembly of signalling complexes with cognate FGFRs. In mammals, there are 18 FGFs involved in mediating cell-cell communication by interaction with HS and
FGFR on target cells (Section 1.3). In the fly Drosophila and the worm C. elegans,
there are just two or three FGF ligands and one fgfr alongside HS (Section 1.2). It
seems reasonable that to develop and maintain the more complex bodies of
vertebrates and mammals, having 18 FGFs and 5 fgfrs with HS is necessary and has
arisen by natural selection. In studies on binding of modified heparin fragments (all
containing N-sulfate groups) to FGF1, FGF2 and FGF4, the results showed that
FGF2 required 2-O-sulfate rather than 6-O-sulfate for binding. FGF1 was more
promiscuous and could bind structures with either 2-O-sulfate or 6-O-sulfate and
FGF4 could bind at high concentration oligosaccharides lacking 2-O-sulfate or
6-O-sulfate [124, 125, 157]. Moreover, experiments are carried out in vivo have shown that FGFs clearly bind to different tissue compartments, e.g., in mammary gland FGF2
was found to bind more extracellular matrix HS surrounding duct and less to the
matrix surrounding the terminal end buds where the ductal tree is elongating and
26 growth-stimulatory effects of FGF1 and FGF2, for example in 3T3 cells [159].
It remains the case, however, that the level of specificity for binding HS is still
debated. One school, drawing on the perceived high specificity of the interaction of
antithrombin III with a pentasaccharide in heparin, contends that there are rare and
unusual sequences of saccharides in HS, and related heparin, responsible for high
affinity binding of the proteins [160, 161]. Another school contends that largely non-specific ion-exchange interactions underpin protein binding by the polysaccharide
[162, 163]
. After crystallographic analysis of the amino acid residues located in the
binding region of heparin and FGFs, it was shown that no single residue in the
primary canonical heparin binding site is completely conserved throughout the FGF
family [40], indicating that there has either been genetic drift or natural selection. In early studies, an octasaccharide from heparin had been suggested to be the minimal
length oligosaccharide to induce the assembly of FGF2-FGFR1/2 and its biological
activities [125, 164, 165], though later heparin-derived tetrasaccharides were found to be functional [123]. However, with oligosaccharides derived from HS, octasaccharides were the minimal active length [166]. In contrast, the deduced dimerization of FGFR2b induced by FGF7 required heparin-induced oligosaccharides longer than dp
8 [167]. Chemically modified heparins were used with FGF1 and FGF7 to show that FGF1-dependent dimerization of FGFR2b was enabled by 6-O- and 2-O-desulfated
heparins, whereas neither of these polysaccharide could enable FGF1-FGFR1 or
FGF7-FGFR2b to stimulate cell growth, which suggested that there may be a high
degree of specificity in the formation of ligand-receptor complexes [167]. In the most comprehensive work, FGFs from five subfamilies were characterized in terms of
their heparin binding specificity at different levels: binding parameters, the heparin
27 FGFs and the secondary structure changes induced by heparin binding. With most of
the subfamilies represented by just one member, these data led to the hypothesis that
the differences in the preference of individual FGFs for particular heparin structures
and the type of secondary heparin binding site in the FGFs may be reflected in the
evolutionary relationship of the different subfamilies [34].
1.9 Aims
FGFs often serve as a model for understanding the consequences of the interaction of
HS with other proteins. Thus, the question of the specificity between FGFs and HS
has wide implications. Previous work has not been very systematic, generally
involving just one or two FGFs and a limited repertoire of GAG structures [124, 125, 162,
168]
. The FGF family of growth factors has expanded into clearly defined subfamilies
through a series of genome duplications and these have clear functional relationships
e.g. Table 1.1. Thus, the FGF family can be used as a defined system, subjected to
natural selection, to determine the level of specificity of interactions of FGFs with
GAGs. The existing work with six FGFs from five subfamilies suggests that there is
specificity in FGF- heparin interactions and this reflects the evolution of the FGF
family members, which parallels the specificity of FGF ligands for FGFRs [34, 169]. However, in this work only four of the five heparin binding FGF subfamilies was
analysed and for three of these there was only one FGF represented. Thus, the idea
that there is specificity in the interactions of FGFs with HS and that the
polysaccharide binding properties of the FGFs have been subjected to the some
selection pressure that led to their FGFR-binding specificities and functional
28 A major aim of this thesis is to substantiate or otherwise the above hypothesis. To
achieve this, at least two members of each paracrine subfamily have been produced
to provide a far more comprehensive coverage of the FGF family. The specificity in
their interactions of these FGFs with the polysaccharide has been determined in two
ways. Firstly, the preferences of FGFs for particular sugar structures has been
explored using differential scanning fluorimetry (DSF) and a library of chemically
modified heparins, heparin derived oligosaccharides and model glycosaminoglycans.
Secondly, the protect and label approach has been used to map primary and
secondary heparin binding sites in the FGFs [170]. The secondary heparin binding sites (HBS2 and HBS3) of FGF2 have also been characterized by exploring the sugar
structure preference and the biological activity of HBS mutants. Finally, a new
arginine targeted protect and label technique has been developed, which will be able
to identify these residues, which make a substantial contribution to the ionic bonding
29
Chapter 2 General materials and methods
2.1 Electrophoresis
2.1.1 Agarose electrophoresis
Agarose gels (1.2 %, w/v) were made by melting agarose (0.4 g) (Bioline, London,
UK) into 48 mL TAE buffer (40 mM Tris-Cl, 20 mM acetic acid, and 1 mM EDTA, pH 8). When the agarose had cooled slightly, 4 μL 10,000x SYBR (New England
Biolab, UK) was added into the agarose. The molten agarose was poured into the gel
making tray and allowed to cool. The samples and DNA ladder (1 kb New England
Biolab, Herts, UK) were loaded on the gel after the gel tray was placed in the gel
tank and covered with TAE buffer. Electrophoresis was carried out at 100 V, 30 min
for each gel.
2.1.2 SDS-PAGE
Samples were analyzed by PAGE by mixing them with 1/5 volume of 5x
SDS-PAGE loading buffer (50 % (v/v) glycerol, 10 % (w/v) SDS, 25 % (v/v)
2-mercaptoethanol in 0.3 mM Tris-Cl, pH 6.8 and coloured with bromophenol blue).
Then, they were heated at 95°C for 3 min and centrifuged for 5 min at 12,000 x g.
Typically, 10 µL sample and SDS-PAGE marker (SDS7-1VL, Sigma) were loaded
onto a 12 % (w/v) SDS-polyacrylamide gel (Table 2.1) and the gels were run at 30
mA (per gel), 200 V for 50 min with running buffer (50 mM Tris-Cl, 192 mM
30 Table 2.1 SDS-PAGE
Resolving Gel (ingredients for 12 % gel) Total 10 mL
Acrylamide/ bis-acrylamide stock (30 %, w/v) 4.0 mL Tris-HCl (3 M), pH 8.85 2.5 mL Water 3.5 mL 10 % Sodium dodecyl sulphate (SDS) w/v 100 µL TEMED (N, N, N’, N’, Tetramethylethylene diamine) 10 µL Ammonium persulphate 50 mg/mL (freshly made) 100 µL Stacking Gel Total 10 mL
Acrylamide/ bis-acrylamide stock (30 %, w/v) 1.3 mL Tris-Cl (1.25 M), pH 6.8 1 mL Water 7.7 mL 10 % Sodium dodecyl sulphate (SDS) w/v 100 µL TEMED 20 µL Ammonium persulphate 50 mg/mL (freshly made) 100 µL
2.1.3 Western Blot
After separation of polypeptides on 12 % (w/v) SDS-polyacrylamide gels, the gels
were packed against a PVDF membrane in a sandwich with pads. Proteins were
transferred at 100 V for 60 min in transfer buffer (25 mM Tris-Cl, 192 mM glycine,
20 % (v/v) ethanol). The membrane was then blocked with 5 % (w/v) skimmed milk
powder in TBST (50 mM Tris-Cl, 150 mM NaCl, 0.05 % (v/v) Tween 20, pH 7.5)
for 1 h. The membrane was washed three times with TBST to remove excess milk
31 Technology, Beverly, MA, USA) (1: 1000 dilution in TBST) on a shaker at 4°C.
Following three washes with TBST, HRP-linked anti-rabbit IgG (Sigma, Gillingham,
Dorset UK) (1: 5000 of a 1 mg/mL stock) was added to the membrane in TBST and
incubated for 1 h at room temperature. After three washes with TBST, the membrane
was covered with 1 mL ECL solution (GE Healthcare Life Sciences,
Buckinghamshire, UK) and signal was detected with Hyperfilm (Fujifilm UK Ltd.
Bedford, UK). The same membrane was re-blotted with anti-β-actin (Sigma, UK) as
control after stripping with a solution containing 0.1 % (w/v) SDS, 1.5 % (w/v)
glycine, and 1 % (v/v) Tween 20. The membrane was incubated twice with this
solution at room temperature for 7 min, followed by washing twice with PBS (137
mmol/L NaCl, 2.7 mmol/L KCl, 10 mmol/L Na2HPO4 • 2 H2O, 2.0 mmol/L KH2PO4,
pH 7.4). After two more washes with TBST, the membrane was ready for further
incubations with antibodies.
2.1.4 Coomassie Staining and Destaining
The gels were incubated in Coomassie stain (50 % (v/v) methanol v/v, 10 % (v/v)
acetic acid, 0.25 % (w/v) CBB R-250) for 60 min, then soaked in de-staining buffer
(30 % (v/v) methanol, 10 % (v/v) acidic acid) until the bands became clear.
2.1.5 Silver staining
After electrophoresis, the gels were soaked in fixative (40 % (v/v) ethanol, 10 % (v/v)
acetic acid) for 1 hour. Then, the gels were rinsed twice in 10 % (v/v) ethanol for 5
min and washed in water three times for 5 min each. The gels were then incubated in
0.02 % (v/v) silver nitrate solution for 30 min. After rinsing in water for 5 s, the gels
were washed once in freshly made developer solution (2.5 % (w/v) Na2CO3, 0.03 %
32 developer buffer and left on a shaker until bands were stained to the required
intensity. Stop solution (1 % acetic acid) was used to terminate staining and gels
were then washed with water six times for 5 min each. The gels were rinsed with
freshly made reducer (0.6 % sodium thiosulphate, 0.3 % potassium ferricyanide, 0.1 %
sodium carbonate) until the background became clear. Then the gels were quickly
washed in a large volume of water to remove the reducing buffer. Finally, the gels
were washed five times for 5 min each with water.
2.2 cDNA cloning
2.2.1 Polymerase chain reaction (PCR)
PCR was used to amplify cDNAs in 50 µL reactions, the reaction mixture and PCR
33 Table 2.2 PCR reaction setting
A, PCR reaction mixtures
Mixture Volume
Hot start polymerase buffer 5 µL 25 mM MgCl2 3 µL dNTPs 5 µL PCR Grade Water 31 µL Forward Primers 2 µL Reverse Primers 2 µL DNA template 1 µL Hot start polymerases (New England Biolabs) 1 µL Total 50 µL
B, PCR cycles
Stage1 Stage2 Stage3
34 2.2.2 DNA digestion
The target DNA was digested by two corresponding enzymes at 37°C overnight. The
ligation mixture is shown in Table 2.3.
Table 2.3 Digestion system
Mixture volume
DNA 5 µL NE Buffer 2 µL Water 1 µL NcoI-HF (New England Biolabs) 1 µL BamHI-HF (New England Biolabs) 1 µL Total 10 µL
2.2.3 Ligation
The insert and vector plasmid were ligated by T4 ligase (M0202L, New England
Biolads, UK) at room temperature overnight. The ligation condition is shown in
35 Table 2.4 Ligation system
Mixture volume
Vector 3.5 µL Insert 3.5 µL T4 ligase buffer 2 µL T4 ligase 1 µL Total 10 µL
2.2.4 Mutagenesis
The target fragments were designed by site-mutation of sequence of FGF2 and
bought from Life Technologies. Target fragments amplified by PCR with designed
primers were digested with NcoI-HF and BamHI-HF to produce the fragment to be
ligated with the vector, digested with the same enzymes. The ligated sample was
transformed into DH5 alpha cells and then large-scale cultures were used for
isolation of the target plasmid.
2.3 Protein expression
2.3.1 Materials
Lysogeny Broth (LB) culture medium (Merck, Watford, UK).
2xYT culture medium: 1.6 % (w/v) enzymatic digest of casein, 1.0 % (w/v) yeast
36 Terrific Broth (TB) medium: 1.2 % (w/v) tryptone, 2.4 % (w/v) yeast extract, 0.4 %
(v/v) glycerol, 0.17 M KH2PO4, 0.72 M K2HPO4.
2.3.2 Competent cell preparation
A single colony of selected bacteria (DH5 alpha/C41/BL21 (DE3)) was cultured in
40 mL of LB broth overnight at 37°C until the absorbance reached 0.3-0.5. The
culture were immersed in ice for 10 min and transferred to 4 pre-chilled sterile
centrifuge tubes and then centrifuged at 3800 x g for 10 min, 4°C. The pellets were
placed on ice for 10 min and re-suspended in 10 mL pre-chilled 0.1 M CaCl2. These
samples were placed on ice for a further 20 min, and then centrifuged, as above.
Finally, pellets were re-suspended in 2 mL 0.1 M CaCl2. Competent cells were
stored at -80°C.
2.3.3 Bacterial transformation
Seventy ng pETM-11 DNA and 70 µL competent C41 (DE3) or BL21 (DE3) plysS
were thawed on ice. They were then mixed together and incubated on ice for 30 min.
After a process of permeabilization induced by heat shock at 42°C for 1 min and
incubation for 2 min on ice, cells were added to 1 mL LB and cultured at 37°C for 60
min. The cells were collected by centrifugation (3800 x g) for 5 min and
re-suspended with 100 µL of LB and 10-25 µL of the cell suspension was plated into
LB-antibiotic (Ampicillin/Kanamycin) plates. These plates were incubated at 37°C
overnight.
2.3.4 Miniprep
A single colony from the plates was inoculated and cultured with 10 mL of LB
37 using a Qiagen miniprep kit 250 according to the manufacturer’s instruction (Qiagen,
Manchester, UK).
2.3.5 Sequencing
Plasmid DNAs (80-100 ng/µL) were sequenced by GATC sequence service (GATC,
UK).
2.3.6 Bacterial culture
A single colony was inoculated and cultured with 10 mL of LB/ 2xYT
broth-antibiotic at 37°C overnight (shaken at 240 rpm). Five ml of this culture was
transferred to 500 mL of LB/ 2xYT broth with antibiotic and then cultured at 37°C
with shaking (240 rpm) until the absorbance at 600 nm reached 0.5-0.9. At this point,
the cultures were induced with IPTG (1 mM final concentration) and grown at 37°C
(240 rpm) for 3 h, or overnight at 19.5°C (180 rpm). The bacteria were transferred to
pre-cooled 1 L centrifuge tubes and centrifuged for 15 min at 4,150 x g. The cell
pellets were re-suspended in PBS and transferred to 50 mL tubes. The cells were
then centrifuged again for 10 min at 3,800 x g. The supernatants were discarded and
pellets were stored at -80°C.
2.4 Protein purification
2.4.1 Cell breakage
Samples were thawed on ice with 5 volumes of lysis buffer (equilibration buffer for
the subsequent chromatography step) and transferred to a 50 mL glass beaker for
38 ice. Broken cells were centrifuged again in pre-chilled 50 ml centrifuge tubes at
38000 x g for 30 min. The supernatant was then used for the isolation of protein.
2.4.2 Chromatography
2.4.2.1 Heparin affinity chromatography
A column with 3 mL heparin resin (Affi-Gel Heparin, BioRad, UK) was equilibrated
with buffer (50 mM Tris-Cl, 0.4 M NaCl, pH 7.2) at a flow rate of 1 mL/min. After
cell breakage, the supernatant was filtered through a 0.45 µM filter and applied to
the column. The column was then washed with washing buffer Ah (50 mM Tris-Cl,
0.4 M NaCl, pH 7.2) and washing buffer Bh (50 mM Tris-Cl, 0.6 M NaCl, pH 7.2).
Elution was achieved by high ionic strength elution buffers Ch (50 mM Tris-Cl, 1.0
M NaCl, pH 7.2) followed by Dh (50 mM Tris-Cl, 1.5 M NaCl, pH 7.2). The
column effluent was monitored at 280 nM with an Econo UV monitor (Bio-rad,
Hertfordshire, UK).
2.4.2.2 Nickel affinity chromatography
A column of ProBond nickel-chelating resin (Invitrogen, Paisley, Scotland, U.K.)
was equilibrated with equilibration buffer (50 mM Tris-Cl, 0.02 M imidazole, 0.3 M
NaCl, pH 7.0). Then, the supernatant of disrupted cells was loaded onto this column
and washed with washing buffer An (50 mM Tris-Cl, 0.02 M imidazole, 0.3 M NaCl,
pH 7.2) and then washing buffer Bn (50 mM Tris-Cl, 0.1 M imidazole, 0.3 M NaCl,
pH 7.2) at a flow rate of 1 ml/min. A higher concentration of imidazole was used in
the elution buffers Cn (50 mM Tris-Cl, 0.25 M imidazole, 0.3 M NaCl, pH 7.2) and
Dn (50 mM Tris-Cl, 1.0 M imidazole, pH 7.2). The column effluent was monitored