Ben Richard Hughes, S.A.A. Abdul Ghani, A numerical investigation into the effect of Windvent louvre external angle on passive stack ventilation performance, Building and Environment, Volume 45, Issue 4, April 2010, Pages 1025-1036, ISSN 0360-1323, http://dx.doi.org/10.1016/j.buildenv.2009.10.010.
A Numerical Investigation into the Effect of Windvent Louvre External
Angle on Passive Stack Ventilation Performance
Ben Richard HughesandS A A Abdul Ghani
Sheffield Hallam University
Faculty of Arts, Computing, Engineering and Sciences Materials and Engineering Institute
Sheffield, South Yorkshire United Kingdom
S1 1WB
Keywords: - CFD, buildings, passive ventilation, natural ventilation, sustainable resources.
Abstract
The Windvent is a commercially available passive ventilation device. The device is constructed from sheet metal and works on the principle of pressure differential. Whereby warm air rises, creating a low pressure in the receiving room, which then draws in the fresh air. This paper investigates the effect of altering the external angle of the Windvent louvres against the internal pressure and velocity within the device and the micro climate velocity. Numerical analysis is carried out using a commercial Computational Fluid Dynamics (CFD) code, to investigate the effect of various louvre angles (range 10° - 45°) on pressure and velocity to optimise the device performance. The results show that the louvre
1.0 Introduction
The ventilation of buildings is an essential design consideration for reasons of Health and safety. The minimum recommended fresh air requirements for buildings are set out in British Standards (BS) and are applicable depending on the intended usage and occupancy levels. There are two main categories for ventilation strategies, namely mechanical and natural.
Natural ventilation relies on the external wind conditions to deliver the required fresh air supply with BS5925:1991 [1] setting out the minimum fresh air requirements for naturally ventilated buildings.
There are many strategies and devices for natural ventilation; one common device is a natural ventilation stack. The stack device sits at the top of the building or room and acts as both an inlet and extract. With warm air rising from the room and exiting through the stack a negative pressure is created in the receiving room and draws in the external fresh air supply. The flow of air through the device is further assisted by the windward and leeward pressures exerted on it by the external wind speed. The rate at which the flow is delivered to the receiving room is controlled by mechanical dampers and a static ceiling diffuser.
Figure 1 Cross section of a standard passive stack device (Courtesy of BSRIA)
A commercially available standard stack device, the Windvent, has been numerically investigated to ascertain its abilities to provide the recommended fresh air delivery rates [1]. The work shows that the device at the United Kingdom (UK) average wind velocity of 4.5m/s supplies far more than the recommended rate and would require significant control
Fresh air in Stale air out
PLAN VIEW
measures (Utilising the control dampers). Before attempting to employ a control strategy at the delivery point of the device, it is sensible to optimise the flow rate of external fresh air entering the stack.
As the device sits at roof level and is subject to prevailing wind, the louvers, and the angle of them specifically have an important role in the air movement in the inlet and exhaust ducts.
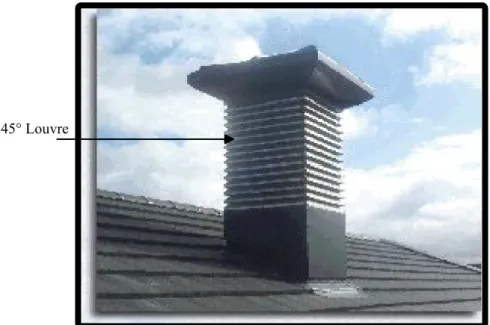
This work investigates the effect of altering the external louvre angle of the Windvent in order to optimise the fresh air delivery rate to the occupied space. The interface of the standard device between external wind conditions and internal delivery rate is a 45° angled thin louvre profile.
Figure 2Standard Windvent with a 45° Louvre
The louvers are angled against the prevailing wind, and may be considered as airfoils as they are subjected to the same lift and drag forces. However from aerodynamic theory [2] it is clear that flow separation occurs over the top surface of the airfoil when the angle of the airfoil, known as attack angle, exceeds a certain value, this is termed the stalling angle of attack.
In the case of the Windvent louvre, it may be considered as a thin airfoil which is subject to thin airfoil stall (see figure 3). This phenomenon is shown in the results section and is examined more thoroughly in the discussion section. Air flow separation Is a function of the prevailing airflow Reynolds number, the pressure drop through the void between two louver, louver geometry, any sharp edges on the louver, louver surface roughness and louver angle. As the flow upstream, down stream and through the device is inherently small, the Reynolds number is not considered as the major factor in micro flow separation. As the louvers are manufactured from the same material and of the same geometry, the louver geometry and in particular the louver angle is considered as the dominate factor in creating local flow separation. This phenomena is in complete agreement with the industrial report carried byNakanishiet al.[3].
Figure 3Example of flow separation causing thin airfoil stall [5]
A numerical investigation was carried out utilising Computational Fluid Dynamics (CFD) software to ascertain the optimum louvre attack angle to achieve maximum fresh air supply rates.
Eight CFD models were created with the louvre angle altered in 5° increments for a range of 10 - 45° to determine the optimum entry angle in order to maximise the fresh air delivery rate. Altering the louvre angle reduces the internal area of the device and effectively acts as an orifice plate by restricting the flow and increasing the pressure. In order to make a fair comparison, an equalising factor was introduced. This factor uses the standard Windvent volume as a benchmark and equates the reduced volumes to produce a factor which may be multiplied to the velocity and pressure results calculated.
2. Previous related work
Work related to specific natural ventilation devices and in particular stack systems is scarce, however the following is a brief review of previous work related to this study.
Jaboyedoffet al.[4], carried out research to analyse the indoor air quality and energy consumption levels of heating and cooling in administrative buildings.
The work developed models to accurately compare in a systematic manner, mechanical and natural ventilation strategies in various climates and internal conditions.
The work supports the development of naturally ventilated systems and recognises the potential of such systems, but does not consider stand-alone units, or consider the location and design of such units.
Priyadarsiniet al.[5], studied the feasibility the application of passive and active stack systems to enhance natural ventilation. A wind tunnel was used to test various passive and active stacks on a scaled three bedroom flat.
The active stack consisted of a fan installed on top of stack to create a pressure drop and induce the airflow inside the rooms. The passive stack was an identical device without the fan.
The investigation found that the passive stack showed minimal air movement in the smoke visualisation test and therefore concluded that it failed to improve ventilation.
The active stack however, showed that internal velocities increased with increased fan speed. The work determined that the active stack provides substantial increase in the internal air velocities, and that the velocities increase in proportion to the increase in stack size.
Elmualim [6], investigated the CFD modelling of a modern wind catcher device and compared it to wind tunnel tests to ascertain its effectiveness. The work focused on a commercially available wind catcher device and tested the ventilation rate achieved by the device for varying wind incident angles in a wind tunnel. The analysis was compared to that of a simulated device subject to CFD investigation.
This research concluded that good correlation between CFD and experimental work was evident. However, the CFD analysis did not include a full geometrical representation of the device, due to the computational complexity and assumed a flow rate through the device inlet based on orifice theory.
Hughes and Ghani [7], investigated the effects of varying external wind conditions on the Windvents ability to supply outside air at the recommended rates. The results showed that the device is capable of delivering the required fresh air supply.
Elmualim [8], Attempted to analyse a control strategy, which combined a wind catcher and hybrid air conditioning unit. The investigation was to assess the contribution of the device to indoor air environment and energy savings. However the equipment deployed to record both the macro and micro climatic variations failed.
Shun and Ahmed [9], combined a turbine ventilator with a solar powered motor to create a hybrid device. The device was tested experimentally at various motor voltages and wind speeds to ascertain the feasibility of such a device. The study showed that the hybrid ventilator was feasible and provided increased ventilation rates at low or zero external wind velocities.
This work investigates the effect of varying the angle of the louvres of a Windvent on air velocity and pressure differentials achieved. The purpose of the investigation was to establish maximum air movement within a controlled volume which represents a small classroom. Utilising eight different CFD models, the angle of the louvres was increased by 5° each model, for a range of 10° - 45°. The external wind velocity was set at 4.5 m/s, as this is the UK average wind speed [1].
3. CFD set up
The CFD model was developed using FLUENT, a commercially available general-purpose code. This code uses the Finite Volume Method (FVM) approach and employs the Semi-Implicit Method for Pressure-Linked Equations Consistent (SIMPLEC) velocity-pressure coupling algorithm. The turbulent nature of the flow is modelled by the standard (k-epsilon) model. The governing equations are the Navier-Stokes and energy equation which are available in detail in [10].
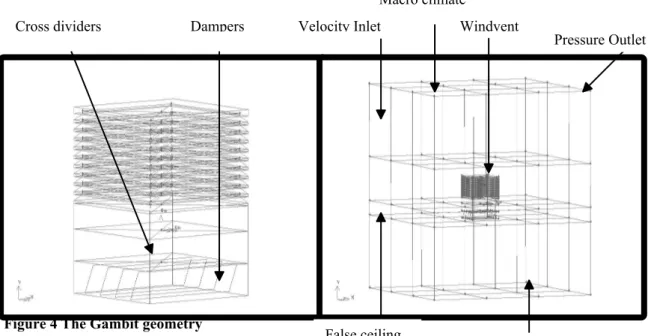
The Windvent geometry was created using Proengineer software and then imported into GAMBIT (FLUENT pre-processor) which was used to create the additional geometry, with a 6000 x 6000 x 3000mm (500mm false ceiling height) micro climate representing a small classroom [11]. The Windvent geometry, as illustrated in figure 4, was a 1000 x 1000 mm Windvent including cross dividers and damper faces. The damper angle has been subject to extensive previous research by the authors [12] The Windvent contained 10 louvers spaced at 50mm between each opening louver (The bottom and top louvers connect the structure and do not allow airflow through). The Windvent was centrally placed above the room. In order to obtain sufficient distance between boundary conditions the macro climate was sized appropriately [13] and consists of a 6000 x 6000 x 4000 mm volume placed directly above the microclimate, thus creating a direct interface through the Windvent geometry.
Figure 4 The Gambit geometry
Cross dividers Dampers
The cross dividers contain a zero thickness geometry, they are used to split the Windvent volume into four equal segments. The effect of this division is to direct the flow into and out of the microclimate, irrespective of the prevailing wind direction.
3.1 Boundary conditions
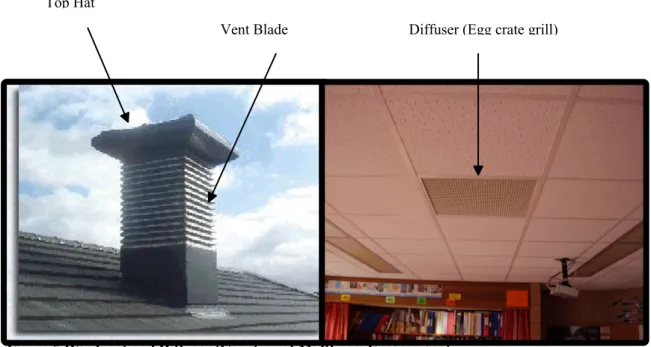
Accurate modelling of the louvres geometry is paramount to capture the flow. The porous jump model was not used to model the pressure drop created by louvres. Instead, an extensive process of local grid enhancement was carried out on that region. Downstream, as shown in Figure 3, the diffuser or egg crate grill was modelled using the porous jump boundary condition. The porous jump acts as thin membrane or filter with user defined inputs of permeability of 0.91854m2and medium thickness of 0.01m . These values are
taken form physical measurements of the Windvent diffuser. A tertiary term of pressure jump coefficient is available to the user for this type of boundary condition, however as a reliable coefficient is currently unavailable, the software reduces to the Darcy's law in the absence of this input [10].
The macro climate created, to simulate the incident wind velocity may be seen in figure 5, consists of a velocity inlet (value of 4.5 m/s) at one complete side, and a pressure outlet (atmospheric pressure) on the opposing side. The remainder of the macro climate faces were named as symmetry faces, thus alleviating any return velocities which may distort the results.
Figure 5 Windvent and Diffuser (Courtesy of Midtherm Engineering)
3.2 Grid adaption
Due to the geometrical complexity, the computational mesh was generated using triangular elements. In order to accurately resolve the solution fields, the grid was refined and
enriched using thehp-method [13]. This process of adaption requires a decision as to the
Top Hat
usage ofh-refinements (the mesh size) orp-enrichments (higher order approximations) by the use of a posteriori error estimate.
The posteriori estimate used in the developed model is the average weighted velocity taken on the face between the Windvent and the micro climate. An initial coarse grid was
evaluated, and subsequent refinements were carried out until the error deemed negligible between refinements. When refining the grid, a compromise must be reached, between accuracy and computational time. The boundary conditions were fixed throughout this process to ensure accurate comparison of the error indicator.
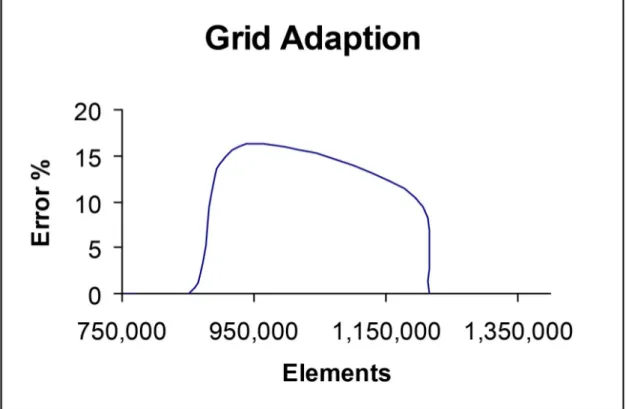
Figure 6 Graph to highlight the percentage error reduction through grid refinements
The initial coarse grid consisted of 860,166 elements which was refined over three stages until an acceptable error of 0.01% was achieved with a total of 1,216,987 elements. This equates to a total of 200 grid points on each louver spacing face, or 800 in total
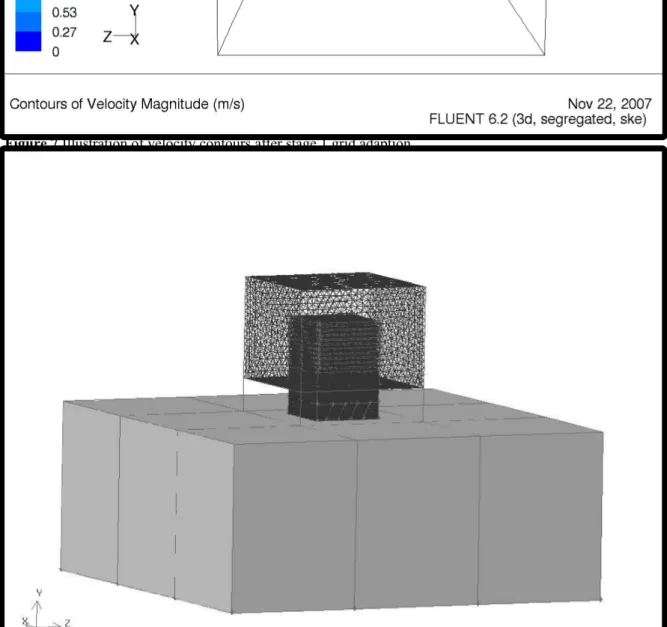
Figure 7Illustration of velocity contours after stage 1 grid adaption
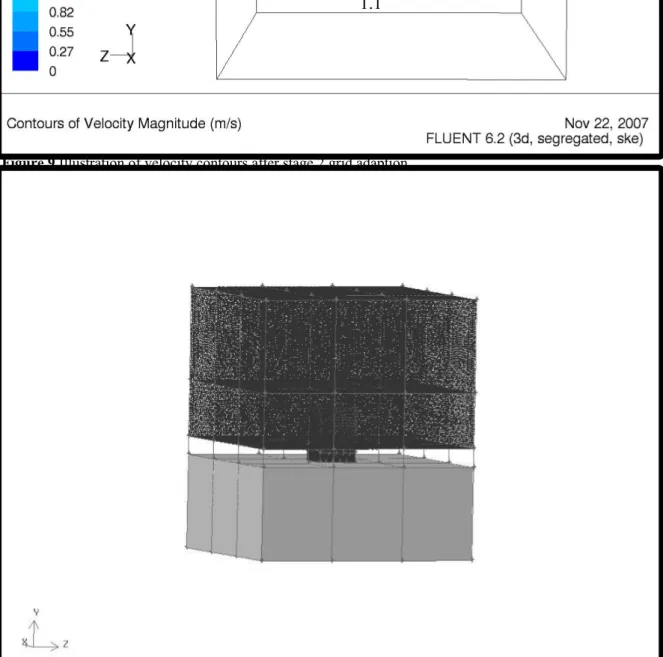
Figure 8Illustration of the refined area, the Windvent geometry and surrounding volume.
5
1.1
4.3
Figure 9Illustration of velocity contours after stage 2 grid adaption
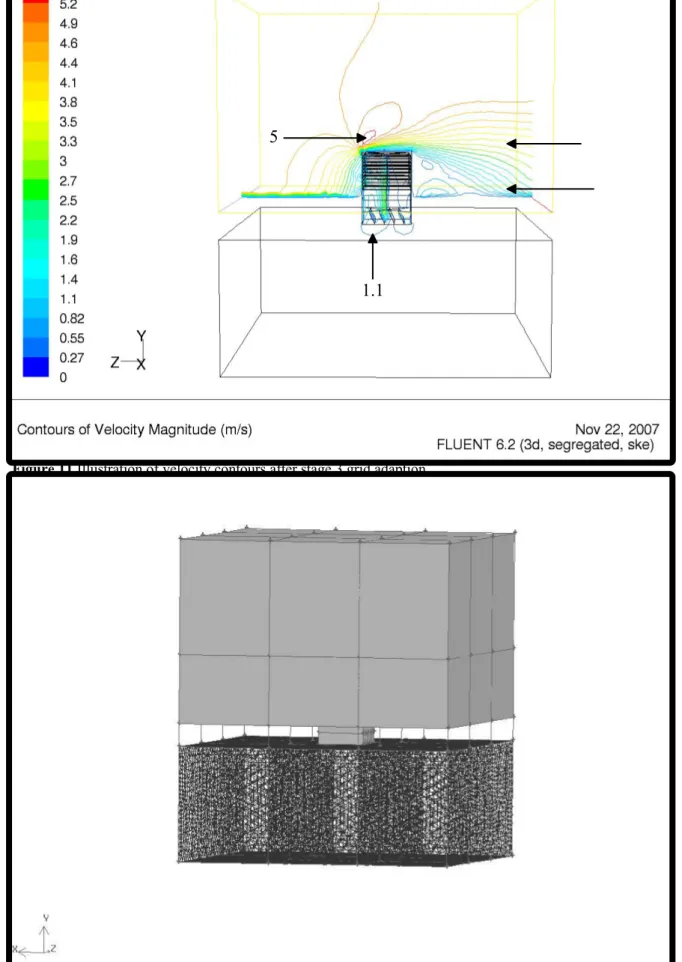
Figure 10Illustration of the refined area, the macro climate.
5
1.1
Figure 11Illustration of velocity contours after stage 3 grid adaption
Figure 12Illustration of the refined area, the micro climate.
1.1 5
3.5
Stage 3 of the adaption concentrates on the micro climate leaving the remaining cell sizes constant. Once again the separation in the velocity contours is more defined than the previous refinement, although not to the same extent as this is the final stage of refinement.
4. Results
4.1 Flow analysis
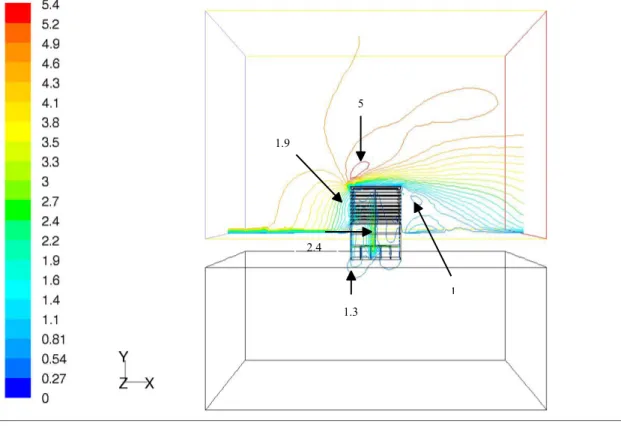
Figure 13 shows a contour plot of the flow entering from the left of the boundary velocity inlet. The flow splits with some of the air entering the interface and some passing over, or shearing, and exiting to the right (pressure outlet boundary). The flow entering the
Windvent, accelerates as it enters the device reaching maximum velocity of 2.5 m/s as it hits the cross dividers and forces the flow down into the diffuser. As the air exits the diffuser into the micro climate it creates a horse shoe shaped pattern, as the pressure differential allows the flow in and also out of the device. Upon exiting the Windvent, the flow splits with some of the air recirculating and mixing with that of the spent air and the rest mixing with sheared air above the device.
Figure 13Fluent flow distribution illustrated by velocity contours 1.3 1.9
2.4 5
Figure 14Fluent pressure distribution illustrated by pressure contours
Figure 14 illustrates the pressure distribution at a plane passing through the middle section of the model. From the illustration it is seen that the areas of high pressure are around the Windvent and at the divider facing the direction (inlet) of the external wind.
12
2.7 5.4
4.2 Louvre stall angle
Figure 15FLUENT calculated pressure contours at louvre angle of 35°
Figure 15 illustrates the pressure build up around the bottom louvre at 35° caused by the angle variation. The pressure has increased around this area throughout the various increments of louvre angle. This is referred to as the attack angle as it is in direct opposition to the wind direction. Inviscid, incompressible flow theory shows that the velocity becomes infinitely large at a sharp convex corner. The leading edge of a flat plate at an angle of attack is such a case and the Windvent louvre similar to a sharp convex corner [14].
1. 1
1. 1 3. 3
Inflow
Outflo w 2.
Figure 16FLUENT calculated pressure contours at louvre angle of 40°
Flow separation occurs over the top surface of the louvre when the angle of attack exceeds a critical value. This is known as the stalling angle of attack. Behaviour associated with the extreme thinness of an airfoil, or in this case Windvent louvre, is labelled as thin airfoil stall. Figure 16 illustrates the increased pressure caused by the increased louvre angle. In comparison with the pressure contours at 35°, the pressure has increased from 1.1 to 5 Pa, causing a restriction within the Windvent. At this blade angle of 40° the flow has stalled and as such the results are unreliable.
5 5
3.3
Inflow Outflow
Figure 17FLUENT pressure contours at louvre angle of 45°
Figure 17 illustrates the decrease in pressure in comparison with 40° as the louvre angle has now passed the critical stall point. This mimics known aerodynamic theory regarding trailing-edge stall. Lift coefficient curves for thin airfoil plates show a linear rise up until the point of stall (see figure 3). After this peak the curve regresses and the behaviour is no longer linear. The louvre angle at 45° follows this pattern and confirms the stall angle has been overcome.
Figure 18FLUENT simulated geometry used for flow analysis containing lines for results analysis (right image has vent removed for illustration of reporting lines).
Figure 18 shows the Fluent geometry referred to in the results section of this paper. The louvre angle is increased in 5° increments in the vertical direction from the zero line, for a
P1/V1
P2/V2 P3/V3 P4/V4 P5/V5
P6/V6 Louvre
Zero
Louvre volume
3.3 1.3
1.3 Inflow
Outflow
Angle
range of 10° - 45°. The adverse effect of altering the louvre angle, whilst retaining the standard louvre dimensions, is that the vent volume increases. In order to make a fair comparison this issue is addressed by introducing a normalising factor. This factor is based on the standard volume of the benchmark 45° louvre.
In order to obtain a clear pattern of the pressure and velocity profiles within the Windvent, six lines were created. The six lines are used to obtain values of average pressure and velocity across that vicinity of the vent. Lines 1 - 5 are horizontal and line 6 is vertical. Line 1 is placed at the roof of the vent. Line 2 is placed at the top of the vertex build up in the vent referred to as the trailing edge stall, with line 3 at the bottom of the vertex. Lines 4 and 5 are placed either side of the damper geometry with Line 6 running the vertical length of the vent.
The Micro air movement rate level refers to the Fluent calculated average air movement velocity within the occupied space. This level is pivotal to the potential successful application of the Windvent and as such provides the determining factor when assessing the optimum louvre attack angle.
4.3 FLUENT calculated results Table 1Pressure within the Windvent (Pa)
Louvre
Angle P1 P2 P3 P4 P5 P6
10 0.025 13.11 12.14 1.10 0.21 6.64
15 0.017 4.59 3.35 0.87 0.20 3.25
20 0.017 1.73 1.49 0.54 0.09 1.87
25 0.015 1.515 1.296 0.529 0.107 1.786
30 0.014 0.891 1.039 0.387 0.088 1.225
35 0.019 0.870 1.052 0.387 0.096 1.320
40 0.051 5.430 5.168 2.228 1.223 5.563
45 0.027 2.576 2.481 1.017 0.220 2.882
Table 1 shows the FLUENT calculated results for the six internal pressure regions simulated, for the louvre angle range of 10 - 45°.
Table 2Velocity within the Windvent (m/s)
Louvre Angle V1 V2 V3 V4 V5 V6
10 0.192 4.606 4.443 0.968 0.472 2.857
15 0.157 2.727 2.281 1.004 0.559 2.061
20 0.156 1.638 1.498 0.785 0.386 1.552
25 0.151 1.514 1.391 0.783 0.403 1.524
30 0.149 1.163 1.236 0.669 0.364 1.269
35 0.172 1.145 1.243 0.670 0.382 1.321
40 0.266 2.951 2.858 1.710 1.262 2.835
45 0.195 2.014 1.969 1.131 0.590 1.998
Table 3The volume normalising factor
Louvre Angle Volume m3 Factor
10 0.012 1.34
15 0.013 1.18
20 0.014 1.11
25 0.015 1.07
30 0.015 1.04
35 0.016 1.02
40 0.016 1.002
45 0.016 1
Table 3 shows the calculated factor for the new volumes created by changing the louvre angle. Each louver angle change was simulated by creating a new wind vent model, keeping all geometry constant except the louver angle. Thus the change in louver angle created a smaller internal volume and reduced the effective opening area of the device. Fluent was used to calculate the effect of the smaller effective area on the flowrate, however the decreased internal volume would distort the pressure and velocity results, a standard 45° volume was used as the benchmark and the new volumes equated to this size using the normalising factor. Increasing the louvre angle, whilst keeping all other vent dimensions constant, has the undesired effect of reducing the internal vent volume. Clearly reducing this volume would distort the results as the velocities and pressures would
increase as is known from orifice flow theory. Therefore in order to make a fair comparison, the results have been normalised by introducing a factor based on the benchmarked standard vent volume at 45° louvre angle.
Table 4Normalised pressure results (Pa)
Louvre Angle P1 P2 P3 P4 P5 P6
10 0.017 8.651 8.013 0.727 0.142 4.386
15 0.014 3.769 2.753 0.716 0.169 2.666
20 0.015 1.541 1.333 0.484 0.086 1.672
25 0.0148 1.409 1.205 0.492 0.100 1.661
30 0.0143 0.855 0.998 0.371 0.084 1.176
35 0.019 0.853 1.031 0.379 0.094 1.293
45 0.027 2.570 2.481 1.017 0.220 2.880
Table 4 shows the FLUENT calculated results which have been subject to the normalising factor for the six internal pressure regions simulated, for the louvre angle range of 10 - 45°.
Table 5Normalised velocity results (m/s)
10 0.126 3.040 2.932 0.639 0.311 1.885 0.374
15 0.129 2.236 1.871 0.823 0.458 1.690 0.344
20 0.139 1.458 1.333 0.698 0.343 1.381 0.352
25 0.141 1.408 1.293 0.728 0.375 1.417 0.361
30 0.143 1.116 1.187 0.642 0.350 1.218 0.357
35 0.168 1.122 1.218 0.657 0.375 1.295 0.448
45 0.195 2.014 1.969 1.131 0.590 1.998 0.309
Table 5 shows the FLUENT calculated results which have been subject to the normalising factor for the six internal velocity regions simulated, for the louvre angle range of 10 - 45°.
Figure 19Windvent internal pressure analysis graph
Figure 20Windvent internal velocity analysis graph
Figure 20 shows the results of the internal velocity distribution within the vent and the micro climate velocity within the occupied space.
Figure 21 compares the internal pressure and velocity at the exit of the Windvent device prior to delivery into the occupied space (Micro climate).
Figure 22Combined analysis of the Windvent internal pressure, velocity, and micro climate velocity
Figure 22 compares the internal pressure and velocity at the exit of the Windvent with the micro climate velocity rate superimposed to illustrate the optimum performance
characteristics.
7.0 Validation
Figure 23Comparison of the CFD results against experimental data
8.0 Discussion of Results
Inviscid, incompressible flow theory shows that the velocity becomes infinitely large at a sharp convex corner. The leading edge of a flat plate at an angle of attack is such a case. In the real flow over the plate nature addresses this singular behaviour by having the flow separate at the leading edge, even for low values of attack angle [14].
For relatively low attack angles, a small region of separated flow at the leading edge is observed. This separated flow reattaches to the surface downstream, forming a separation bubble in the region near the leading edge. As the angle of attack is increased the
reattachment point moves further downstream; that is, the separation bubble becomes larger [3].
little benefit in increasing the attack angle as the flow separation has peaked. Hence the range of attack angles covers 10° - 45°.
The full pressure and velocity results prior to introducing the normalising factor are shown in tables 1 and 2. These tables include the results form the 40° louvre angle, which has been established as the stall angle of the Windvent. As the stall angle distorts the results as previously described, it has been omitted from the normalised results so as to ensure an accurate picture of the flow behaviour is considered. The normalised results are presented in tables 4 and 5.
Figure 19 plots the recorded pressure against the louvre angle. P4 and P5 are placed either side of the damping unit. In order for the dampers to operate effectively the pressure drop across them must be at a minimum, thus enable the unit to control accurately the rate of flow. The plots show the two trends of P4 and P5 are at their closest over a range of 28° -37°.
Figure 20 plots the recorded velocity against the louvre angle. Again in order for the dampers to work effectively, it is desirable for the velocity drop across V4 and V5 to be at a minimum. This range is as expected, due to pressure and velocity being proportional, across the same values of 28° - 37°.
Figure 21 plots the average velocity and pressure across the vent against the attack angle of the louvre. As the pressure inside the Windvent decreases the velocity will increase, as effectively any flow restriction is reduced. From this plot, it is evident that at the points of intersection the flow and pressure is at the optimum for the Windvents performance. The two points of intersection of this plot are 28° and 35° respectively.
However, the purpose of optimising the Windvent performance ultimately is to provide optimum micro climate velocity or air movement rate inside the occupancy area. Therefore, in order to assess this performance, the micro velocity level within the area must be shown in tandem with the Windvents pressure and velocity profiles.
Figure 22 shows the scaled micro velocity level, pressure and velocity against the louvre angle. The micro climate velocity is scaled by a factor of ten in order for it to fit the velocity and pressure profiles for comparison, this does not affect the results in any way. The plots show clearly that at the second point of intersection, 35°, the micro climate velocity within the occupied area is at its peak.
Therefore, the overall performance of the Windvent peaks at the 35°angle. Comparison of the 35° results in comparison that of the benchmarked 45° louvre shows a 45% increase in occupants comfort level, and a 42% reduce in the trailing edge stall pressure produced. It is clear that reduction in trailing edge stall is proportional to the increase in occupants
comfort level.
8.0 Conclusion
levels. This investigation shows that a louvre angle of 35° provides optimum performance at the given parameters.
The stall angle of the Windvent has been established as 35- 40°. The investigation has also established that the reduction in trailing edge stall is proportional to the increased velocity distribution within the occupied space. This relationship is obvious as the removal of such restrictive pressure allows a free flow through the Windvent, and is pivotal to the operation of the control mechanism, namely the damper unit.
Further verification by physical experimentation were carried out. This work contributed to extensive examination of the Windvent geometry. The results were used to establish
discharge co-efficients to allow for variations in external velocities [15].
Acknowledgements
The authors would like to acknowledge the support of the EPSRC, The Whitworth Society, and Midtherm Engineering Ltd in carrying out this investigation.
References
1 British Standards(1991). Ventilation principles and designing for natural ventilation.BS5925:1991.
2 HOUGHTON, E. L. and CARPENTER, P. W. (2003).Aerodynamics for engineering students.5th ed., Elsevier.
3 Nakanishi. T., Nakamura. T., Watanabe. Y., Handou. K., and Kiwata. T (2007). Investigation of airflow passing through louvers. Komatsu Technical report 2 Volume 53 No.160.
4 JABOYEDOFF, P., et al. (2004). Energy in air-handling units - results of the AIRLESS European project. In:Proceedings of the International Conference on Solar Energy in (CISBAT 2001),Oct 3-4 2001. Lausanne, Switzerland, Elsevier Ltd, 391-399.
5 PRIYADARSINI, R., CHEONG, K. W. and WONG, N. H. (2004). Enhancement of natural ventilation in high-rise residential buildings using stack system.Energy and buildings,36 61-71.
7 Hughes, B. R. and Ghani, S.A.A (2007). Investigation of a Windvent Passive Ventilation Device against Current Fresh Air Supply Recommendations.
8 ELMUALIM, Abbas A. (2006). Failure of a control strategy for a hybrid air-conditioning and wind catchers/towers system at Bluewater shopping malls in Kent, UK.Emerald24 399-411.
9 SHUN, S and AHMED A.N (2007). Utilizing wind and solar energy as power sources for a hybrid building ventilation device.Renewable Energy July 2007.
10 FLUENT. Fluent user manual 6.2(2003).Fluent Incorporated.
11 Department for Education and Skills Briefing framework for secondary school projects.Building Bulletin 98.United Kingdom.
12 HUGHES, B. R. and ABDUL GHANI, S. A. A. A.(2009). Numerical investigation into the effect of wind vent dampers on operating conditions.Building and
environment,44(2), 237-248.
13 CHUNG, T. J. (2002).Computational fluid dynamics.Cambridge, University press.
14 ANDERSON, J.D. Jr (2007).Fundamentals of Aerodynamics.4th ed., McGraw-Hill.
![Figure 1 Cross section of a standard passive stack device (Courtesy of BSRIA) A commercially available standard stack device, the Windvent, has been numerically investigated to ascertain its abilities to provide the recommended fresh air delivery rates [1]](https://thumb-us.123doks.com/thumbv2/123dok_us/8002340.209252/2.892.246.657.573.983/courtesy-commercially-available-numerically-investigated-ascertain-abilities-recommended.webp)
![Figure 3 Example of flow separation causing thin airfoil stall [ 5 ]](https://thumb-us.123doks.com/thumbv2/123dok_us/8002340.209252/4.892.125.773.100.474/figure-example-flow-separation-causing-airfoil-stall.webp)