Network Enabled Capability of Remote Operation:
Systems Engineering and Human Factors
Thesis submitted in accordance with the requirements of the University of Liverpool for the degree of Doctor in Philosophy
by
John Kenneth Davis
Abstract
Air-to-surface weapons, and the platforms that deliver them, are becoming increasingly automated and remote from operators. The benefits of remotely operated systems have been widely agreed, yet the question of accountability remains an issue – both from a le-gal standpoint and with regard to public opinion. The current focus of the military and industry is to develop weapons with more autonomy and an increased range. This mo-tivation is part of a wider aim for Network Enabled Capability across all military forces.
This thesis focuses on one aspect of Network Enabled Capability, the remote re-tasking of air-to-surface weapons in flight, the aim being to explore the potential capabilities of the human operator that may use such a system. Further, this thesis sets out to inves-tigate the differences between using an automated system for re-tasking air-to-surface missiles in flight as opposed to assigning the task to a human operator.
A simulation test-bed facility was established to investigate these research aims. The development of this system first required a complete simulation of two air to surface weapon systems, a generic guided bomb, and an extended range missile. These simu-lation models were integrated into the test-bed facility to allow real-time targeting and firing of the weapon systems in a 3D simulation environment.
Acknowledgements
I would like first to thank my supervisor Prof. Jason Ralph for the belief in both my ability to become a researcher, and the research undertaken in completion of this thesis. He has provided constant support and shared invaluable knowledge and advice over the last four years. A special mention is due to Dr. Elias Griffith who has supported the software development needed for this research. Without his technical expertise in both MATLAB and C++ this project would never have gotten off the ground. I would also like to thank Kerry Tatlock and Steven Sargent at MBDA Systems for their advice in relation to scoping the SEAD trials in Chapter 6.
The city of Liverpool deserves thanks for being a home to me for the past 8 years, and for having such a wonderful community. The friends I have met here have sup-ported me like family though the tough times and the good. Suman must be thanked for his work ethic rubbing off on me, and the Salsa crew for the years of dancing to take my mind off things.
Contents
Abstract i
Acknowledgements iii
Contents v
List of Figures ix
List of Tables xv
Acronyms xvii
Notation xxi
1 Introduction 1
1.1 Significance and Motivation . . . 1
1.2 Structure of Thesis . . . 4
1.3 Publications . . . 5
1.3.1 Conference Papers . . . 5
1.3.2 Conference Presentations . . . 5
1.4 Novel Contributions . . . 5
2 Literature Review 7 2.1 The History of Data and Communication Networks . . . 7
2.2 Technology Context . . . 9
2.2.1 Networked Close Air Support and Sensor To Shooter Capabilities 9 2.2.2 Risks in Air-Strikes and Sources of Error . . . 10
2.2.3 Rules of Engagement Considerations . . . 16
2.2.4 Dynamic and High Fidelity Modelling of Network Enabled Ca-pabilities . . . 17
2.3 The Human Side of Complex Systems . . . 18
2.3.1 Situational Awareness and Decision Making . . . 19
2.3.2 Graphical vs. Numerical Display Format . . . 24
2.3.3 Decision Priming and Approach-Avoid Conditions . . . 26
2.4 Summary . . . 31
3 Simulation Facility Development 33 3.1 Simulation Models . . . 34
3.1.1 Weapon Systems . . . 34
3.1.1.1 Types of Weapons . . . 35
3.1.1.2 Generic Airframe/Bomb/Missile Simulation . . . 36
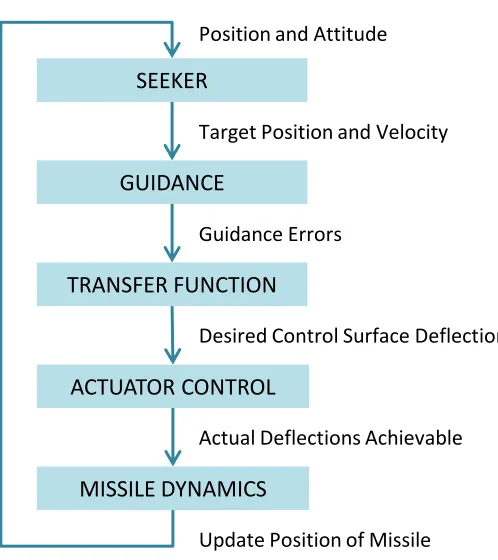
3.1.1.2.1 Seeker . . . 46
3.1.1.2.2 Guidance . . . 46
3.1.1.2.3 Transfer Function . . . 47
3.1.1.2.4 Actuator Control . . . 48
3.1.1.2.5 Dynamics . . . 48
3.1.1.3 Weapon Configurations . . . 48
3.1.1.3.1 GBU - The Guided Bomb Unit . . . 49
3.1.1.3.2 LRAGM - The Long Range Air-to-Ground Mis-sile . . . 50
3.1.1.4 Generating Re-Targeting Capability Information . . . . 51
3.1.1.4.1 GBU RAR Estimation . . . 51
3.1.1.4.2 LRAGM RAR Estimation . . . 56
3.1.1.5 Real-Time Simulation Adaptations, Constraints and Val-idation . . . 67
3.1.2 Target Systems . . . 68
3.1.2.1 Vehicle Simulation . . . 68
3.1.2.2 Route Planning . . . 70
3.2 Networking . . . 74
3.2.1 Military Communication Standards . . . 74
3.2.2 Types of Digital Networking Communications . . . 79
3.2.3 Handover, Acknowledgement and Handshake Procedures . . . 84
3.2.4 Delays and Missed Messages . . . 85
3.3 Interactive Simulation . . . 86
3.3.1 Visualisation Environments . . . 86
3.3.1.1 XPlane vs. MSFSX . . . 86
3.3.1.1.1 Realism . . . 87
3.3.1.1.2 Data Access and Control . . . 87
3.3.1.1.3 Software Updates and Effects . . . 88
3.3.1.1.4 Overall Considerations . . . 88
3.3.2 MATLAB Weapon Simulation Integration with X-Plane Plugins 89 3.3.3 MATLAB MEX Functions for UDP Messages . . . 93
4.1 Introduction . . . 95
4.1.1 Remote Operation of Multiple Air Platforms . . . 96
4.2 Scenario Generation . . . 98
4.3 Real-Time Sensor-Effector Allocation . . . 100
4.4 Remote Operator Interface Developments . . . 103
4.4.1 Aims of the Display . . . 104
4.4.2 Implementing the Main Display Elements . . . 104
4.4.2.1 Map Display . . . 104
4.4.2.2 Schedule Display . . . 104
4.4.2.3 Connection Data . . . 105
4.4.2.4 Additional Functions . . . 105
4.4.3 Display Overview . . . 105
4.4.4 Networked Elements of the Display . . . 107
4.5 Example Scenario . . . 107
4.6 Results . . . 111
4.7 Conclusions and Summary . . . 113
5 Participant Study 1 115 5.1 Introduction . . . 115
5.2 Summary of Trial . . . 116
5.3 System Development . . . 117
5.3.1 Remote Operator Terminal . . . 117
5.3.2 Network Protocol . . . 120
5.3.3 Weapon Simulation . . . 120
5.4 Study Aims and Methodology . . . 121
5.4.1 Aims . . . 121
5.4.2 Methodology . . . 123
5.4.3 Statistical Design . . . 127
5.4.4 Participants . . . 127
5.4.5 Procedure and Materials . . . 127
5.5 Results . . . 129
5.5.1 Reaction Time . . . 129
5.5.1.1 Per Scenario Reaction Time . . . 129
5.5.1.2 Per Scenario Prime Reaction Time . . . 130
5.5.1.3 Per Prime Reaction Time . . . 131
5.5.1.4 Total Average Reaction Time . . . 131
5.5.1.5 Summary . . . 131
5.5.2 Accuracy . . . 132
5.5.2.1 Per Scenario Accuracy . . . 132
5.5.2.2 Per Scenario Prime Accuracy . . . 133
5.5.2.4 Summary . . . 133
5.5.3 Subjective Experiences . . . 136
5.5.4 Digit Span Task . . . 138
5.6 Discussion . . . 138
5.7 Chapter Summary . . . 140
6 Participant Study 2 143 6.1 Suppression of Enemy Air Defence (SEAD) . . . 144
6.1.1 SA-15 TLAR . . . 146
6.1.2 LRAGM . . . 149
6.1.3 Scenario Outcome Estimation . . . 149
6.2 Human Interface Design . . . 152
6.2.1 Features and Functions . . . 152
6.2.2 Task Allocation Table (TAT) . . . 153
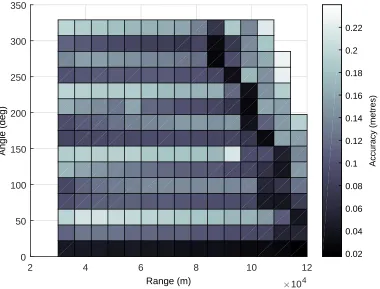
6.2.3 Re-task Acceptability Region (RAR) . . . 158
6.2.4 Map Overview . . . 162
6.3 Scenario . . . 162
6.3.1 Summary of Trial . . . 163
6.4 Study Aims and Methodology . . . 164
6.4.1 Independent Variables . . . 164
6.4.2 Performance Measures . . . 165
6.4.3 NASA TLX . . . 165
6.4.4 Additional Measures . . . 166
6.4.5 Invoking a Re-task and Scenario Repeatability . . . 166
6.4.6 Equipment . . . 167
6.5 Automated Control System Solution . . . 167
6.6 Results . . . 169
6.6.1 Operator Terminal Logged Data . . . 169
6.6.2 Heat Maps . . . 178
6.6.3 Automated System Data . . . 184
6.6.4 Qualitative Analysis . . . 195
6.7 Discussion . . . 198
6.8 Chapter Summary . . . 199
7 Summary and Conclusions 201 7.1 Summary . . . 201
7.2 Limitations . . . 203
7.3 Recommendations for Future Work . . . 204
List of Figures
2.1 UK and US Causes of Fratricide . . . 11
2.2 Phases of Flight for Air-to-Surface Bombs . . . 15
2.3 Phases of Flight for Air-to-Surface Missiles . . . 15
2.4 Model of SA in Dynamic Decision Making . . . 20
2.5 Sources of SA Information . . . 21
2.6 Boyd’s OODA Loop . . . 23
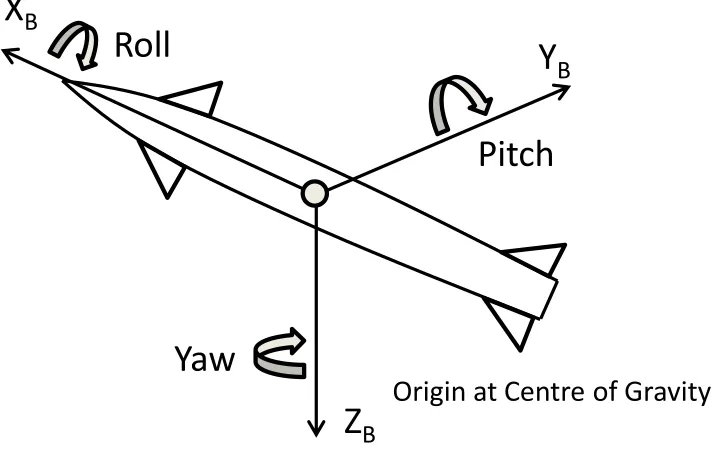
3.1 Translational and Rotational Degrees of Freedom of a Generic Airframe 38 3.2 North East Down Coordinate Reference System . . . 38
3.3 6DoF Equations of Motion Flow Diagram . . . 39
3.4 Generic Weapon Simulation Functions in Single Time Step . . . 45
3.5 Control Surface Configuration for an Air-to-Surface GBU . . . 49
3.6 Control Surface Configuration for an Air-to-Surface LRAGM . . . 50
3.7 Change in RAR Size for Basic Algorithm (Full Output Set) . . . 52
3.8 Change in RAR Size for Basic Algorithm (Valid Set) . . . 53
3.9 Change in RAR Size for Closed-Loop Algorithm (Output Set) . . . 54
3.10 Time to Complete RAR Algorithm vs. Altitude of Weapon at Time of Calculation (Closed-Loop and Basic RAR Algorithms) – note: the x-axis is inverted such that from left to right is representative of decreasing Time to Go (TTG) of the weapon . . . 55
3.11 Turn in Glide - Phase 1 Cumulative Control Surface Deflection . . . 58
3.12 Turn in Cruise - Phase 1 Cumulative Control Surface Deflection . . . 58
3.13 Turn in Glide - Phase 2 Cumulative Control Surface Deflection . . . 59
3.14 Turn in Cruise - Phase 2 Cumulative Control Surface Deflection . . . 59
3.15 Turn in Glide - Phase 3 Cumulative Control Surface Deflection . . . 60
3.16 Turn in Cruise - Phase 3 Cumulative Control Surface Deflection . . . 60
3.17 Turn in Glide - Total Cumulative Control Surface Deflection . . . 62
3.18 Turn in Cruise - Total Cumulative Control Surface Deflection . . . 62
3.19 Turn in Glide - Accuracy for Acceptable Cases . . . 64
3.20 Turn in Cruise - Accuracy for Acceptable Cases . . . 64
3.22 LRAGM Velocity Profile . . . 67
3.23 Simulation of a Car Type Vehicle in MATLAB Driving on OSM Roads . 73 3.24 Data Packet Structure and Relevant Standards . . . 75
3.25 Position Report K-Message Series . . . 76
3.26 Messages Sent in CAS Mission Using VMF K-Series Messages . . . 79
3.27 Unicast Routing Scheme . . . 82
3.28 Multicast Routing Scheme . . . 82
3.29 Broadcast Routing Scheme . . . 82
3.30 System Architecture for Distributed Simulation Environment . . . 83
3.31 Network Message Protocol for Transferring Target Information Amongst Entities in Distributed Simulation Environment . . . 84
3.32 Open GL Coordinate System and NED Flat Earth System . . . 89
3.33 Flow Diagram of Weapon Simulation Including Networking Links With X-Plane . . . 91
3.34 Flow Diagram of Weapon Simulation Including Networking Links With X-Plane . . . 92
3.35 Two Armoured Vehicles on an OSM Road in X-Plane . . . 93
3.36 Test GBU Launch Against a Mobile Armoured Target . . . 94
4.1 Flow Diagram Showing Allocation Search Strategy . . . 103
4.2 An Example of the Remote Operator Interface, Showing a Range of Targets and Assets with an Example 9-Line Brief Overlay . . . 106
4.3 An expanded view of the Task Allocation Table (TAT) . . . 106
4.4 Overview of Example Scenario . . . 108
4.5 Overview of Example Scenario with Aircraft Routes . . . 110
4.6 Average Time to Find Search Result for Example Scenario for Variable Number of Assets/Platforms and Different Number of Targets (both ran-domly selected) . . . 111
5.1 Graphical Display Method . . . 121
5.2 Numerical Display Method . . . 122
5.3 RAR Imagery at Point of New Target Appearing for Re-Task Primed Scenarios . . . 125
5.4 RAR Imagery at Point of New Target Appearing for Deny Re-Task Primed Scenarios . . . 126
5.6 Decision Accuracy Per Scenario, A: Graphical Display and B: Numerical Display . . . 132 5.7 Dynamic RAR Area in Example NEW Drop Showing Rate of Change of
RAR and Altitude vs. Time . . . 135 5.8 Dynamic RAR Area in Example NEW Drop Showing Points at which
New Targets Appear and their Distance from the Edge of the RAR . . . 135 5.9 Subjective Experience Ratings – Box shows inter quartile range with
mean at the centre, and whiskers showing the upper and lower quartiles, outliers are shown as a red + . . . 137
6.1 Overview of Suppression of Enemy Air Defence Scenario with Layered Air Defences . . . 144 6.2 SA-15 . . . 145 6.3 Flow Diagram of AA Site Launching Procedure and Surface-to-Air
Mis-sile (SAM) Model Time Step . . . 147 6.4 Graphical Representation of the Simulated SAM Launching Sites with
Visible Missile Range Domes, and Radar Sensor Capability . . . 148 6.5 Iteration Loop to find SAM vs. ASM Intercept Positions . . . 151 6.6 Estimates of Defending SAMs Intercept of Incoming Long Range
Air-to-Ground Missile (LRAGM), by Iteration of Successful Intercept, and Range . . . 152 6.7 Task Allocation Table (TAT) Before Launching Weapons - Each Weapon
to Target Status Box is Empty. Only the First Target Set and First Two Salvoes are Shown . . . 153 6.8 Elements of the Task Allocation Table and the Weapon-Target Status
Boxes Showing AGM011 Hit Tgt status, and AGM012 Destroyed/Failed 154 6.9 Weapon-Target Status Box Display, Left - Weapon Currently Assigned
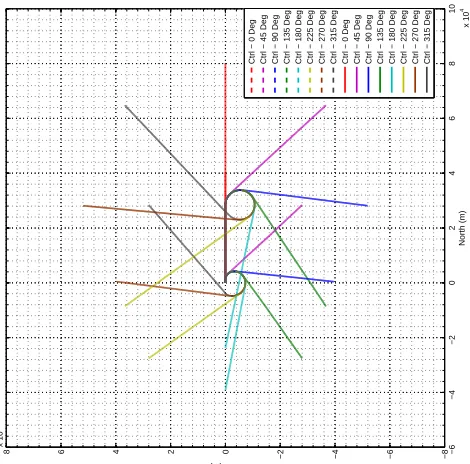
to This Column, Right - Weapon Not Currently Assigned to This Column156 6.10 Re-Task/Abort Button Press Flow Diagram . . . 157 6.11 Re-Task Salvo Button Press Flow Diagram . . . 157 6.12 Approach Paths of Air-to-Surface LRAGM Given Launch and Approach
Headings (North,North) . . . 159 6.13 Approach Paths of Air-to-Surface LRAGM Given Launch and Approach
Headings (North-West,North-West) . . . 160 6.14 Approach Paths of Air-to-Surface LRAGM Given Launch and Approach
Headings (West,West) . . . 160 6.15 Automatic Control System Decision Making Flow Diagram . . . 168 6.16 Workload and Overall Hit Targets, Missed Targets and Overkills vs.
6.17 Primary and Secondary Partial Hits, Missed Targets and Overkills vs. Difficulty . . . 176 6.18 Number of Re-Task and Abort Commands vs. Difficulty . . . 177 6.19 Frequency of Actions vs. Difficulty . . . 178 6.20 Participant Scenario 1 Heat Maps of Intercepted (Destroyed) LRAGM,
LRAGM Hits on Target, LRAGM Overkills on Target, LRAGM Abort from Target . . . 180 6.21 Participant Scenario 2 Heat Maps of Intercepted (Destroyed) LRAGM,
LRAGM Hits on Target, LRAGM Overkills on Target, LRAGM Abort from Target . . . 180 6.22 Participant Scenario 3 Heat Maps of Intercepted (Destroyed) LRAGM,
LRAGM Hits on Target, LRAGM Overkills on Target, LRAGM Abort from Target . . . 181 6.23 Participant Scenario 4 Heat Maps of Intercepted (Destroyed) LRAGM,
LRAGM Hits on Target, LRAGM Overkills on Target, LRAGM Abort from Target . . . 181 6.24 Participant Scenario 5 Heat Maps of Intercepted (Destroyed) LRAGM,
LRAGM Hits on Target, LRAGM Overkills on Target, LRAGM Abort from Target . . . 182 6.25 Participant Scenario 6 Heat Maps of Intercepted (Destroyed) LRAGM,
LRAGM Hits on Target, LRAGM Overkills on Target, LRAGM Abort from Target . . . 182 6.26 Participant Scenario 7 Heat Maps of Intercepted (Destroyed) LRAGM,
LRAGM Hits on Target, LRAGM Overkills on Target, LRAGM Abort from Target . . . 183 6.27 Participant Scenario 8 Heat Maps of Intercepted (Destroyed) LRAGM,
LRAGM Hits on Target, LRAGM Overkills on Target, LRAGM Abort from Target . . . 183 6.28 ACS Total Hits, Destroyed Targets, Misses and Overkills vs. Difficulty . 184 6.29 ACS Number of Re-Task, Re-Task Salvo, and Abort Actions vs. Difficulty185 6.30 ACS Frequency of Actions vs. Difficulty . . . 186 6.31 ACS Scenario 1 Heat Maps of Intercepted (Destroyed) LRAGM, LRAGM
Hits on Target, LRAGM Overkills on Target, LRAGM Abort from Target187 6.32 ACS Scenario 2 Heat Maps of Intercepted (Destroyed) LRAGM, LRAGM
Hits on Target, LRAGM Overkills on Target, LRAGM Abort from Target187 6.33 ACS Scenario 3 Heat Maps of Intercepted (Destroyed) LRAGM, LRAGM
Hits on Target, LRAGM Overkills on Target, LRAGM Abort from Target188 6.34 ACS Scenario 4 Heat Maps of Intercepted (Destroyed) LRAGM, LRAGM
6.35 ACS Scenario 5 Heat Maps of Intercepted (Destroyed) LRAGM, LRAGM Hits on Target, LRAGM Overkills on Target, LRAGM Abort from Target189 6.36 ACS Scenario 6 Heat Maps of Intercepted (Destroyed) LRAGM, LRAGM
Hits on Target, LRAGM Overkills on Target, LRAGM Abort from Target189 6.37 ACS Scenario 7 Heat Maps of Intercepted (Destroyed) LRAGM, LRAGM
Hits on Target, LRAGM Overkills on Target, LRAGM Abort from Target190 6.38 ACS Scenario 8 Heat Maps of Intercepted (Destroyed) LRAGM, LRAGM
Hits on Target, LRAGM Overkills on Target, LRAGM Abort from Target190 6.39 Ratio of Difference between ACS and Participants for Scenario 1. Red
is higher frequency of Participants than ACS actions, Blue is higher frequency of ACS than Participants actions . . . 191 6.40 Ratio of Difference between ACS and Participants for Scenario 2. Red
is higher frequency of Participants than ACS actions, Blue is higher frequency of ACS than Participants actions . . . 191 6.41 Ratio of Difference between ACS and Participants for Scenario 3. Red
is higher frequency of Participants than ACS actions, Blue is higher frequency of ACS than Participants actions . . . 192 6.42 Ratio of Difference between ACS and Participants for Scenario 4. Red
is higher frequency of Participants than ACS actions, Blue is higher frequency of ACS than Participants actions . . . 192 6.43 Ratio of Difference between ACS and Participants for Scenario 5. Red
is higher frequency of Participants than ACS actions, Blue is higher frequency of ACS than Participants actions . . . 193 6.44 Ratio of Difference between ACS and Participants for Scenario 6. Red
is higher frequency of Participants than ACS actions, Blue is higher frequency of ACS than Participants actions . . . 193 6.45 Ratio of Difference between ACS and Participants for Scenario 7. Red
is higher frequency of Participants than ACS actions, Blue is higher frequency of ACS than Participants actions . . . 194 6.46 Ratio of Difference between ACS and Participants for Scenario 8. Red
is higher frequency of Participants than ACS actions, Blue is higher frequency of ACS than Participants actions . . . 194 6.47 Tree Diagram of Number of Items Coded for Each Node - Area Depicts
Number of Coded Items . . . 196 6.48 Tree Diagram of Number of Items Coded from Each Participant - Area
List of Tables
3.1 List of Typical Warhead for Target Type . . . 35
3.2 Typical Road Vehicle Dynamics . . . 68
3.3 Transport Layer Specifications . . . 80
4.1 Aircraft Capabilities and Load-Outs . . . 99
4.2 Number of Aircraft (A/C) and Targets (TGT) in Example Scenario . . 109
4.3 Task Allocation Table (TAT) . . . 109
5.1 Scenario Sequence, Prime Type and Window of Opportunity . . . 124
5.2 Per Scenario Reaction Time Analysis . . . 130
5.3 Summary of Reaction Time Results . . . 131
5.4 Summary of Accuracy Results . . . 133
6.1 SA-15 Properties . . . 146
6.2 LRAGM Properties . . . 149
6.3 Rating of Each Element in Cost Benefit Analysis . . . 156
6.4 Scenario Difficulty Level Configurations . . . 165
6.5 Participant Average Overall Score, Number of Missed Targets and Num-ber of Overkills . . . 170
6.6 Participant Average Primary Objective Score, Number of Missed Targets and Number of Overkills . . . 170
6.7 Participant Average Secondary Objective Score, Number of Missed Tar-gets and Number of Overkills . . . 170
6.8 Average Total Scenario Re-Tasks (All TTGs) . . . 171
6.9 Average Scenario Re-Tasks Grouped by TTG . . . 171
6.10 Average Frequency of Actions (Num Actions Per Second) . . . 172
6.11 Average NASA TLX Workload . . . 172
6.12 NASA TLX Sources of Workload Breakdown . . . 172
6.13 Linear Regression Analysis Results (* indicates statistical significance, green indicates increasing with difficulty, red indicates decreasing with difficulty) . . . 173
Acronyms
3D Three Dimensional
6DoF Six Degrees of Freedom AAA Anti-Air Artillery
AAAW Autonomous Anti Armour Weapon ACS Automated Control System
ANOVA Analysis of Variance
APN Augmented Proportional Navigation ASM Air-to-Surface Missile
ATC Air Traffic Control ATF Avionics Testbed Facility
BCE Before Common Era
BDA Battle Damage Assessment
BFT Blue Force Tracker
C2 Command and Control
Cap3 Capability 3
CAS Close Air Support
CLoS Command Line-of-Sight
CNR Combat Net Radio
DCCP Datagram Congestion Control Protocol
DG Differential Geometry
DP Deviated-Pursuit
DSS Decision Support Systems ePWII Enhanced Paveway II FAC Forward Air Controller FAD Functional Area Designators FPI Field Presence Indicator FRI Field Recurrence Indicator
GBU Guided Bomb Unit
GPI Group Presence Indicator GPS Global Positioning System GRI Group Recurrence Indicator GUI Graphical User Interface
IDM Improved Data Modem
INS Inertial Navigation System
IP Internet Protocol
ISE/S2E Integrated Sensor to Effect JDAM Joint Direct Attack Munition
LAR Launch Acceptability Region LGAAW Laser-Guided Anti Armour Weapon
LGB Laser-Guided Bomb
LLA Latitude, Longitude, Altitude
LoS Line-of-Sight
LPD Landing Point Designation
LRAGM Long Range Air-to-Ground Missile
M Mean
M-WU Mann-Whitney U
MIL-STD Military Standard MoD Ministry of Defence
MSFSX Microsoft Flight Simulator X NATO North Atlantic Treaty Organisation NCW Network-Centric Warfare
NEC Network Enabled Capability
NED North East Down
NEW Network Enabled Weapon
OCT Optimal Control Theory OODA Observe Orient Decide Act
OSM Open Street Map
p Significance Value p
PC Personal Computer
PN Proportional Navigation PoI Point of Interest
PP Pure-Pursuit
RAF Royal Air Force
RAR Re-task Availability Region RED Risk Estimated Distance
RF Radio Frequency
RoE Rules of Engagement
RS Reachable Set
SA Situational Awareness
SAGAT Situational Awareness Global Assessment Technique SAM Surface-to-Air Missile
SCTP Stream Control Transmission Protocol
SD Standard Deviation
SDK Software Development Kit
SEAD Suppression of Enemy Air Defence SPEAR Selective Precision Effects at Range TAT Task Allocation Table
TCP/IP Transmission Control Protocol/Internet Protocol
TDL Tactical Data Link
TDS Tactical Data System
TLAM Tomahawk Land Attack Missile TLAR Transporter Launcher and Radar
TLX Task Load Index
TST Time Sensitive Targeting
TTG Time to Go
UAV Unmanned Aerial Vehicle UCAV Unmanned Combat Air Vehicle UDP User Datagram Protocol
UK United Kingdom
UN United Nations
UNITAF United Task Force
UNOSOM I United Nations Operation in Somalia US United States of America
UWS Unmanned Weapon System
VMF Variable Message Format
WAN Wide Area Network
WO Weapons Officer
Notation
α Angle of Attack (deg orrad)
α2 Angle of Attack Squared – sign is maintained ˙
α Rate of Change of α (rad/sec) β Angle of Sideslip (deg orrad)
β2 Angle of Sideslip Squared – sign is maintained ˙
β Rate of Change of β (rad/sec)
δp Deflection Angle of the Control Surfaces used to Roll the Airframe (deg or rad)
δp2 δp Squared – sign is maintained
δq Deflection Angle of the Control Surfaces used to Pitch the Airframe (deg or rad)
δq2 δq Squared – sign is maintained
δr Deflection Angle of the Control Surfaces used to Yaw the Airframe (deg or rad)
δr2 δr Squared – sign is maintained ∆T Model Time-Step (s)
δx Deflection Angle of the Control Surfaces used to Slow the Airframe (deg or rad)
δx2 δx Squared – sign is maintained
φ Euler Roll Angle (deg orrad) ψ Euler Heading Angle (deg orrad) ρ Density of Air (kg/m3)
θ Euler Pitch Angle (deg orrad) CA Drag (Axial) Force Coefficient CD Drag Force Coefficient
CL Lift Force Coefficient Cl Rolling Moment Coefficient Cm Pitching Moment Coefficient CN Normal (Lift) Force Coefficient Cn Yawing Moment Coefficient CY Side Force Coefficient
g Acceleration due to Gravity (9.81m/s2) Ixx Moment of Inertia about x-x axis (kg/m2) Iyy Moment of Inertia about y-y axis (kg/m2) Izz Moment of Inertia about z-z axis (kg/m2) l Length of Moment Arm (m)
M Mass (kg)
qn Quaternion for the nth elementn= 1−4 R Yaw Rate about Body Axis (rad/s) S Reference Area (m2)
u Velocity along X body axis (m/s) V Airspeed (m/s2)
v Velocity along Y body axis (m/s) VD Velocity in Down Direction (m/s) VE Velocity in East Direction (m/s) VN Velocity in North Direction (m/s) w Velocity along Z body axis (m/s) X Position in X (m)
Chapter 1
Introduction
1.1
Significance and Motivation
The development of Network Enabled Capability (NEC) in military systems is allowing greater connectivity between individual military personnel and the wider distributed Command and Control (C2) structure. Such techniques have already been used widely in civilian industry with positive effect. For example, Amazon’s internal data network, used for live monitoring of stock and dispatching, allows for increased efficiency within the company as well as improving the end user’s experience by providing them with use-ful information that facilitates decision making. This network-driven revolution, made possible by the internet, has changed the current state of affairs such that timeliness of information and increased data transfer between platforms allows for new capabilities to be generated where they were not possible before.
King-dom this exists in the form of NEC Joint Service Doctrine 777 [1]. First published in 2005, Joint Service Publication 777 aimed to set out the British Armed Forces’ use of networked systems.
Through collaborative efforts between the government, industry and academia, mil-itary commanders are reaching the point of being able to use a wide range of NEC features in battles. These range from enhanced air-to-surface weapon aiming – through to stores management and logistics. Whilst some of the capabilities such as logistics clearly benefit the military, other areas such as remotely piloted air systems or remote re-tasking, re-targeting or refining of weapons in flight require in-depth knowledge of the limits placed on such systems – not so much by the limitations in hardware or software, but by the human operator.
One key element within NEC is the improved air-to-surface weapon aiming that can be achieved through the ability to remotely update information on the weapon whilst it is in flight. The main advantage of such a capability is the extended ‘stand-off’ range of a platform. Stand-off range is the ability to attack targets/launch weapons against targets from outside of the range of their defensive capabilities. However, extending the stand-off range of a weapon system increases the time of flight of the weapon. This increases the chance the target has to attempt to evade the incoming attack through evasive manoeuvring or by moving into cover, and allows time for the situation on the ground to change significantly. Furthermore, civilians or non-combatants may have come within the effect of the weapon. These uncertainties require increased tactical command of these weapons during their flight, so that appropriate target position up-dates or abort commands can be transmitted to the weapon should the situation change.
act of providing refined target coordinates to ensure that the weapon hits the target as intended – this is particularly relevant for moving targets.
Re-tasking an air-to-surface weapon remotely to different targets is not only a sig-nificant technical challenge but also a human factors challenge. The way in which specific information relating to a weapon’s capability to be re-tasked is displayed to a remote operator to support their decision making is critically important. Further, an understanding of the boundaries and limitations that exist within the domain of re-mote operation of Network Enabled Weapon (NEW) are needed to allow commanders to configure military engagements in a way that is not too demanding of operators. This thesis describes an investigation into the way in which re-tasking information is displayed to operators of remote weapon systems, and the limits that the operator has when using these systems.
Firstly, a simulation test-bed facility was developed to represent air-to-surface engage-ments in a safe, controlled research environment. This simulation test-bed facility exists in a distributed network of aircraft simulators at the University of Liverpool, and has been extended as part of this research to include two real-time air-to-surface weapon simulations and a simulated remote operator terminal.
This test-bed facility enabled the human factors research to be conducted into the best display methods of re-tasking information and the workload factors associated with them. The first human factors trial sought to find the best way of visualising the Re-task Availability Region (RAR) of an in-flight air-to-surface weapon. The RAR is the area on the ground (for air-to-surface weapons) to which the weapon can be safely re-tasked and is affected by the weapon’s proximity to the target and by the physical limitations of the weapon such as its aerodynamic and propulsion properties. Two methods of displaying the information were used. A RAR polygon overlaid on a map display, and a numeric representation of the RAR capability adapted from the RAR values made up the two different formats. A participant group was presented with these two different display formats and tested for decision making accuracy and reaction time for a set of scenarios.
The results of these human factors trials and recommendations for practitioners when developing future remote operator terminal displays are presented and discussed in this thesis. The findings of this research aim to lay out a baseline standard for the development and use of remote re-tasking systems for military applications.
1.2
Structure of Thesis
This thesis is divided into 6 further chapters:
• Chapter 2 is an overview of the relevant research in the fields of weapon simu-lation, air-to-surface weapon developments, ecological and other methods of de-signing graphical user interfaces, as well as the psychology disciplines of decision making and cognition.
• Chapter 3 details the necessary computational steps needed for simulation of both the weapon systems and the network protocol used to communicate information between different ‘players’ in the simulation.
• Chapter 4 describes an overall picture of a battle-space where there are multiple targets, target types and multiple delivery aircraft (platforms) each with different sets of weapons. It goes on to offer several solutions to the task allocation problem, where the platforms and their weapons need to be tasked to the targets in order to achieve a stated military objective.
• Chapter 5 discusses the first of two participant studies carried out as part of this research. The study involved participants, acting as a remote weapons operator, re-tasking a single weapon to a emergent target of opportunity.
• Chapter 6 is the second of the two participant studies. This study involved participants freely re-tasking multiple weapons amongst multiple targets given a set of objectives in a Suppression of Enemy Air Defence scenario.
• Chapter 7 concludes the thesis, detailing specific contributions made and the
1.3
Publications
1.3.1 Conference Papers
Davis, J. K., Griffith, E. J. and Ralph, J. F. Real-Time Task Allocation for Remote Weapon Operators, In Proceedings, ISIF FUSION, Istanbul, 2013.
1.3.2 Conference Presentations
Davis, J. K., Power, N., Davies, J., Ralph, J. F., Alison, L. Simulation of Network Enabled Weapons and SPEAR Strike Capabilities at “Hitting the Target?” How New Capabilities are Shaping Contemporary International Intervention, Centre for Interna-tional Intervention, University of Surrey, 2012.
Davis, J.K., Mehta, M., Ralph, J.F., Power, N., Alison, L.Remote Operator Terminal Design for use in a Real-Time Distributed Simulation Environment at RAeS Simula-tion and Mission Training Conference, RAeS, London, 2013.
Davis, J.K., Griffith, E.J., Mehta, M., Ralph, J.F. Distributed Simulation of Super-vised UAV at RAeS Flight Simulation Seminar, University of Liverpool, 2014.
Davis, J.K., Ralph, J.F., Power, N., Alison, L.Suppression of Enemy Air Defence – A New Targeting Capability at RAeS Delivering Weapon System Effects: The Contrast Between Piloted and Remotely-Piloted Platforms, QinetiQ, Malvern, 2015.
1.4
Novel Contributions
This thesis covers the Systems Engineering and Human Factors of re-tasking NEW, specifically focussing on the design and use of remote operator terminals for the first time in open literature. Two main sets of novel findings are presented herein.
Secondly – investigations into the effects of simultaneous multiple re-tasking on op-erator performance revealed that whilst there are real identifiable limits on the number and frequency of simultaneous weapon engagements that can be handled by an opera-tor, performance is sufficient to manage the task at a reasonable pace. An automated re-tasking system was used to establish a baseline ideal performance across scenarios where acknowledged communication and weapon system limitations were built into the system. Performance of human operators was compared to the automated process with some interesting comparable results. Human operators are able to maintain sufficient performance until a point where the additional workload, caused by having a large num-ber of weapons to re-task in a short period of time, causes a drop off in performance. It is necessary to credit MBDA Systems for their input when designing a potential future scenario of particular interest to both the military and industry.
Chapter 2
Literature Review
This thesis encompasses several fields of academic and industrial research. These are Aerospace, Systems & Networking (Engineering) and Human Factors, Ergonomics & Human Computer Interfaces (Psychology). It is necessary to draw from these fields of research in order to fully place and understand the research embodied herein. For the purpose of this literature review several main areas will be discussed as related to their fields, but firstly the relevant background behind the overall project will be discussed.
2.1
The History of Data and Communication Networks
Data communication networks are not something recent. Carrier pigeons were used from 2900 Before Common Era (BCE) [6] and records from as early as 2000BCE indi-cate the use of complex communication relay systems using messengers on horseback and relay posts [6]. The Byzantine Navy had a well established method of communi-cating command intent between ships in naval battles by raising different flags, dating back to 800BCE [6]. For longer distance communication fire beacons as warnings sig-nals were used and can be dated back to 650BCE [6]. Whilst they are fairly simple, the beacon signal can be considered as one bit of binary data that travels as fast as the speed of light. Ranged communications could now travel almost instantly between relay points and no longer took days to travel by horseback or pigeon.
the communication network. Only ’Superintendents’ at each end of a chain – or based in strategically important locations – were able to decode the messages. A complex set of control signals existed to communicate the priority of messages, handshakes and potential breakdown issues of the network.
The invention of the Electrical Telegraph, and then the rapid development of com-munication technologies from the mid 19th Century, provided the foundations for the complex telecommunications networks of today. Many lessons have been learned about the importance of such communications infrastructure in the military environment from the strategic and tactical failures and successes during the First and Second World Wars. The benefits of the rapid development of portable electronic equipment across a very wide range of uses has shaped the outlook for future uses of such technology. Now, in the 21st Century, technology such as digital radio communications has matured to the level that it can and is being exploited by the more advanced militaries to increase their capabilities beyond simple voice radio communications.
One such development is NEC, the use of electronic, radio and information technology to create a network of networks to distribute command intent, share sensor data and intelligence, as well as provide communication channels for units within the British Armed Forces and North Atlantic Treaty Organisation (NATO) Allies [1]. First an-nounced in 2005, the United Kingdom (UK)’s NEC is more recent, compared to the United States of America (US)’s Network-Centric Warfare (NCW) concept proposed in 1998 [7]. NEC integrates several programmes with an aim to synchronise all operations from the tactical up to the strategic level and share relevant information between both commanders and units in order to mount seamless joint service missions. In theory, this will allow the military as a whole to use the correct force and tactics where needed. For example, providing Close Air Support (CAS) to the front line, whilst keeping track of ground force positions, or monitoring the remaining ammunition levels of forces de-ployed across the globe. However, in practice the adoption of new technologies often throws up more unforeseen challenges, particularly surrounding the utility of systems that present information for an operator. How long these teething problems last can be dramatically reduced through insightful research into these areas.
Air Force (RAF) Jaguar, whose pilot then digitally transferred the target information to the aircraft’s weapon system. The work, named ‘Project Extendor’, ran from 2001 through to 2006 [9–11]. The modernisation of CAS and remote targeting has been in-fluenced somewhat by the changing environment in which countries carry out military campaigns; as coalition forces, rather than as individual nation states. In this instance, Project Extendor was carried out to show the UK’s Time Sensitive Targeting (TST) system for the NATO requirement on the coalition forces to produce TST systems [12]. Providing friendly force location allows the aircraft systems to check that no friendly forces are at risk of fratricide from the weapon. The individual responsible for manag-ing the weapon systems on-board the aircraft – be it the Pilot in a smanag-ingle seat aircraft or a Weapons Officer (WO)/Navigator in a two or more seat aircraft – can also choose a different weapon so as to minimise the risk of collateral damage [13].
2.2
Technology Context
The focus of this thesis surrounds the potential use of NEC for improving the capabil-ities for air-to-surface weapon aiming and target assignment management. Although there has already been some development work in the area of networking weapons and extending the targeting capabilities of weapon systems, the impact this will have in complex time-critical situations has not yet been investigated in open literature. Whilst this technology advance will help to increase the utility of weapon systems after the point of launch from the delivery aircraft, the risks of collateral damage will increase as the flight ranges of modern weapons are extended. Presently there are limited num-ber of weapons that have been demonstrated which include an Improved Data Modem (IDM) for the purpose of allowing remote operation of the weapon [4, 14]. However, the next generation of weapons will have this network capability [15]. It is therefore imperative that research is carried out to establish some form of guidelines as to how such weapons might be used and how best to present information to operators whom are responsible for them.
2.2.1 Networked Close Air Support and Sensor To Shooter Capabil-ities
order to transfer the target information the FAC needs to read out the ‘9-Line Brief’, a standardised NATO briefing tool for CAS [16]. A typical example would be:
• Initial Point: Charlie 12345.
• Target Bearing: 100 True.
• Target Distance from IP: 10 Nautical Miles.
• Target Position: North 12.345678 Degrees, East 12.345678 Degrees.
• Target Elevation: 12345 Feet.
• Target Description: Infantry Unit in cover...
• Mandatory Attack Heading: 123 True.
• Friendly Distance: SW 10 Nautical Miles.
• Time on Target: 12Hrs 34Mins.
This message would need to be read over the secure radio network to the Pilot or WO/Navigator (if the aircraft was a multi-seat aircraft), who would then need to physically write it down [8]. If the target is being lased (the act of shining laser energy onto the target with a laser designator) the FAC would also need to communicate the laser designator’s code. Once the message has been received, the Pilot or WO would then need to enter this data into the weapon targeting system for the specific weapon, and read back the information to the FAC for confirmation, before being able to attack the target. This process is clearly time consuming and has many opportunities for errors to occur such as the misinterpretation of information.
2.2.2 Risks in Air-Strikes and Sources of Error
0 5 10 15 20 25 Platform Configuration
Environmental Equipment/Technology Physical/Psychological Situational Awareness Pre-Deployment Teamwork Cognitive Factors Misidentification Command and Control Procedures Communications and Information
Percentage of Incidents
US %
[image:35.612.154.512.72.295.2]UK %
Figure 2.1: UK and US Causes of Fratricide
Whilst the above factors account for around 37% of errors, another error which can occur is the obtaining of an incorrect range from laser ranging equipment by improper use. This can happen when there is a slight misalignment between the sight and the target, and the laser energy reflects off an object closer to or further away from the FAC. A misalignment may not be apparent due to the fact that the laser spot on the target is often not visible in the view finder or other imaging equipment due to the difference between the waveband that the lasers operate in and the range of wavebands that make up the visible spectrum that a human can see. This means that the laser spot cannot always be visually verified to be in the correct place. If laser ranging is carried out incorrectly, and the target range is very short, there is a possibility that the target location could be so close to the FAC that he or she is in the Risk Estimated Distance (RED) of the weapon to be launched [19]. There is a need for techniques to remove risks from procedural, communication and information errors when using any weapon system, and although there has been some success, achieved through the digitisation of these elements, there is still more that can be done.
BFT is given as the colour blue is the standard colour for friendly troops (red being hostile/enemy) in NATO countries [20]. The FBCB2 is one such a system developed by the US between 1995-2004 to increase Situational Awareness (SA) and real-time representation of the battlefield situation to commanders [21].
CAS missions and targeting are now at a stage where a FAC can fix the location of a target using GPS-equipped binoculars and range finding equipment. This target position can then be correlated with information on the network, for example the radar track of an identified hostile vehicle. The FAC can then locate an available CAS aircraft using a BFT system. The FAC can then contact the attack aircraft directly to request CAS. Upon confirmation of a task, the FAC can send a data packet containing the target and friendly force (own location) information directly to the aircraft’s weapon computer – to be used by the Pilot or WO/Navigator – removing the risk for verbal communication misinterpretations and decreasing the time it takes for the information required to be transmitted.
One issue with this practice – and in general the overall practice of CAS missions – is the way in which they tie in with the overall tactical air picture. Militaries may provide CAS through a number of different aircraft types – each with their own levels of anti-surface capability. For example, Apache Helicopters are equipped with guns, rockets and Hellfire missiles for short range anti-personnel and anti-armour roles. When operating in Afghanistan their role was to provide ‘top cover’ to ground troops during missions [22]. Harrier (before their retirement) and Tornado attack aircraft were also operational in the same airspace and predominantly used for pre-planned air-strikes. However, Harriers and Tornados were both tasked to CAS missions at points in their deployment [23, 24]. In a complex and often cluttered airspace above any land battle there may be tens of operational aircraft from surveillance, re-fuelling, transport and attack roles. When a FAC orders a CAS air strike on a position, it will be of great importance that the assignment is appropriate and of measurable effects in accordance with Rules of Engagement (RoE), and that the tasking does not impact adversely upon other strategic requirements. The task allocation problem is still one that must be in-vestigated so that a FAC or ground operator can optimise aircraft assignments, and more importantly specific weapon assignments, quickly in this complex dynamic envi-ronment.
were sent targeting updates from an airborne BAC 1-11 test bed aircraft [25]. The UK company QinetiQ then developed a capability to communicate with a weapon in-flight under the Integrated Sensor to Effect (ISE/S2E) program. The initial proof of concept was completed in December 2005 [26], with its first successful demonstration in 2007 [27]. In this demonstration, an Enhanced Paveway II (ePWII) GPS guided weapon was redirected in flight against a moving target. This demonstrated the ability to use an IDM to transmit targeting updates to a weapon in-flight. The US Navy demonstrated their first use of a NEW in use against a mobile maritime target [28] in late 2011. During the US Navy’s test, the weapon (a JSOW C-1) was launched by an F/A-18 E/F and was able to receive in-flight target position updates via a Link-16 network from a third-party. In this case the third party was an on shore naval ground station who’s data was relayed via aircraft. These weapon trials were proofs of concept for the transfer of control authority of a weapon system after launch to a remote location, and the foreseeable future of modern air launched weapons. The development of this capability now raises the question of how well a weapon can be controlled, or rather have its targeting information updated, by a remote operator and how to display this information in order to make best use of the weapon’s full capability.
One method of visualising how a ‘third-party’ may control a NEW can be adapted from the widely used Launch Acceptability Region (LAR). LARs define the area in space from which a weapon may be released against a target [29–33]. These areas can be small or large, depending on both the position and flight conditions of the carrying aircraft as well as on the physical characteristics of the weapon, for example, whether it is powered or unpowered. Research into improving the working environment and user interfaces for WOs on-board B-1B bombers releasing the GPS guided Joint Direct At-tack Munition (JDAM) was carried out by the US Air Force Engineering Directorate of Aeronautical Systems Center [34, 35]. This research incorporated the use of static LAR overlaid onto a 2D map view of a set of targets. These static LARs were pre-calculated based upon mission requirements and uploaded to the aircraft’s weapon computer be-fore flight. The static LAR display was integrated into the weapon operator station as a decision aid for the WO to assign and launch weapons against the target set efficiently through being able to see and predict the scheduling of weapon launch events. It was greeted with strong enthusiasm by the participating flight crews [35] (pg.32).
be provided to the WO. A RS is the area on the surface that is within the weapon’s capability at that point in time given the release aircraft’s current position and flight conditions [37]. The RS can be utilised far more than the LAR in the sense that an operator could use the information to assess whether a weapon can hit other targets from its point of release, rather than retrospectively looking for the correct drop point for a weapon to hit a single specific target. If the RS can be calculated in real-time based upon the current position, velocity and attitude of the aircraft, then it should be straightforward for a network enabled weapon to have its own RS, which could be generated and updated continuously in real-time and presented to a remote operator live.
Both LAR and RS are terms that are static and are concerned with the ability of the weapon whilst still being carried by an aircraft. Once the weapon is launched, a new term is needed to describe the ability of the weapon to hit alternative targets or to abort if the situation changes whilst it is en-route to the intended target. The term Re-task Acceptability Region will be used herein to define a RS that is calculated and updated in real-time whilst a weapon is in flight. It defines the area on the surface to which a NEW can be re-tasked to when in flight and still prosecute the target suc-cessfully. The aim is for this to be both generated and presented in real-time, with minimum latency.
Launch
Mid Phase
Terminal
[image:39.612.139.505.108.347.2]RAR TGT
Figure 2.2: Phases of Flight for Air-to-Surface Bombs
Launch
Glide
Cruise/Mid
Terminal
RAR TGT
[image:39.612.133.513.441.679.2]In Launch or fly out, the RAR remains fairly constant in size and shape, as typically this phase of flight is only a matter of seconds. During the Mid-Course phase the RAR begins to reduce in size slowly and at a constant rate. Then, as the weapon approaches and enters the Terminal Phase of flight, the RAR starts to decrease significantly, col-lapsing in as the weapon falls closer to the surface. Weapons would not normally be re-tasked during their Terminal Phase because the weapon is locked on to the target and has very limited alternatives during the short time immediately before target in-tercept. Instead, it would be sensible to only consider re-tasking a weapon during the Mid-Course phase of flight. However, this is a novel situation which needs research into this cut-off point and sets of guidelines for system developers. These have not yet been fully explored or been documented in the public domain.
For an operator, who is in control of the weapon via NEC, the collapse of the RAR poses a problem. At what point does the weapon become committed to the target? Although the RAR decreases in size, it may be necessary to be able to re-task a weapon that has already been committed to a target in order to hit a more immediate-risk, a high-value target, or even to abort the attack. Two such scenarios exist where the RAR would be utilised to great effect. These are the re-tasking of weapons aimed at non-time-sensitive targets to emergent threats or for CAS tasks, or the use of re-tasking to manage the allocation of weapons aimed at targets in a scenario where weapons may be lost in flight due to enemy fire.
2.2.3 Rules of Engagement Considerations
RoE are the guidelines set out at a national command level which are used by all forces, to define when and in what manner force can be used justifiably against an enemy. The RoE in modern conflicts are a great deal stricter than in previous ‘Total’ wars such as World War II. The main differences arise from the role that the UK and Coalition forces are playing in current operations and the threats to our forces and nationals. Under the United Nations (UN) Charter and international law the use of force or threat of use of force are prohibited except for self defence or when authorised by the UN Security Council to maintain or restore international peace and security, such as the United Na-tions Operation in Somalia (UNOSOM I) 1992 [39, 40], which allowed a US led United Task Force (UNITAF) to operate in Somalia to enforce peace.
against different enemy unit types, as well as limiting the risk of collateral damage and risk to friendly forces. The RoE are used to ensure that the force applied is justified and that the minimum force necessary is used to achieve the desired effect on the battlefield.
For RoE to be satisfied when prosecuting targets there is a need for someone in the ‘kill-chain’ to have ‘eyes on target’ – verified through visuals of Electro-Optical sensors, and a calculation of the expected Battle Damage Estimates [41]. Given the capabilities that NEC provides, an operator could be located remotely from the real world environ-ment in which an engageenviron-ment may be happening. This is made possible by the wealth of information and high integrity communication channels available to assist them in making a firm judgement on the appropriate method of prosecuting a target, which will include the RoE in effect at that time for that particular operation.
Furthermore, there is a need for remote operators to have an up-to-date assessment of the significance of a target and the value of attacking it [11]. If there is a choice of methods, the commander should select those which minimise collateral damage and civilian casualties. The commander is entitled to take into account other factors such as stock levels, future demands, the timeliness of the attack and the risk to his own forces, however, there may be RoE which require a commander to accept a higher level of risk to his own forces in order to reduce or avoid collateral damage and civilian casualties.
2.2.4 Dynamic and High Fidelity Modelling of Network Enabled Ca-pabilities
In order to successfully test the impact of NEC on the way in which air-to-surface target engagements can be managed remotely, the system itself needs to be simulated. This simulation needs to be real-time, realistic, and holistic in its approach so that the breadth of both technical and psychological challenges can be tackled. A variety of algorithms and simulations have been generated from within the Autonomous Systems and Big Data research group at the University of Liverpool’s Department of Electrical Engineering & Electronics including the following: targeting systems [42, 43], sensors and imaging [44, 45], navigation via visual scene matching [46], feature recognition and tracking [47], weapon guidance [48], and task allocation algorithms [13, 49].
There are several different key areas of simulation that must be carried out to establish a test-bed for human factors testing. These are as follows:
• Weapon: Six Degrees of Freedom Simulation
• Weapon: Launch System Interface Simulation
• Remote Operator Station
• Distributed Interactive Simulation Networking
• Target Simulation
These elements can be considered parts of an overall holistic simulation environment. Chapter 3 covers the methods of simulation in more detail.
2.3
The Human Side of Complex Systems
Given the new features that NEC and NEW provide the military, the Human Factors issues that surround the use of future remote operator systems must be investigated to ensure that any interface system developed is fit for purpose. Whilst studies in Human Factors for network enabled systems may be conducted by manufacturers and other defence organisations, it is also important for the academic community to engage with this topic. Such engagement allows advances from academic research to be fed into the design and development of new military systems. Known methodologies from related human factors research can be applied to existing or future military systems such that improvements can be made, from increasing the SA of the operator, to expanding their potential job role through effective ecological interface design – a framework used to avoid interfaces contributing to the difficulty of a task [50]. Relevant information in this research area should be visible to and comprehensible by the general public to avoid misinformation being propagated in the absence of valid research. From the coverage of recent conflicts in the Western media, it is clear that confidence in remotely controlled military operations is at a low ebb [51], and although a recent YouGov poll suggests that the public are becoming more accepting of Unmanned Aerial Vehicle (UAV) for civilian use in principle, opinion is still divided as to the foreign policy determining their use by the military [52]. More openness and clarity can be found through collaborative academic-military research.
until needed [5]. However, the Loitering Munition element of the UK MoD’s Complex Weapon program has not conducted a capability demonstration in Afghanistan ‘due to system maturity’ [53] (pg. 17).
For any remote operator terminal system there needs to be a robust networking pro-tocol and a usable interface to provide decision making cues to an operator. There are several areas to draw knowledge from regarding how best to present re-tasking infor-mation to an operator. Once such area is the research into Decision Support Systems (DSS). These are systems that facilitate human decision making when information may be difficult to process in its raw form – or needs to be relayed through electronic com-munication channels before being reconstituted on a display. The following sections introduce the areas of psychology that must be considered when developing the neces-sary human computer interfaces to support decision making when using NEC systems.
2.3.1 Situational Awareness and Decision Making
NEC is primarily concerned with effecting major improvements in the military through increasing the amount of information available to commanders and operators of remote systems, and providing them new capabilities using new network connections. However, having large amounts of information, or data, does not necessarily translate into having good SA or improving the decision making of personnel. SA is defined in three levels as: “the perception of the elements in the environment within a volume of time and space, the comprehension of their meaning, and the projection of their status in the near future” [54]. The three levels of SA are split therefore as follows [55]:
• SA Level 1: Perception – The perception of cues and elements in the current situation.
• SA Level 2: Comprehension – The integration of multiple pieces of information and a determination of their relevance to the person’s goals.
• SA Level 3: Projection – The ability to forecast future situation evens and dy-namics.
SITUATION AWARENESS
•System Capability
•Interface Design
•Stress & Workload
•Complexity •Automation Perception of Elements in Current Situation Level 1 Comprehension of Current Situation Level 2 Projection of Future Status Level 3 Decision Performance of Actions
•Goals & Objectives
•Preconceptions (Expectations) •Abilities •Experience •Training Information Processing Mechanisms Long Term
Memory Stores Automaticity State of the
Environment
Feedback Task/System Factors
[image:44.612.88.499.73.378.2]Individual Factors
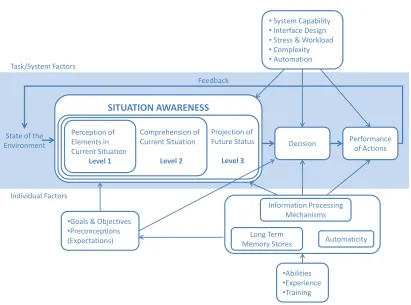
Figure 2.4: Model of SA in Dynamic Decision Making
Figure 2.4 shows Endsley’s SA model in Dynamic Decision Making [56]. It includes in the centre, the model of SA, including decision making. It also expands into Task/System factors and Individual factors relating to SA. Of the Task/System fac-tors, issues such as interface design and stress/workload are identified. Further, Endsley states “The highlighted emphasis on SA in current system design has occurred because (a) we can now do more to help provide good SA through decision aids and system in-terfaces, and (b) we are far more able to actually hinder SA through these same efforts if, as designers, we fail in adequately addressing the SA needs of the operator.” [55] (pg. 6).
System
Real World System
Knowledge
Interface Knowledge
System
Real World System
Knowledge
Interface
Knowledge
SA
Team Members & Others Direct Observations
Figure 2.5: Sources of SA Information
The move towards remote systems – particularly with regard to NEW – involves the removal of the operator from the direct environment in which the actions of entities are taking place. Lots of subtle cues exist in the real world environment that are lost through remoteness and the effects of these are yet to be fully rationalised. In the environment where remote operators of NEWs will carry out their jobs, the user inter-face will be burdened with providing operators almost all of their environmental cues to facilitate operators’ ability to build SA. It is therefore imperative that SA design principles are taken into consideration when investigating the user interface.
Endsley published a set of thirteen SA design principles as part of her work on the Situational Awareness Global Assessment Technique (SAGAT) [54, 58]. The six main principles that are salient to the research and investigations developed in this thesis are:
• Minimise divided attention requirements, information should be grouped in terms
of spatial proximity and multiple pieces of information embedded within objects. Attention shifts should be minimised and the number of display sources reduced (Req. 1).
• Information grouping should be used to attach multiple attributes to each object,
• It is unnecessary to display systems functioning normally and instead only de-viations from normal system states should be presented when they occur (Req. 5).
• Information that contains information about trends or rates, or that allows the trends or rates to be determined should be available (Req. 6).
• “The most important information should be the most salient perceptually to insure focussed attention after pre-attentive processing” (Req. 7).
• “Verbal information requirements on short term memory should be minimised,
particularly for spatial information” (Req. 9).
Memory in its entirety is used in a variety of ways when relating to SA and the process of decision making. There are currently three widely accepted forms of memory:
• Long-Term Memory is the store of knowledge and experiences that have been acquired by a person over their lifetimes [59].
• Short-Term Memory is the part that “can hold a limited amount of information in a very accessible state temporarily” [59].
• Working Memory is a multi component system that holds and manipulates
infor-mation in Short-Term Memory; it is used to plan and carry out behaviour [59,60]. It is also described as the attention-related aspect of Short-Term Memory [61].
The attention of individuals (and thus working memory) must be drawn to important elements displayed on interfaces to maintain SA. A study by Jones and Endsley found that failure to attend to information that was available to individuals was the most frequent factor associated with errors in SA despite the research being carried out on fully trained and experienced aviators [62].
presented may be disregarded in order to maintain the current schema (mental model) being applied to the situation resulting in errors in SA [64]. Poor application of mental models to situations was found to represent 18% of SA errors in Jones and Endsley’s study [62].
However, it has been found that experienced decision makers using mental models generally outperform novices when making decisions in time critical, high stake situ-ations [65]. It has also been shown that in these high stake, time-limited scenarios, where there are few quantitative cues, that experienced decision makers rely on heuris-tic, simple problem solving strategies [66–70]. These mental models applied by experts are often useful in practice. Nonetheless, novices can still provide useful insight when carrying out principle testing of DSS usability. The use of novices mitigates against the potential of unknown mental models being applied to the task – which is beyond the scope of the research presented herein.
Decision making cannot be duly covered without mention of Boyd’s Observe Orient Decide Act (OODA) loop [71]. The loop, shown in Figure 2.6, is a decision cycle posited in four main levels. Observe, Orient, Decide and Act. Decision making is argued to occur in this cycle whether in military uses or in other areas such as busi-ness. It is argued that the speed at which this process can be repeated indicates the individual’s ability to make effective decisions. The OODA loop relates to the studies presented herein in that individuals must be able to process information quickly and then act on the information. Network Enabled Weapon interface systems must allow for quick acquisition of the information available to assist in decision making.
Orient
Act
Observe Decide
The problem that designers face is the disconnect between data and information. The information that is needed in order to support effective decision making may not, and often does not, correspond directly to the data that is produced. Data must be sorted and processed by the human to find and integrate the information needed for good SA before making an effective decision. More data, does not mean more information, nor does it mean good SA or a better Decision Making process [55]. Therefore it is of great importance to establish the benefit of different methods of displaying data and information so that decision making is facilitated rather than hindered.
2.3.2 Graphical vs. Numerical Display Format
The study of graphical vs. numerical displays for DSS is a well covered area of Hu-man Factors research that stems from perceptual based reasoning and the ecological approach to visual perception and interface design [72, 73]. However, little of this re-search has been applied to the area of Network Enabled Weapon systems outside of the security-limited commercial world of the defence industry. This thesis aims to bridge this gap.
It is widely accepted that there are two main types of information processing that occur within the brain, Analytical and Perceptual processing.
• Analytical processing: “focussing on a salient object independently of its context” (page 467) [74]
• Perceptual processing: “attending to the relationship between the object and the context in which the object is located” (page 467) [74]
Unsurprisingly, it has been shown that spatial or geo-spatial information is associated with perceptual processing and that specific data extraction, or obtaining direct values, are associated with analytical processing [75]. The Theory of Cognitive Fit suggests that to achieve effective and efficient decision making, the DSS format should ‘fit’ (i.e. match) the context of the task [75]. Failure to do so will increase the level of cognitive effort required to respond and complete the task and lower the accuracy of decision making. Therefore, for spatial tasks, graphs are more useful than tables in facilitating timely decision making, but do not improve decision accuracy. Similarly for symbolic tasks, tables/symbolic representations outperform graphical representations in decision making speed, but both have equivalent performance in accuracy [75].
making can be achieved using spatial representation for all tasks, except those that were complex-symbolic tasks (those tasks which require participants to establish the relationships between words). In the complex-symbolic tasks both graph and table rep-resentation drew similar decision making times from participants. Cao [77] found that cognitive load is reduced when using image/graphical presentation for a geo-spatial resource allocation task. It has also been found that for dynamic situations, decision making performance in terms of reaction time and accuracy between graphical and numerical representation was similar, with only a difference in attention levels [78]. In Gonzalez & Golenbock [78] participants were tasked to distribute water amongst tanks using a simulated water purification plant control terminal. By measuring eye movement it was determined that throughout the trials participants attention within the graphical condition remained constant over time, whereas participants in the nu-merical condition had increased attention in the same period. This suggests that more effort is required when the information representation is numeric. Studies have shown that there is a solid link between attention and effort, and that spare capacity – the indication of the amount of effort being exerted by a subject [79] – can be inferred from the level of attention given to a task [80–85].
More recently, individual differences have been quantified when using different dis-play methods to communicate heath risk and treatment risk to patients [86]. They found that graphical literacy (one’s ability to interpret data represented graphically) was a good indicator of an individual’s ability to interpret graphical and numerical forms of data. High graphical literacy translates to higher performance when using graphical displays and low performance when using numerical displays. The opposite is found of those with low graphical literacy. However, numeric literacy (one’s ability to understand and use mathematics) only affected participants’ ability to use numerical displays and has no effect on ability to use graphical displays.