“DIAGNOSTIC PERFORMANCE OF COMPUTED TOMOGRAPHIC CORONARY ANGIOGRAPHY FOR EVALUATION OF CORONARY ARTERY STENSOSIS IN INDIVIDUALS WITH TYPICAL OR ATYPICAL CHEST PAIN WITHOUT KNOWN CORONARY ARTERY DISEASE”
DISSERTATION SUBMITTED TO
THE TAMIL NADU Dr. M.G.R MEDICAL UNIVERSITY, CHENNAI IN PARTIAL FULFILLMENT OF THE REGULATIONS FOR THE
AWARD OF DEGREE OF M.D IN RADIODIAGNOSIS.
BY
DR . SUGANYA SUBBULAKSHMI.J GUIDE : DR .ELANGO MD DMRD
DEPARTMENT OF RADIOLOGY
PSG INSTITIUTE OF MEDICAL SCIENCES AND RESEASRCH PEELAMEDU, COIMBATORE – 641004
“DIAGNOSTIC PERFORMANCE OF COMPUTED TOMOGRAPHIC CORONARY ANGIOGRAPHY FOR EVALUATION OF CORONARY ARTERY STENSOSIS IN INDIVIDUALS WITH TYPICAL OR ATYPICAL
CHEST PAIN WITHOUT KNOWN CORONARY ARTERY DISEASE”
DISSERTATION SUBMITTED TO
THE TAMIL NADU Dr. M.G.R MEDICAL UNIVERSITY, CHENNAI IN PARTIAL FULFILLMENT OF THE REGULATIONS FOR THE
AWARD OF DEGREE OF M.D IN RADIODIAGNOSIS.
BY
DR .SUGANYA SUBBULAKSHMI.J GUIDE : DR .ELANGO DEPARTMENT OF RADIOLOGY
PSG INSTITIUTE OF MEDICAL SCIENCES AND RESEASRCH PEELAMEDU, COIMBATORE – 641004
CERTIFICATE BY THE GUIDE
This is to certify that the dissertation entitled
“
DIAGNOSTICPERFORMANCE OF COMPUTED TOMOGRAPHIC CORONARY
ANGIOGRAPHY FOR EVALUATION OF CORONARY ARTERY
STENSOSIS IN INDIVIDUALS WITH TYPICAL OR ATYPICAL
CHEST PAIN WITHOUT KNOWN CORONARY ARTERY
DISEASE
”
is the bonafide original work of
Dr.Suganya
Subbulakshmi.J
in the department of Radiodiagnosis, PSG
Institute of Medical Sciences and Research, Coimbatore in partial
fulfillment of the regulations for the award of degree of M.D in
Radiodiagnosis.
Signature of the guide
Dr. Elango .R MD DMRD
Professor of Radiology
Department of
Radiology
P.S.G IMSR,
CERTIFICATE
PSG INSTITIUTE OF MEDICAL SCIENCES AND RESEASRCH
COIMBATORE
This is to certify that the Dissertation work entitled “DIAGNOSTIC PERFORMANCE OF COMPUTED TOMOGRAPHIC CORONARY ANGIOGRAPHY FOR EVALUATION OF CORONARY ARTERY STENSOSIS IN INDIVIDUALS WITH TYPICAL OR ATYPICAL CHEST PAIN WITHOUT KNOWN CORONARY ARTERY DISEASE” is the bonafied work of
Dr.Suganya Subbulakshmi.J in the department of Radiodiagnosis, PSG
Institute of Medical Sciences and Research, Coimbatore in partial fulfillment of the regulations for the award of degree of M.D in Radiodiagnosis.
Dr. B.DevAnand Dr.S. Ramalingam
Professor and HOD Principal
Department of Radiodiagnosis PSG IMS & R PSG IMS & R
ACKNOWLEDGEMENT
Foremost, I would like to express my sincere gratitude to my professor and HOD Dr. B. Devanand and my guide DR .Elango for his ever friendly co-operation which was present throughout the preparation of this work. This work would not have been possible without his guidance, support and encouragement. Dr. B. Devanand will always be a key inspiration to me.
I would like to thank Dr.S. Ramalingam Principal of PSG medical college for providing me with the opportunity and resources to accomplish my research
I would like to thank and express my sincere gratitude to Dr. Rajakumar and Dr. Maheswaran for providing me with the motivation to complete my research work and helping me with the statistical analysis and proof reading, enabling me to complete this study.
TABLE OF CONTENTS
S. NO CONTENT PAGE NO
1 INTRODUCTION 1
2 AIMS AND OBJECTIVES 4
3 MATERIALS AND METHODS 6
4 REVIEW OF LITERATURE 13
5 OBSERVATION AND RESULTS 30
6 DISCUSSION 58
7 SUMMARY 64
8 CONCULSION 66
9 LIMITATIONS & RECOMMENDATIONS 68
10 IMAGES 71
11 BIBLIOGRAPHY 80
12 ANNEXURES 84
ABSTRACT
AIM & OBJECTIVE Primary Aim of the study
1. Detection of coronary artery stenosis with CT coronary angiography in comparison with conventional coronary angiography
2. Correlation of grading of stenosis in CT coronary angiography with conventional coronary angiography
Secondary aim
To assess the normal luminal diameter of coronary arteries on CT coronary angiography in Indian population
MATERIAL AND METHODS
RESULTS
Stenosis of more than 50% was considered as significant stenosis. Sensitivity, specificity, PPV and NPV for significant stenosis were 93%, 98%. 90% and 98% respectively in our study. Over all sensitivity, specificity, PPV and NPV for detecting stenosis in CT was. 87.8%, 97.9%, 92.3 %and 96.5% respectively.
CONCLUSION
Based on the study CT coronary angiography is sensitive in
detecting clinically significant stenosis provided the quality of the
image is adequate.
INTRODUCTION
Chest pain is the presenting symptom for a number of clinical condition.. The cause of chest pain must be diagnosed and accordingly treated, especially if the cause is of cardiac origin. Ischemic heart disease is one among the most common and important pathology. The underlying pathology is due to atherosclerosis of the vessels.
Catheter angiogram is considered as gold standard in detecting coronary artery stenosis. It is an invasive procedure and has more complications related to catheter placement and patient recovery. Non invasive imaging of coronaries is possible now due to the development of multi-detector row computed Tomography. Multiple studies have proved that if image quality is adequate then coronary stenosis can be visualized accurately. It provides additional information about the nature of plaque and plaque composition. The plaque can be characterized as vulnerable plaque or stable plaque.
AIM OF THE STUDY:
Primary Aim of the study
1. Detection of coronary artery stenosis with CT coronary angiography in comparison with conventional coronary angiography
2. Correlation of grading of stenosis in CT coronary angiography with conventional coronary angiography
Secondary aim
INCLUSION CRITERIA:
Patients presenting with typical / atypical chest pain undergoing
both CT coronary angiogram and catheter angiogram
Patients who are capable of understanding the study constraints and
conform with the guidelines of informed consent
EXCLUSION CRITERIA: Pregnancy.
Patient allergic to iodinated contrast
Serum Creatinine greater that 1.4 mg/dl
Cardiac rhythm abnormalities.
Patients with heart rate >70bpm and in whom
beta-blocker, calcium-channel blocker are contraindicated. K/C/O Coronary artery disease
Patient who did not undergo a subsequent catheter
angiogram
MATERIAL & METHODS:
A total of 20 consecutive patients (from the year 2013-2014) with chest pain, referred for CTCA and subsequently assessed by catheter angiogram were included.
The study was conducted in the department of radiology at PSG Hospital
Scanning equipment
CECT was performed in multi detector Siemens SOMATOM Definition edge 128 slice scanner.
Pre procedure requirements
1. NPO for 6 hours.
2. 18 gauge intravenous catheter in right anticubital vein
3. Beta blocker (T.Metoprolol 25-100mg) to achieve heart rate of less than 70 beats per minute
Patient positioning
Patient in supine position with arms raised above head and heart centered within the gantry.
Contrast
Intravenous contrast—Non ionic iodinated contrast 370mg iodine /ml injected through pressure injector at a rate of 5.5 ml/sec, with a dosage of 1.0-1.5 ml / kg followed by saline chase of 40ml (5.5ml/sec)
Scanning technique
Retrospective ECG gating is used for image reconstruction
Following series were obtained-
Scanogram
Plain CT
Post contrast study
Scanogram
Plain CT
From the scanogram field of view is chosen.
Plain scan is done in suspended inspiration.
Post contrast
From plain images FOV is chosen accordingly from just distal to coronary ostium till the cardiac apex to give adequate margin for movement during respiration. Image acquisition starts using bolus tracking technique with 6 sec delay before monitoring starts and ROI in descending aorta with a threshold of 100 HU for automatic triggering.
Image reconstruction
Image analysis
PLAIN
AGASTON scoring system was followed to quantify the amount of atherosclerotic coronary calcification.
Post contrast images
Post contrast axial, MPR, curved MPR, MIP and VRT images were used to analyze the vessel lumen, presence of any plaque and detection and quantification of stenosis if any.
Catheter angiogram was done after 1-2 weeks of CTCA. Catheter angiogram was performed by well trained and experienced cardiologist.
Considering catheter angiogram as gold standard the sensitivity, specificity, positive and negative predictive values of CTCA was evaluated.
STUDY DESIGN
Patient undergoes coronary CT
Findings documented
Patient undergoes conventional angiography
Findings documented
REVIEW OF LITERATURE
ANATOMY
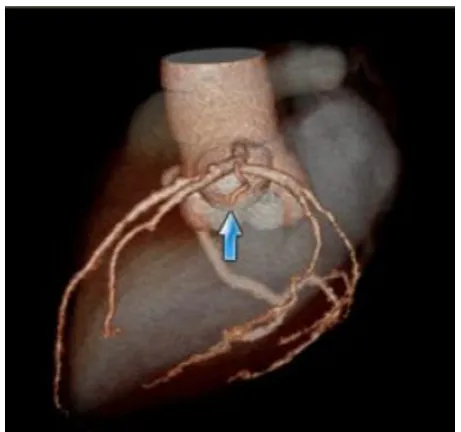
CORONARY ARTERY
Coronary artery is a vasa vasorum that supplies the heart.
The coronary artery arises just superior to the aortic valve and supply the heart
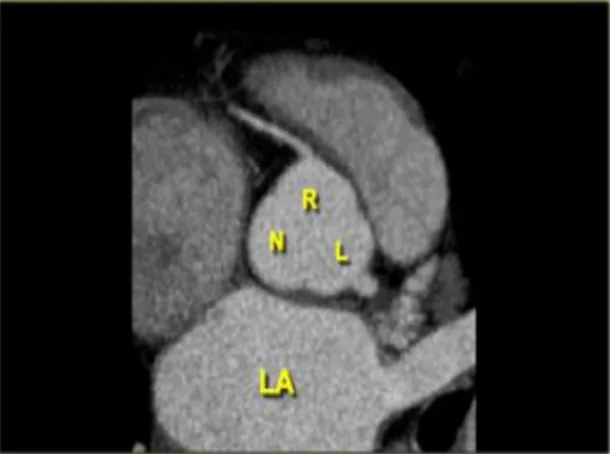
The aortic valve has three cusps –
1. Left coronary cusp
2. Right coronary cusp
3. non-coronary cusp
[image:25.595.157.464.499.726.2]Right coronary artery
Arises from right coronary cusp.
Courses to the inferior part of septum through the right atrio-ventricular groove
Branches
• Conus branch – 1st branch supplies the RVOT
• Sinus node artery – 2nd branch - SA node
• Acute marginal arteries-Arise at acute angle and runs along
the margin of the right ventricle above the diaphragm.
• Posterolateral ventricular branch
• Posterior descending artery :
Area of distribution:
1) Right atrium
2) Ventricles
i) Greater part of right Ventricle except the area adjoining the anterior IV groove.
3) Posterior part of the IV septum
4) Whole of the conducting system of the heart, except part of the left br of AV bundle
Left coronary artery
Arises from left coronary cusps
Travels between RVOT anteriorly and left atrium posteriorly.
Almost immediately bifurcate into LAD and LCx
Length – 10-15mm
Left anterior descending artery (LAD):
The LAD courses till the apex through the inter ventricular groove anteriorly.
Branches
1. Diagonal branches D1 and D2
2. Septal branch
Area of distribution
1. Septum in its anterior part through the septal branches
2. Left ventricle in its anterior part through the diagonal branches. 3. AV-bundle.
Left circumflex artery (LCx)
LCx lies in between the left atrium and ventricle in the atrio-ventricular groove
Branches
1. Obtuse marginal branches (OM1 and OM2)
2. Ventricular branches
3. Atrial rami
Area of distribution
FIG 2 coronary vessels and its branches Ramus intermedius
In few cases there is one more vessel arising in between LAD and LCx know as the ramus intermedius which acts as a diagonal branch of the LCx.
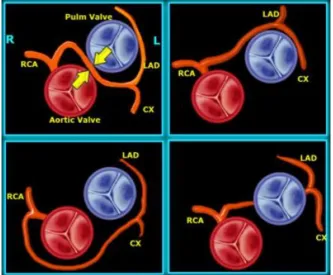
[image:29.595.194.425.497.713.2]Common vessel anomalies
1. Left anterior descending and Left circumflex originating from separate ostia
2. Left anterior descending origin from right sinus instead of left. 3. Right coronary artery origin from the sinus or from aortic wall 4. Right coronary artery origin from left sinus
[image:30.595.145.479.322.597.2]5. Left main coronary artery origin from right sinus
Dominance
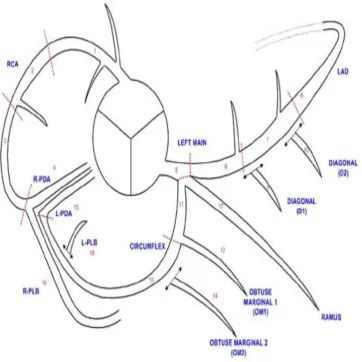
Fig 5. Segmentation of coronary vessels
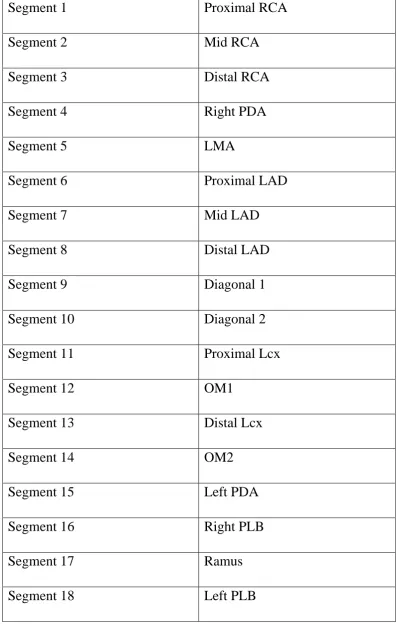
[image:32.595.149.512.132.495.2]Table 1Segmentation of coronary vessels
Segment 1 Proximal RCA
Segment 2 Mid RCA
Segment 3 Distal RCA
Segment 4 Right PDA
Segment 5 LMA
Segment 6 Proximal LAD
Segment 7 Mid LAD
Segment 8 Distal LAD
Segment 9 Diagonal 1
Segment 10 Diagonal 2
Segment 11 Proximal Lcx
Segment 12 OM1
Segment 13 Distal Lcx
Segment 14 OM2
Segment 15 Left PDA
Segment 16 Right PLB
Segment 17 Ramus
According to Society of cardiovascular computed tomography guidelines 2009[7] for the interpretation and reporting of CT coronary angiography the recommended quantitative and qualitative grading are as follows
Recommended Quantitative Stenosis Grading
0 Normal: Absence of plaque and no luminal stenosis
1 Minimal: Plaque with less than 25% stenosis
2 Mild: 25%–49% stenosis
3 Moderate: 50%–69% stenosis
4 Severe: 70%–99% stenosis
Recommended Qualitative Stenosis Grading
0 Normal: Absence of
1 Minimal: Plaque with negligible impact on lumen
2 Mild: Plaque with no flow-limiting stenosis
3 Moderate: Plaque with possible flow-limiting disease
4 Severe: Plaque with probable flow-limiting disease
Alexander W. Leber et al [1] studied the likelihood of CAD in
intermediate risk group using CT coronary angiography. The study
assessed the coronary status in intermediate risk group using dual
X-ray source MDCT coronary angiography .In this study 90 patients were
included out of which diagnostic quality was obtained only in 88
patients. CT angiography was compared with catheter angiography.
Catheter angiography showed 18 stenosis which were more than 75 %
and twenty four stenosis which were 50-75%. These results were
compared with CT angiography. Out of 18 stenosis which were more
than 75% 17 were correctly identified and one was underestimated.
Out of twenty-four stenosis ranging from 50 to 75%, 17 were correctly
graded. Five were overestimated, and three was underestimated. The
study showed good correlation between dual source CT and catheter
angiography with a slight tendency to overestimate the degree of
stenosis. The study showed MDCT can accurately rule out coronary
stenosis in intermediate risk group independent of heart rate.
Gilbert L. Raff et al [4] studied the diagnostic accuracy of CT
coronary angiography using 64 slice CT scanner. Study included a total
of 70 patients who underwent both CT and coronary angiography.
Patients with atrial fibrillation, high calcium score and obese patients
were excluded front the study. All vessels including those with 1.5mm
diameter were analyzed for any lesions..These lesions were compared
quantitatively and qualitatively with catheter angiography for each
vessel and each segment. Sensitivity, specificity, PPV and NPV for
significant stenosis were calculated. Negative predictive value for
significant stenosis was 97% . Positive predictive value was 66%.
Sensitivity and specificity was 86% and 96% respectively. Sensitivity,
specificity, PPV and NPV for artery was calculated which was 91%,
92%, 80%, and 97%, respectively and for patients 95%, 90%, 93%,
and 93%, respectively. The effect of calcium score on CT accuracy
was analyzed. Results demonstrated that high accuracy was there when
calcium score was low and moderate but when AGASTON score was
more than 401 there was reduced specificity and negative predictive
value. Influence of obesity on accuracy of CT coronary angiography
was studied which showed that obesity has significant influent on the
accuracy. Also influence of heart rate on multi-detector CT coronary
beats/min there was better accuracy but heart rate of more than 70bpm
showed declining sensitivity specificity positive predictive value and
negative predictive value (sensitivity declining to 88%, specificity to
71%, PPV to 78%, and NPV to 83%).
Sebastian Leschka et al [5]studied the accuracy of 64 slice
multi-detector computed tomography coronary angiography in
comparison with catheter angiography. Sixty seven patients with
suspected CAD were included in this study and the results were
compared with catheter angiography. All vessels were included for the
assessing significant stenosis Image quality was graded as excellent,
good and adequate and were sixty-one percent, thirty one percent and
eight percent respectively and best results were obtained in the
proximal coronary arteries. None of the vessel segment was excluded
from analysis. Thirty six percent of the forty nine percent calcified
vessels had massive calcification causing beam hardening artifacts and
impairing the image quality. The overall sensitivity, specificity, PPV
and NPV were calculated which were 94%,97%.87% and 99%
respectively. Three stenosis were missed due to motion artifact.
Patients without coronary artery disease were correctly identified by
CT. The study concluded that CT coronary angiography provided high
In this study a total of 20 patients were included. Catheter angiogram detected 41 stenoses. Out of which 36 were detected by CT coronary angiogram and 5 lesions were missed. Three stenosis which were not detected by conventional angiogram were detected by CT.
Table 2: Age wise distribution of study group
.
Fig 6: Age wise distribution of study group
In our study group the mean age was 52.8 with a standard deviation of 7.516.
6, 30%
12, 60%
2, 10%
40-50 50-60 60-70 Age
Group Frequency Percentage
40-50 6 30
50-60 12 60
60-70 2 10
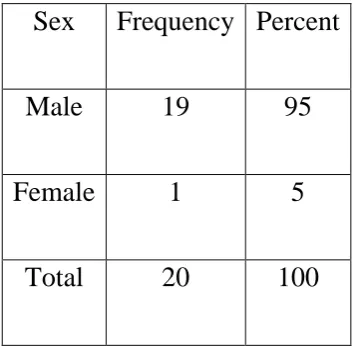
Table 3: Sex wise distribution:
Sex Frequency Percent
Male 19 95
Female 1 5
Total 20 100
[image:43.595.131.494.372.601.2]
Fig 7. Sex wise distribution
In our study group of 20 patients 19 were male and one was female. 0
2 4 6 8 10 12 14 16 18 20
Male Female
19
Table 4:Calcium scoring
Score Frequency Percentage
0-10 9 45
11 - 100 5 25
100-400 6 30
Total 20 100
Fig 8. Calcification
In our study population the mean calcium scoring was 85.825 with a standard deviation of 135.5271
9, 45%
5, 25%
6, 30% 0-10
Fig 9:CT Vs Cath in detecting minimal stenosis (<20%)
A total of 7 minimal stenosis was detected by catheter angiogram. In this study 4 was detected by CT, 3 were not detected.
0 1 2 3 4 5 6 7
Total detected by CT not detected by CT 7
4
Fig 10: Grading correlation between CT & CATH ANGIO for minimal stenosis
CT grading for the four cases of minimal stenosis diagnosed in CATH ANGIO
A total of 7 minimal stenosis was detected by catheter angiogram. In this study 4 was detected by CT and 3 were not detected. In four minimal stenosis detected in CT only one was graded as minimal stenosis.
1 case[25%
1 case[25% 1 case[25%]
1,case [ 25%]
Fig 11.CT Vs Cath in detecting mild stenosis
A total of 5 mild stenosis was detected by catheter angiogram. CT coronary angiogram detected all the five mild stenosis accurately.
0 0.5 1 1.5 2 2.5 3 3.5 4 4.5 5
Total detected by CT not detected by CT
5 5
Fig12: Grading correlation between CT & CATH ANGIO for mild stenosis
CT grading for the five cases of mild stenosis diagnosed in CATH ANGIO
In this study five mild stenosis were detected in CT and only two were correctly graded as mild stenosis
1, case [20%]
2 case [40%]
2, case[40%] Minimal
Fig 13.CT Vs Cath in detecting moderate stenosis:
Totally there were 5 moderate stenosis detected in catheter angiogram. Out of this 5 stenosis 4 were accurately detected by CT angiogram and 1 was not detected.
0 0.5 1 1.5 2 2.5 3 3.5 4 4.5 5
Total detected by CT not detected by CT 5
4
Fig. 14 Grading correlation between CT & CATH ANGIO for moderate stenosis
CT grading for the four cases of moderate stenosis diagnosed in CATH ANGIO
Out of four moderate stenosis detected in CT, two were correctly graded as moderate stenosis.
0, 0%
2 case[50%] 2 case [50%]
0, 0%
Fig 15 CT Vs Cath in detecting severe stenosis
A total of 20 severe stenosis were detected in catheter angiogram. Nineteen cases were accurately detected in CT. One stenosis was not detected in CT due to poor filling of distal LAD.
0 2 4 6 8 10 12 14 16 18 20
Total detected by CT not detected by CT 20
19
Fig 16 Grading correlation between CT & CATH ANGIO for severe stenosis
CT grading for the nineteen cases of severe stenosis diagnosed in CATH ANGIO
Out of 19 severe stenosis detected in CT, 13 were correctly graded as severe stenosis which corresponds to 68 %
2, case[11%]
3, case[16%]
13 case[68%] 1 case [5%]
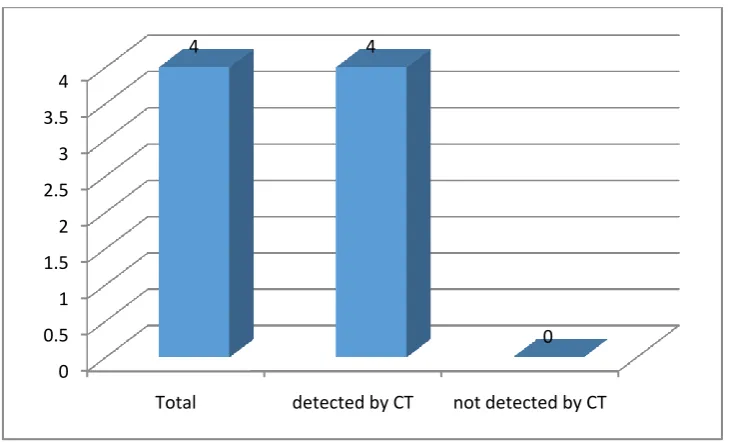
Fig 17 CT Vs Cath in detecting occlusion
Totally four occluded stenosis were detected both in catheter angiogram and CT coronary angiogram.
0 0.5 1 1.5 2 2.5 3 3.5 4
Total detected by CT not detected by CT
4 4
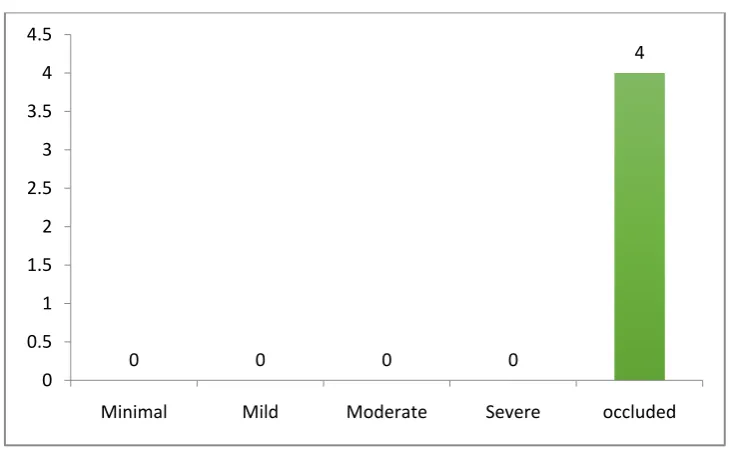
Fig 18 Grading correlation between CT & CATH ANGIO for occlusion
CT GRADING for the four cases of occlusion diagnosed in CATH ANGIO
All the four were correctly graded as total occlusion.
0 0 0 0
4
0 0.5 1 1.5 2 2.5 3 3.5 4 4.5
Fig 19 Vessel wise distribution of the stenosis
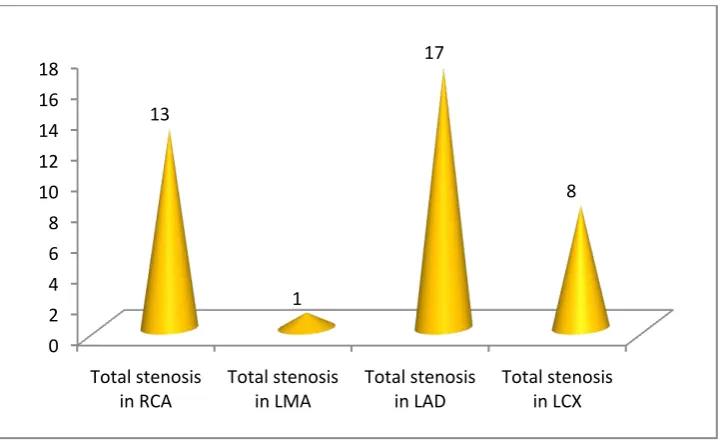
On comparing the stenosis vessel wise, maximal involvement was seen in LAD followed by RCA. The least involved vessel was left main coronary.
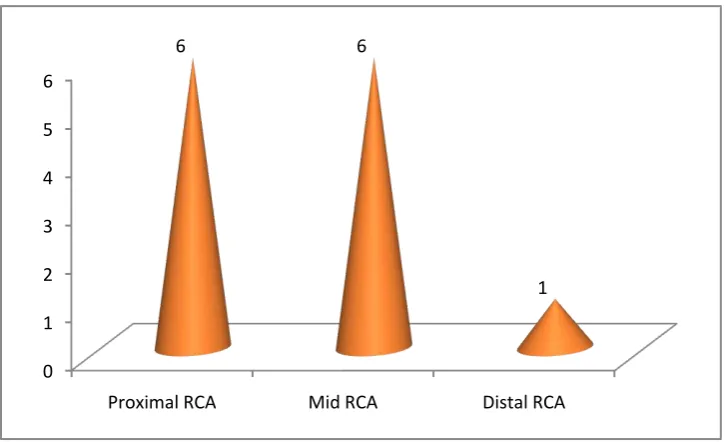
Fig 20Segment wise distribution of stenosis in RCA
On comparing the segment wise involvement in right coronary artery distal RCA was least affected.
0 1 2 3 4 5 6
Proximal RCA Mid RCA Distal RCA
6 6
Fig 21Segment wise distribution of stenosis in LAD
On comparing the segment wise involvement in left coronary artery distal LAD was least affected. The distribution was same in proximal and mid LAD.
0 1 2 3 4 5 6 7
Proximal LAD Mid LAD Distal LAD
7 7
Fig 22 Segment wise distribution of stenosis in LCx
On comparing the segment wise involvement in left circumflex, proximal LCx was involved in 5 out of 8 cases.
0 0.5 1 1.5 2 2.5 3 3.5 4 4.5 5
Proximal LCX Mid LCX Distal LCX 5
3
Fig 23 Dominance
Out of 20 cases included in the study 18 cases which is 90 percent had right circulation. One case was left dominant and the other one was co dominant.
18, 90% 1, 5% 1, 5%
Fig 24 Presence of ramus intermedius
Ramus intermedius was present in 9 out of twenty cases. 0
2 4 6 8 10 12
Fig 25 Number of vessels with anomalous origin
In one patient the left main coronary artery was seen arising from right coronary cusp
0 2 4 6 8 10 12 14 16 18 20
abnormal orgin of vessel normal orgin of vessel 1
Table 5 Segmental luminal diameter of RCA
RCA(mm) Proximal MID DISTAL
1.0-2.0 6 8 14
2.0-3.0 12 10 5
3.0-4.0 2 2 1
Fig 26 Segmental luminal diameter of RCA
0 2 4 6 8 10 12 14
Proximal MID DISTAL
RCA
1.0-2.0Table 6 Segmental luminal diameter of LAD
LAD(mm) Proximal MID DISTAL
1.0-2.0 4 14 18
2.0-3.0 7 6 2
3.0-4.0 2
Fig 27 Segmental luminal diameter of LAD
0 5 10 15 20
Proximal MID DISTAL
4
14
18
7
6
2
LAD
1.0-2.0Table 7 Segmental luminal diameter of LCx
LCX(mm) Proximal MID DISTAL
1.0-2.0 10 14 17
2.0-3.0 8 5 3
3.0-4.0 2 1
Fig 28 Segmental luminal diameter of LCx
0 2 4 6 8 10 12 14 16 18
Proximal MID DISTAL
Fig 29 Segmental luminal diameter of LMA
1, 5%
7, 35%
7, 35% 5, 25%
LMA
Table 8 Comparison of CT with cath angio in detecting all stenosis
CATH Detected
Stenotic Segments
Normal Segments
Total
CT positive 36 3 39
CT negative 5 139 144
Total 41 142 183
Sensitivity 87.80%
Specificity 97.90%
PPV 92.30%
NPV 96.50%
Table 9 Comparison of CT with cath angio in detecting clinically significant stenosis
CATH Detected
Stenotic Segments
Normal Segments
Total
CT positive 27 3 30
CT negative 2 151 153
Total 29 154 183
Sensitivity 93.00%
Specificity 98.00%
PPV 90.00%
NPV 98.70%
Correlation between CT Angiogram Grading with CATH angiogram grading
Minimal stenosis: 25%
Mild stenosis: 40%
Moderate stenosis: 40%
Severe stenosis: 68%
Our study was conducted in 20 patients. All these twenty patients underwent both CT coronary angiogram and catheter angiogram. Results of CT coronary angiogram were compared with catheter angiogram. First calcium scoring was done for each case. Patients with calcium score of more than 600 were excluded from the study. All the vessels were analyzed on segment to segment basis for any stenosis and if there was any stenosis they were graded accordingly.
Our study included patients from 40 to 70 years of age. The mean age in this group was 52.8. In a total of 20 patients, 12 patients were 50-60 years. Only 10 percentages of the patients were in 60-70 years of age group. Out of the 20 patients 19 were male and one was female.
Calcium scoring was done for each patient. AGASTON scoring was used as standard. Nine patients had calcium scoring of less than 10. Six patients had calcium scoring of more than 100. The mean calcium score in our study was 85.
one was severe stenosis. The severe case which was undetected in CT was noted in the distal LAD segment which showed no filling of contrast. The overall sensitivity, specificity, positive predictive value and negative predictive value were 87.8, 97.9, 92.3 and 96.5 respectively [p value <0.05, significant]
Lesions which were more than 50% were considered as clinically significant A total of 29 clinically significant lesions were detected in catheter angiogram. Out of these 29 cases 27 cases were detected in CT angiogram. One case which was missed was due to non visualized distal LAD and the other case was due to myocardial bridging. The overall sensitivity, specificity, positive predictive value and negative predictive value were 93%, 98%, 90% and 98.7% for the clinically significant stenosis[p value <0.05, significant]
. Out of 4 totally occluded lesions detected in Catheter angiogram all the 4 were accurately detected in CT coronary angiogram. Sensitivity, specificity, positive and negative predictive value were all 100%
The Percentage of CT grading correlating with catheter angiogram in this study is 1) minimal grading - 25%, 2) mild grading - 40%, 3) moderate grading - 40%, 5) severe grading - 68% and 6) occluded vessel - 100%
Luminal diameter of each segment was documented. The mean diameter of proximal, mid and distal RCA was 2.5, 2.3 and 2.0 mm respectively.
According to the study done by Nico R. Mollet et al [2]which studied the role of CT coronary angiography in 52 patients presenting with atypical chest pain, stable or unstable angina pectoris, or non–ST-segment elevation myocardial infarction with 64 slice MDCT significant coronary stenosis were detected with 99%sensitivity and 95% specificity 76% positive predictive value and 99% negative predictive value in comparison with catheter angiography. In our study
the sensitivity, specificity, PPV and NPV for significant stenosis were 93%, 98%. 90% and 98% respectively.
was underestimated. In our study percentage of CT grading correlating
with catheter angiogram moderate grading was 40% (two out of 4 lesions). Two lesion was underestimated which is comparable with the study.
According to the study done by Stephan Achenbach et al [3]left main coronary artery was free of visible motion artifact in all cases
which is in concordant with our study. In our study also there no
motion artifact was encountered in left main coronary.
This was a prospective study in 20 patients who presented with typical/ atypical chest pain and in whom both CT and Catheter angiogram was done.
CT findings were compared with catheter angiogram findings
The study group included 19 male patients and one female patient with age group between 40 and 70 yrs.
Stenosis of more than 50% was considered as significant stenosis. Sensitivity, specificity, PPV and NPV for significant stenosis were 93%, 98%. 90% and 98% respectively in our study
CONCLUSION
1. CT can be used as a reliable method to quantify the calcium score.
2. CT coronary angiography is sensitive in detecting clinically
significant stenosis provided the quality of the image is adequate
3. CTCA is an excellent tool to detect anatomical variants of coronary arteries.
4. CTCA has sensitivity, specificity, PPV and NPV of 93%, 98%. 90% and 98% respectively for detecting clinically significant stenosis
5. The overall sensitivity, specificity, PPV and NPV for detecting all
the stenosis (including <50%) were 87.8%, 97.9%, 992.3% and
LIMITATIONS:
Small study population, owing to difficulty in collecting patients
who underwent both CT and catheter angiogram, as most of the patients are directly subjected to Catheter angiogram.
Motion artifacts impaired the image quality and there by diagnostic
accuracy of CT coronary angiography.
Poor breath holding can lead to artifacts and affects the image
quality and interpretation.
RECOMMENDATIONS:
We would propose that all cases of suspected coronary artery disease should undergo CT coronary angiogram so that catheter angiogram can be used only for therapeutic purpose.
CT coronary angiogram should be performed in cases of typical/atypical chest pain.
CT coronary angiogram should be performed in mild to intermediate risk groups of having coronary disease.
Bibliography
1. Diagnostic accuracy of dual-source multi-slice CTcoronary angiography in patients with an intermediate pretest likelihood for coronary artery disease Alexander W. Leber , Thorsten Johnson , Alexander Becker Franz von Ziegler, Janine Tittus, Konstantin Nikolaou, Maximilian Reiser, Gerhard Steinbeck, Christoph R. Becker, and Andreas Knez European Heart Journal (2007) 28, 2354–2360
2. High-Resolution Spiral Computed Tomography Coronary Angiography in Patients Referred for Diagnostic Conventional Coronary Angiography Nico R. Mollet, MD; Filippo Cademartiri, MD; Carlos A.G. van Mieghem, MD; Giuseppe Runza, MD; Eugène P. McFadden, MB, FRCP; Timo Baks, MD; Patrick W. Serruys, MD; Gabriel P. Krestin, MD; Pim J. de Feyter, MD Journal of the American College of Cardiology volume 50, issue 15 9 October 2007, Pages 1469–1475
Daniel, MD; Willi A. Kalender, PhD; Werner Moshage, MD Circulation 2000 Dec 5;102(23):2823-8.
4. Diagnostic Accuracy of Noninvasive Coronary Angiography Using 64-Slice Spiral Computed Tomography Gilbert L. Raff, MD, (FACC), Michael J. Gallagher, MD, William W. O’Neill, MD(FACC), James A. Goldstein, MD (FACC)Journal
of the American College of Cardiology Volume 46, Issue 3, 2 August 2005, Pages 552–557
5. Accuracy of MSCT coronary angiography with 64-slice technology: first experience Sebastian Leschka1 , Hatem Alkadhi1 , Andre´ Plass2 , Lotus Desbiolles1 , Ju¨rg Gru¨nenfelder2 , Borut Marincek1 , and Simon Wildermuth1* European Heart Journal (2005) 26, 1482–1487 doi:10.1093/eurheartj/ehi261
6. Quantitative angiography in South Asians reveals differences in vessel size and coronary artery disease severity compared to Caucasians Rani K. Hasan1, Am J Cardiovasc Dis 2011;1(1):31-37
Berman, MD, Lawrence M. Boxt, MD, Matthew J. Budoff, MD,Victor Cheng, MD, Tony DeFrance, MD, Jeffrey C. Hellinger, MD, Ronald P. Karlsberg, MD Journal of Cardiovascular Computed Tomography (2009) 3, 122–136
8. SCCT guidelines for performance of coronary computedtomographic angiography: A report of the Society of Cardiovascular Computed Tomography Guidelines Committee Suhny Abbara, MD, Armin Arbab-Zadeh, MD, Tracy Q. Callister, MD, Milind Y. Desai,MD, Wilfred Mamuya, MD, PhD, Louise Thomson, MBChB, FRACP Wm. Guy Weigold, MD
Society of Cardiovascular Computed Tomography 2009
9. Appropriate Use Criteria for Cardiac Computed Tomography Allen J. Taylor, MD, FACC, FAHA, Chaira, Manuel Cerqueira, MD, FACC, FASNCb, John McB. Hodgson, MD, FACC, FSCAIc, Daniel Mark, MD, MPH, FACC, FAHA et al. Journal of Cardiovascular Computed Tomography (2010) 4, 407.e1–407. 10. 2010 Expert Consensus Document on Coronary Computed
11. Noninvasive Coronary Angiography by Retrospectively ECG-Gated Multislice Spiral CT Stephan Achenbach, MD et al. Circulation 2000
12. Quantification of Coronary Arterial Stenoses by Multidetector CT Angiography in Comparison With Conventional Angiography Methods, Caveats, and Implications Armin Arbab-Zadeh, et al. CARDIOVASCULAR IMAGING
ANNEXURE:
LIST OF TABLES:
Table 1 Segmentation of coronary vessels
Table 2: Age wise distribution of study group
Table 3: Sex wise distribution
Table 4: Calcium scoring
Table 5 Segmental luminal diameter of RCA
Table 6 Segmental luminal diameter of LAD
Table 7 Segmental luminal diameter of LCx
Table 8 Comparison of CT with cath angio in detecting stenosis
LIST OF FIGURES
FIG 1 Origin of vessels
FIG 2 Coronary vessels and its branches
FIG 3 Ramus intermedius vessel
FIG 4 Anatomical variation in origin
Fig 5 Segmentation of coronary vessels
Fig 6 Age wise distribution of study group
Fig 7 Sex wise distribution
Fig 8 Calcification
Fig 9 CT Vs Cath in detecting minimal stenosis (<20%)
Fig10 Grading correlation between CT & CATH ANGIO for minimal stenosis
Fig 11 CT Vs Cath in detecting mild stenosis
Fig12 Grading correlation between CT & CATH ANGIO for mild stenosis
Fig.14 Grading correlation between CT & CATH ANGIO for moderate stenosis
Fig 15 CT Vs Cath in detecting severe stenosis
Fig 16 Grading correlation between CT & CATH ANGIO for severe stenosis
Fig 17 CT Vs Cath in detecting occlusion
Fig 18 Grading correlation between CT & CATH ANGIO for occlusion
Fig 19 Vessel wise distribution of the stenosis
Fig 20 Segment wise distribution of stenosis in RCA
Fig 21 Segment wise distribution of stenosis in LAD
Fig 22 Segment wise distribution of stenosis in LCx
Fig 23 Dominance
Fig 24 Presence of ramus intermedius
Fig 25 Number of vessels with anomalous origin
Fig 26 Segmental luminal diameter of RCA
Fig 28 Segmental luminal diameter of LCx
Fig 29 Segmental luminal diameter of LMA
FIG.30 Reconstructed MIP image showing normal RCA
Fig.31 Reconstructed MIP image showing normal LAD
Fig.32 Reconstructed MIP image showing normal LCx
Fig.33 Catheter angiogram image of normal RCA
Fig.34 Catheter angiogram image of normal LAD and LCx
Fig.35 Catheter angiogram and CT image of RCA showing severe stenosis in the distal segment
Fig.36 Catheter angiogram and CT image of LCx showing stenosis in proximal segment
S.no
RCA Dia (mm)
LMA Dia (mm)
LAD Dia(mm) LCX Dia(mm)
Proxima
l Mid Distal Proximal Mid Distal Proximal Mid Distal
1 4 3.5 2 5 3 2.3 1.7 3 2.4 1.6
2 1.8 3 2 3 3 1.9 1.6 1.9 1.7 1.2
3 2.2 2.2 2 5 2.5 2.2 1.7 2 1.4 1.4
4 2.2 1.9 1.8 2.4 2.1 1.5 1.5 1.4 1 0.9
5 2 2.5 2.5 2.5 2.2 2 1.6 1.9 1.6 1.6
6 2.2 2 1.6 4 1.8 1.6 1.4 2.2 1.8 1.6
7 3 2.7 2.7 4 2.1 1.5 1.4 2.4 1.5 1
8 3 2 1.5 3 2.5 1.7 1.6 2 1.5 1.3
9 2 2 2 16 2 1.6 1.3 2.2 1.8 1.4
10 3 2.4 2.3 5 3.7 2.5 2.2 2.7 1.5 1.6
11 3.7 3.7 3.5 3.5 4 2.7 2.2 3.2 2.2 1.5
12 3 3 3 3.5 3 1.5 1.5 1.8 1.7 1.5
13 3 2.2 1.5 1.2 2 1.4 1.5 2.5 2.5 2.4
14 2.5 2.1 1.8 2.5 2.2 1.7 1.5 2 2 1.6
15 2.5 1.5 1.5 3.5 2.4 2.4 1.5 2.7 2.2 2.1
16 2 1.8 1.6 2.5 2.5 1.9 1.7 2.2 2.2 1.6
17 2.5 2.5 2 5 3 2.5 2 3.4 3.1 2.1
18 2 1.7 1.2 3.5 2 1.8 1.4 2 1.5 1.3
19 1.8 2 2 2.8 2.6 2 1.6 1.5 1.3 1
20 2.5 2.2 2.2 3.4 2.3 1.8 1.7 1.9 1.8 1.5
S.no
RCA LMA LAD LCx
Detection of stenosis Grading of Stenosis Detection of stenosis Grading of
Stenosis Detection of stenosis Grading of Stenosis Detection of stenosis
Grading of Stenosis
CT CATH CATH CT CA
TH CT CATH CT CATH CT CATH CT CATH CT
CAT H
1 N N N N N N N N N N N N N N N N
2 1. Proxima l RCA+ 2. Mid RCA + 3. Distal RCA + 1. + 2. + 3. + 1. Severe 2. Minim al 3. Severe 1. Minim al 2. Mild 3. Severe
N N N N
1. Mid LAD + 2. mid LAD - 1.+ 2. + 1. Mild 2. - 1.Mod erate 2.Mod erate 1. Proximal + 1. + 1.Mi ld 1. Seve re
3 N N N N N N N N N N N N N N N N
4
1.Mid
RCA + 1. + 1.Mild 1.Mild N N N N
1.Proxima l LAD +
1. + 1. Severe 1.Seve
re 1.Normal 1.Normal
1.N orm al 1.No rmal 5 1.prox.
RCA + 1. + 1.Mild 1.Mild
1.M id LM CA + 1. Mi d L M CA + 1.-Minim al 1. Minima l 1.Proxima
l LAD + 1. + 1.Severe
1.Seve re
1.prox
LCx + 1. +
1. Seve re 1. Seve re 6 1.Proxi mal RCA + 2. Mid RCA - 1. + 2. + 1. Modera te 2. - 1. Severe 2. Minim al
N N N N
7 1. Mid RCA + 1.Mid RCA + 1. Modera te 1.
Severe N N N N
1. Mid LAD +
1. Mid
LAD + 1. Moderate
1. Severe
1.Proxima l LCx -
1. Proximal
LCX + 1. -
1. Mini mal 8 1. Proxima l + 1. Proxim al + 1. Occlud ed 1.Occl
uded N N N N
1. Proximal + Mid + 1. Proxim al + Mid + 1.Moderate 2.Mild 1.Mild 2.Mini mal
N N N N
9
N N N N N N N N
1. Proximal + 1. Proxim al +
1. Severe 1.
Severe N N N N
10
N N N N N N N N N N N N N N N N
11
N N N N N N N N 1. Mid +
Distal + 1. Mid + Distal + 1.Severe 2.Moderate 1.Seve re 2.Mod erate
N N N N
12
N N N N N N N N 1. Mid + 1. Mid
+ 1. Mild
1. Moder ate
N N N N
13
1. Mid + 1. Mid
+ 1. Modera te 1. Moder ate
N N N N 1. Distal
LAD - 1. + 1. -
1. Severe 1. Proximal + 1.Proximal + 1. Mild 1. Seve re
15
N N N N N N N N
1. Proximal LAD-
1. + 1. -
1. Minim al
N N N N
16
N N N N N N N N 1. Mid
LAD + 1. - 1.Mild 1. -
1. proximal Lcx +
N N N
17 N N N N N N N N
1. Distal
LAD + + Severe Severe N N N N
18
1. Mid
RCA + +
1. Severe
1.
Severe N N N N
1.Proxima l LAD + 2.Distal LAD + 1.+ 2. + 1. Severe 2. Severe 1. Severe 2. Severe 1.Proxima
l LCX + 1. -
1.
Mild 1. -
19 1.Proxi mal + 2.Mid + 1. - 2. + 1. Mild 2. Occlud ed 1. - 2. Occlud ed
N N N N N N N N N N N N
20 1. Proxima l + 1. + 1. Occlud ed 1. Occlud ed
N N N N
1. Proximal + 2. Mid +
1. + 2. + 1. Severe 2. Occluded 1. Severe 2. Severe 1. Mid
LCx + 1. +