DEVELOPMENT AND OPTIMIZATION OF OSMOTICALLY
CONTROLLED ORAL DRUG DELIVERY SYSTEMS FOR
HIGHLY AND POORLY WATER SOLUBLE DRUGS
Thesis submitted to
The Tamil Nadu Dr. M.G.R. Medical University, Chennai
for the award of the degree of
DOCTOR OF PHILOSOPHY
In
PHARMACY
By
Mrs. SONA.P.S
M.Pharm.,Under the Guidance and Supervision of
Dr.G .GEETHA,
M.Pharm., Ph.D.,Professor and Head
Department of Pharmaceutical Analysis P.S.G College of Pharmacy, Coimbatore, Tamil Nadu -641004
Dr.G.Geetha, M.Pharm ., Ph.D., Professor and Head,
Department of Pharmaceutical Analysis, PSG College of Pharmacy
Coimbatore, Tamil Nadu, India - 641004
CERTIFICATE
This is to certify that the Ph.D. thesis entitled “DEVELOPMENT AND
OPTIMIZATION OF OSMOTICALLY CONTROLLED ORAL DRUG
DELIVERY SYSTEMS FOR HIGHLY AND POORLY WATER SOLUBLE
DRUGS” being submitted to the Tamil Nadu Dr. M.G.R. Medical University, Chennai,
for the award of degree of DOCTOR OF PHILOSOPHY in PHARMACYwas carried
out by Mrs. SONA P.S, at RVS COLLEGE OF PHARMACEUTICAL SCIENCES,
Sulur, Coimbatore, under my direct supervision and guidance to my fullest satisfaction. The contents of this thesis, in full or in parts, have not been submitted to any other
Institute or University for the award of any degree or diploma.
Dr.G.Geetha, M.Pharm
.,Ph.D
.,(Supervisor & Guide)
Place: Coimbatore
Dr. R. Venkatanarayanan, M.Pharm., Ph.D.,
Principal
RVS College of Pharmaceutical Sciences 24-B, Trichy Road, Sulur
Coimbatore, Tamil Nadu, India - 641402
CERTIFICATE
This is to certify that the Ph.D. thesis entitled “DEVELOPMENT AND
OPTIMIZATION OF OSMOTICALLY CONTROLLED ORAL DRUG
DELIVERY SYSTEMS FOR HIGHLY AND POORLY WATER
SOLUBLE DRUGS” being submitted to the Tamil Nadu Dr. M.G.R. Medical University, Chennai, for the award of degree of DOCTOR OF PHILOSOPHY
in PHARMACY was carried out by Mrs. SONA P.S, at RVS COLLEGE OF PHARMACEUTICAL SCIENCES, Sulur, Coimbatore, under the direct supervision and guidance of DR.G.GEETHA, M.Pharm., Ph.D., Professor & Head, Department of Pharmaceutical Analysis, PSG College of Pharmacy, Coimbatore.
Dr. R. Venkatanarayanan
,
M.Pharm., Ph.D.,
Principal
Place: Coimbatore - 44.
DECLARATION
I hereby certify that I am the sole author of this thesis entitled
“DEVELOPMENT AND OPTIMIZATION OF OSMOTICALLY
CONTROLLED ORAL DRUG DELIVERY SYSTEMS FOR HIGHLY AND POORLY WATER SOLUBLE DRUGS” and that neither any part of this thesis nor the whole of the thesis has been submitted for a degree to any other University or Institution. I certify that, to the best of my knowledge, my thesis does not infringe upon anyone’s copyright nor violate any proprietary rights and that any ideas, techniques, quotations, or any other material from the work of other people included in my thesis, published or, are fully acknowledged in accordance with the standard referencing practices. I declare that this is a true copy of my thesis, including any final revisions, as approved by my thesis review committee.
Mrs. Sona.P.S
Place: Coimbatore
ACKNOWLEDGEMENT
This thesis is fruit of infinite encouragement, guidance and cooperation received from multidirectional aiming for a unidirectional goal. Today, at the acme of my dissertation, with heartiness, I gratefully remember my parents, teachers, friends, relatives and well wishers; as one flower makes no garland. This presentation would not have taken shape without their whole hearted encouragement and live involvement.
On this occasion of successful completion of my work, I offer my salutation to the Almighty, with whose showering of blessing, this task was, ventured without any hindrance.
With a feeling of profound pleasure I can say that the credit of this work goes to a giant personality, who has brought about “better me” in myself, Mrs. G. Geetha, M.Pharm., Ph.D., Department Pharmaceutical Analysis, PSG College of Pharmacy, Coimbatore my guide whose scholarly insight, valuable guidance and affection has molded and enlightened my tiny work into success that in turn is presented here. I would like to heartily thank her for her untiring cooperativeness, critical remarks, valuable suggestions and the nourishment of knowledge confined upon me. This thesis could not have been written without my guide who not only served as my supervisor but also encouraged and challenged me throughout my project work without accepting less than my best efforts.
On this occasion of successful completion of my research work and thesis writing I would like to express my deep sense of gratitude and respect to Dr. R. Venkata Narayanan, M.Pharm., Ph.D., Professor and Principal, RVS College of Pharmaceutical Sciences, Coimbatore who has the attitude and the substance of a genius; he continually and convincingly conveyed a spirit of adventure and an excitement in regard to research.
I am truthfully thankful to Alembic Research Center, Baroda for providing gift sample of drugs.
I am thankful to the Teaching and Non Teaching Staff of Department of Pharmaceutics, Pharmaceutical Analysis and Pharmacology, RVS College of Pharmaceutical Sciences, Coimbatore for their understanding and assistance to carry out my experimental work successfully.
I express my heartfelt thanks to my Husband, C. Muthulingam who has provided me the moral and technical support for completing the project in timely manner.
I am indebted to a special person, my daughter Ameya.M for her presence, love and cooperation which enabled me to complete this research work on time.
I express my heartfelt thanks to my colleague and friends Falguni Tandel, Suresh Pandian, Sundara Moorthy, Vikram for their creative ideas, encouragement and support that catalyzed my work.
I would like to thank Roopal Vijay Chuhan, Sudha Suresh Pandian, Vasumathi Sundaramoorthy, for their help and co-operation during my project work. I can’t forget the sweet memories of time that I have spent with them.
I would like to express my thanks to Mini Nair and Niranjan, Saraswathi Computer Centre, and Vasanthi Printers, Coimbatore for their support and cooperation.
I am at loss of word while thanking my Beloved Parents for their support, sacrifice and for the pain they have taken in bringing me up to this position.
I express my gratitude and apologize to anybody whose contributions, I could not mention in this page.
i
INDEX
Chapter
No Contents Page No
1 INTRODUCTION 1-6
1.1 Oral controlled drug delivery system 1
1.2 Advantages of osmotic drug delivery system 2
1.3 Drug candidate selection for OCODDS 2
1.4 Push pull osmotic tablets 3
1.5 Design of experiments 4
2 AIMS AND OBJECTIVES 7-9
2.1 Aims of the study 7
2.2 Objectives of the study 9
3 LITERATURE REVIEW 10-20
4 SCOPE AND PLAN OF THE WORK 21-22
4.1 Scope of the work 21
4.2 Plan of the work 22
5 MATERIALS AND METHODS 23-58
5.1 List of materials 23
5.2 List of instruments 24
5.3 Drug profile 25-28
5.3.1 Ropinirole HCl 25
5.3.2 Ivabradine HCl 26
5.3.3 Carvedilol phosphate 27
5.3.4 Nisoldipine 28
5.4 Analytical method development 29
5.4.1 UV method development for the evaluation of formulations
29
5.5 Pre formulation study 30-34
5.5.1 Organoleptic characteristics 30
ii
Chapter
No Contents Page No
5.5.3 Particle size and distribution 31
5.5.4 Density 32
5.5.5 Carr’s index 32
5.5.6 Hausner’s ratio 33
5.5.7 Angle of repose 33
5.5.8 Drug excipients interaction study 34
5.6 Product development and optimization of push
pull osmotic tablets of the selected drugs
35-50
5.6.1 Dose calculation 35
5.6.2 Screening of the factors affecting release profile of the drug from push pull OTs
35
5.6.3 Soft ware used 36
5.6.4 Product development, Factor influence study
and optimization of push –pull osmotic tablets
36
5.6.5 Stability study 50
5.7 Invivo animal studies of the optimized
formulations
51-55
6 RESULT AND ANALYSIS 59-188
6.1 UV Method development for the analysis of the
selected drugs
59
6.1.1 Determination of λmax of the selected drugs 59
6.1.2 Calibration curves of the selected drugs 59
6.2 Pre formulation studies 61-63
6.3 Product development and optimization of push
pull osmotic tablets of the selected drugs
64
6.3.1 Calculation of dose 64
6.3.2 Screening of the factors affecting release profile of the drug from push - pull osmotic tablets
65
6.3.3 Product development and optimization of push
–pull osmotic tablets of Ropinirole HCl
66-92
I Formulation of push pull osmotically controlled
oral tablets of Ropinirole HCl
iii
Chapter
No Contents Page No
II Evaluation of the formulations 66
III Factor influence study 73
IV Numerical optimization with the help of
desirability
84
6.3.4 Product development and optimization of push
–pull osmotic tablets of Ivabradine HCl
93-118
I Formulation of push pull osmotic tablets of
Ivabradine HCl
93
II Evaluation of the formulations 93
III Factor influence study 100
IV Numerical optimization with the help of desirability
111
6.3.5 Product development and optimization of push
–pull osmotic tablets of Carvedilol phosphate
119-149
I Formulation of push pull osmotic tablets of
Carvedilol phosphate
119
II Evaluation of the formulations 119
III Factor influence study 126
IV Numerical optimization with the help of
desirability
170
6.3.6 Product development and optimization of push
–pull osmotic tablets of Nisoldipine
150-178
I Formulation of push pull osmotic tablets of Nisoldipine
150
II Evaluation of the formulations 150
III Factor influence study 157
IV Numerical optimization with the help of
desirability
170
6.3.7 Stability study of the optimized batches 179-183
I Stability study of the optimized push pull osmotic
tablets of Ropinirole HCl
180
II Stability study of the optimized push pull osmotic
tablets of Ivabradine HCl
iv
Chapter
No Contents Page No
III Stability study of the optimized push pull osmotic
tablets of Carvedilol phosphate
182
IV Stability study of the optimized push pull osmotic
tablets of Nisoldipine
183
6.4 In vivo animal studies 184-188
6.4.1 Standard calibration curve of the selected drugs in Rabbit plasma using RP- HPLC
184
6.4.2 In vivo animal study and analysis of blood samples
184
7 DISCUSSION 189-205
7.1 Analytical method development 189
7.2 Pre formulation study 189
7.3 Formulation development of push pull osmotic
tablets of highly and poorly soluble drugs
190
7.3.1 Dose calculation 190
7.3.2 Screening study 190
7.3.3 Product development and optimization of push – pull osmotic tablets of highly soluble drugs
191
7.3.4 Product development and optimization of push – pull osmotic tablets of poorly soluble drugs
194
7.3.5 Comparison of the results of the factor influence study
198
7.3.6 Mechanism of release of the highly soluble drugs from push pull osmotic tablets
200
7.3.7 Mechanism of release of the poorly soluble drugs from push pull osmotic tablets
202
7.4 Stability study of the optimized formulations 203
7.5 In vivo animal studies 204
8 SUMMARY AND CONCLUSION 206-207
9 RECOMMENDATIONS 208
BIBLIOGRAPHY APPENDIX
vi
LIST OF TABLES
Table
No List of tables Page No
MATERIALS AND METHODS
5.1.1 List of materials used in the project 23
5.2.1 List of instruments used in the project 24
5.3.1 Properties of Ropinirole HCl 25
5.3.2 Properties of Ivabradine HCl 26
5.3.3 Properties of Carvedilol phosphate 27
5.3.4 Properties of Nisoldipine 28
5.5.1 Categorizing the API according to the solubility study 30
5.5.2 Flow property scale 33
5.5.3 Flow property scale in terms of angle of repose 33
5.5.4 Instrumental conditions 34
5.6.1 Robinson - eriksen equation for the dose calculation 35
5.6.2 Ingredients used for the formulation of push pull OT of the selected drugs
36
5.6.3 Selected factors with levels for the factor influence study 37
5.6.4 Response selected for the factor influence study 37
5.6.5 Design matrix of the factor influence study(coded terms) 37
5.6.6 Composition of coating solution 40
5.6.7 Parameters maintained during coating process 40
5.6.8 Limits of weight variation test 42
5.6.9 Composition for making film 44
vii
SL No
Table
No List of tables
Page No
6 RESULT AND ANALYSIS
6.1.1 λmax of drugs 59
6.1.2 Results of the spectrophotometric analysis of selected drugs
60
6.2.1 Organoleptic properties of the selected drugs 61
6.2.2 Solubility of selected drugs in different pH solutions 61
6.2.3 Average particle size of the selected drugs 62
6.2.4 Density and flow property of the selected drugs 62
6.2.5 Melting points of the drugs as well as the formulation ingredients
63
6.3.1 Dose incorporated in the push pull osmotic tablets 64
6.3.2 Factor affecting the osmotic drug delivery systems 65
Product development and optimization of push –pull osmotic tablets of Ropinirole HCl
6.3.3 Formula for the trial R1- R10 67
6.3.4 Formula for the trial R11- R20 68
6.3.5 Blend evaluation of the DL and PL of Push pull OT of Ropinirole HCl
69
6.3.6 Whole tablet evaluation of push pull OT of Ropinirole HCl
70
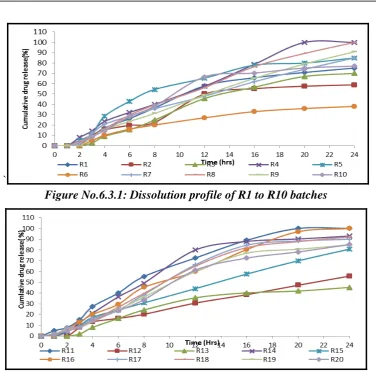
6.3.7 Dissolution profile of R1 to R10 batches 71
6.3.8 Dissolution profile of R11 to R20 batches 72
6.3.9 Coating film evaluation 73
6.3.10 Result of the factor influence study 74
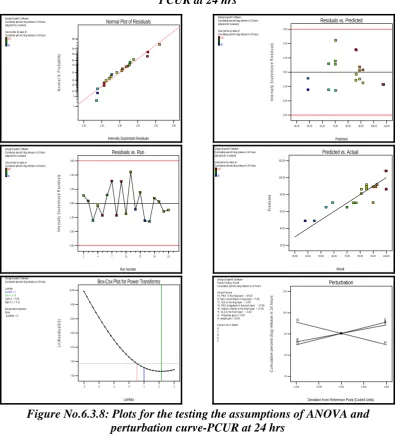
6.3.11 ANOVAand regression analysis for the PCUR at 24 hrs 76
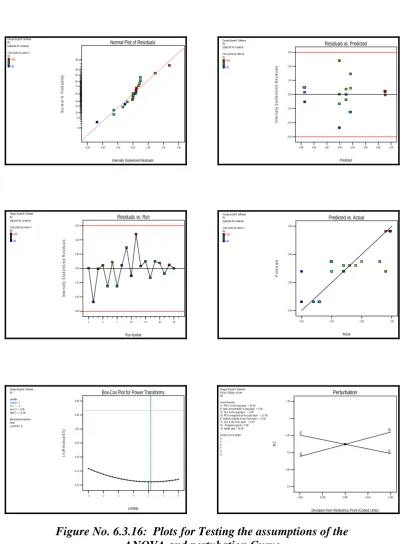
6.3.12 ANOVA and regression analysis for the effect of factors on R2
79
6.3.13 ANOVA and regression analysis of the effect of factors on the lag time
82
6.3.14 Constraints of optimization of Ropinirole HCl push pull OTs
85
6.3.15 Numerical solutions for the optimization of Ropinirole HCl push pull OTs
viii
SL No
Table
No List of tables
Page No
6.3.16 Prediction of the responses 89
6.3.17 Check point batches for the model validation of the Ropinirole HCl push pull OT
90
6.3.18 Composition of optimized batch of Ropinirole HCl 91
6.3.19 Optimized batch evaluation 91
Product development and optimization of push –pull osmotic tablets of Ivabradine HCl
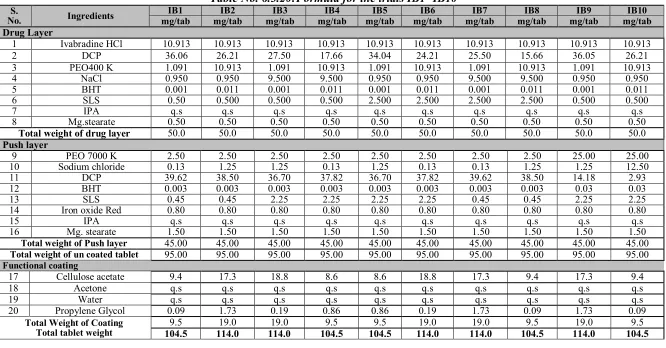
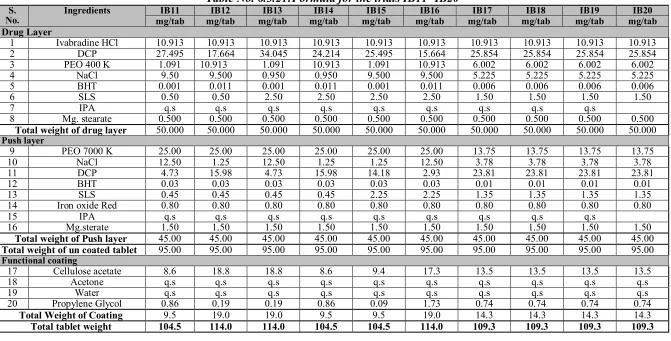
6.3.20 Formula for the trial IB1- IB10 94
6.3.21 Formula for the trial IB11- IB20 95
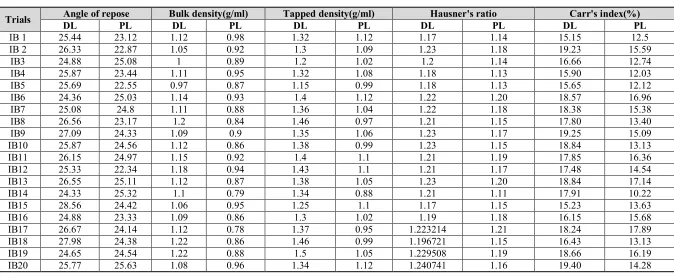
6.3.22 Blend evaluation of the DL and PL of push –pull OT of Ivabradine HCl
96
6.3.23 Whole tablet evaluation of push pull OT of Ivabradine HCl
97
6.3.24 Dissolution profile of IB1 to IB10 batches 98
6.3.25 Dissolution profile of IB11 to IB20 batches 99
6.3.26 Result of factor influence study 100
6.3.27 ANOVA and regression analysis for the effect of factors on PCUR at 24 hrs
102
6.3.28 ANOVA and regression analysis for the effect of factors on R2
106
6.3.29 ANOVA and regression analysis of the effect of factors on the lag time
109
6.3.30 Constraints fixed for the optimization of Ivabradine HCl push pull OTs
112
6.3.31 Numerical solutions for the optimization of Ivabradine HCl push pull OTs
113
6.3.32 Prediction of the responses 115
6.3.33 Check point batches for the model validation of the Ivabradine HCl push pull OTs
116
6.3.34 Composition of optimized batch 116
6.3.35 Optimized batch evaluation 117
Product development and optimization of push –pull osmotic tablets of Carvedilol phosphate
ix
SL No
Table
No List of tables
Page No
6.3.37 Formula for the trial C11- C20 121
6.3.38 Blend evaluation of the DL and PL of push –pull OTof Carvedilol phosphate
122
6.3.39 Whole tablet evaluation of push pull OT of Carvedilol phosphate
123
6.3.40 Dissolution profile of C1 to C10 batches 124
6.3.41 Dissolution profile of C11 to C20 batches 125
6.3.42 Result of the factor influence study 126
6.3.43 ANOVA and regrsssion analysis for the effect of factors on PCUR at 24 hrs
129
6.3.44 ANOVA and Regression analysis for the effect of factors on R2
135
6.3.45 ANOVA and regression analysis for the effect of factors on the lag time
138
6.3.46 Constraints fixed for the optimization of Carvedilol phosphate push pull OTs
141
6.3.47 Numerical solutions for the optimization of Carvedilol phosphate push pull OTs
143
6.3.48 Prediction of the responses 145
6.3.49 Check point batches for the model validation of the Carvedilol phosphate push pull OT
146
6.3.50 Composition of optimized batch 147
6.3.51 Optimized batch evaluation 147
Product development and optimization of push –pull osmotic tablets of Nisoldipine
6.3.52 Formula for the trials N1- N10 151
6.3.53 Formula for the trials N11- N20 152
6.3.54 Blend evaluation of the DL and PL of push –pull OTof Nisoldipine
153
6.3.55 Whole tablet evaluation of push pull OT of Nisoldipine 154
6.3.56 Dissolution profile of N1 to N10 batches 155
6.3.57 Dissolution profile of N11 to N20 batches 156
6.3.58 Result of factor influence study 157
x
SL No
Table
No List of tables
Page No
6.3.60 ANOVA and Regression analysis for the effect of factors on R2
165
6.3.61 ANOVA and regression analysis for the effect of factors on the lag time
168
6.3.62 Constraints fixed for the optimization of Nisoldipine Push pull OTs
171
6.3.63 Numerical solutions for the optimization of Nisoldipine Push pull OTs
172
6.3.64 Prediction of the responses 174
6.3.65 Check point batches for the model validation of the Nisoldipine push pull OTs
175
6.3.66 Composition of the optimized batch 176
6.3.67 Optimized batch evaluation 176
Stability study of the optimized batches
6.3.68 Stability study of the optimized batch- Ropinirole HCl 180
6.3.69 Stability study of the optimized batch- Ivabradine HCl 181
6.3.70 Stability study of the optimized batch- Carvedilol phosphate
182
6.3.71 Stability study of the optimized batch- Nisoldipine 183
In vivo animal studies
6.4.1 Calibration curve data 185
6.4.2 Standard calibration curve of the selected drugs in rabbit Plasma by RP-HPLC
185
6.4.3 Plasma concentrations of the test and references products obtained from in vivo animal study
186
6.4.4 Pharmacokinetic parameters of the test and references products obtained from in vivo animal study
187
xi
LIST OF FIGURES
Figure No List of Figures
1.INTRODUCTION
1.1.1 Plasma drug concentration profiles of controlled release and conventional formulations
1.1.2 Osmotic push pull pump
1.1.3 Systematic steps of design of experiments
5.MATERIALS AND METHODS
5.7.1 Schematic flow chart for the formulation of push pull osmotic systems 5.7.2 Components of push pull osmotic tablets
6.RESULT AND ANALYSIS
6.1.1 Ropinirole HCl Spectra in pH 6.8 Phosphate buffer 6.1.2 Ivabradine HCl Spectra in pH 6.8 Phosphate buffer 6.1.3 Carvedilol phosphate Spectra in pH 6.8 Phosphate buffer 6.1.4 Nisoldipine Spectra in pH 6.8 Phosphate buffer
6.1.5 Standard graph of Ropinirole HCl in pH 6.8 phoshate buffer solution 6.1.6 Standard graph of Ivabradine HCl in pH 6.8phosphate buffer solution 6.1.7 Standard graph of Carvedilol phosphate in pH 6.8phosphate buffer
solution
6.1.8 Standard graph of Nisoldipine in pH 6.8phosphate buffer solution 6.2.1 Particle size distribution of Ropinirole HCl
6.2.2 Particle size distribution of Ivabradine HCl 6.2.3 Particle size distribution of Carvedilol phosphate 6.2.4 Particle size distribution of Nisoldipine
6.2.5. DSC of Ropinirole HCl
6.2.6 DSC of Ropinirole HCl push pull osmotic tablets 6.2.7. DSC of ivabradine HCl
6.2.8 DSC of Ivabradine HCl push pull osmotic tablets 6.2.9 DSC of Carvedilol phosphate
6.2.10 DSC of Carvedilol phosphate push pull osmotic tablets 6.2.11 DSC of Nisoldipine
6.2.12 DSC of Nisoldipine push pull osmotic tablets
Product development and optimization of push –pull osmotic tablets of Ropinirole HCl
6.3.1 Dissolution profile of R1 to R10 batches 6.3.2 Dissolution profile of R11 to R20 batches
xii
Figure No List of Figures
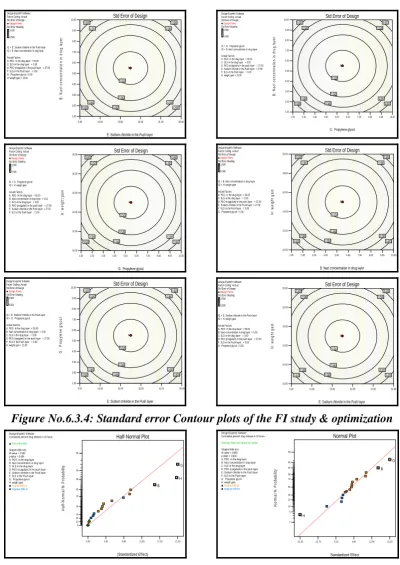
6.3.4 Standard error contour plots of the FI study & optimization 6.3.5 Half normal plot for the effect of the factors on the PCUR at 24 hrs 6.3.6 Normal plot for the effect of the factors on the PCUR at 24 hrs 6.3.7 Pareto chart for the effect of the factors on the PCUR at 24 hrs
6.3.8 Plots for the testing the assumptions of ANOVA and perturbation curve 6.3.9 RS Plot and Contour plot - Effect of NaCl DL and Propylene Glycol on
PCUR at 24 hrs
6.3.10 RS Plot and Contour plot -Effect of NaCl DL and weight gain on PCUR at 24 hrs
6.3.11 RS Plot and Contour plot - Effect of weight gain and Propylene Glycol on PCUR at 24 hrs
6.3.12 Cube plot of the Effect of NaCl DL, Propylene Glycol and Weight gain on PCUR at 24 hrs
6.3.13 Half Normal plot of the effect of the factors onR2 6.3.14 Normal plot of the effect of the factors onR2 6.3.15 Pareto chart of the effect of the factors onR2
6.3.16 Plots for testing the assumptions of the ANOVA and pertubation Curve 6.3.17 Contour plot and RS Plot – Effect of NaCl DL and NaCl PL on R2 6.3.18 Half Normal plot of the effect of the factors on lag time
6.3.19 Normal plot of the effect of the factors on lag time 6.3.20 Pareto chart of the effect of the factors on lag time
6.3.21 Plots for Testing the assumptions of the ANOVA and pertubation curve 6.3.22 Contour plot and RS Plot – Effect of NaCl DL and Propylene Glycol on
lag time
6.3.23 Contour plot and RS Plot – Effect of NaCl DL and weight gain on lag time
6.3.24 Contour plot and RS Plot – Effect of Weight gain and Propylene Glycol on lag time
6.3.25 Cube plot of effect of NaCl DL, Propylene Glycol and Weight gain on lag time
6.3.26 In-vitro dissolution study of the optimized batch
6.3.27 Desirability contour plot and RS plot – Effect of NaCl DL and Propylene Glycol
6.3.28 Desirability contour plot and RS plot – Effect of NaCl DL and weight gain
6.3.29 Desirability contour plot and RS plot – Effect of Weight gain and Propylene Glycol
xiii
Figure No List of Figures
6.3.31 Desirability contour plot and RS plot – Effect of NaCl DL and NaCl PL 6.3.32 Desirability contour plot and RS plot – Effect of NaCl PL and Propylene
Glycol
Product development and optimization of push –pull osmotic tablets of Ivabradine HCl
6.3.33 Dissolution profile of IB1 to IB10 batches 6.3.34 Dissolution profile of IB11 to IB20 batches
6.3.35 FDS graph of the design selected for the FI study & optimization 6.3.36 Standard error contour plots of FI study & optimization
6.3.37 Half normal plot for the effect of the factors on the PCUR at 24 hrs 6.3.38 Normal plot for the effect of the factors on the PCUR at 24 hrs 6.3.39 Pareto chart for the effect of the factors on the PCUR at 24 hrs
6.3.40 Plots for the testing the assumptions of ANOVA and perturbation curve 6.3.41 RS Plot and Contour plot - Effect of NaCl DL and Propylene Glycol on
PCUR at 24 hrs
6.3.42 RS Plot and Contour plot -Effect of NaCl in DL and weight gain on PCUR at 24 hrs
6.3.43 RS Plot and Contour plot - Effect of weight gain and Propylene Glycol on PCUR at 24 hrs
6.3.44 Cube plot of the Effect of NaCl DL, Propylene Glycol and Weight gain on PCUR at 24 hrs
6.3.45 Half normal plot of the effect of the factors onR2 6.3.46 Normal plot of the effect of the factors onR2 6.3.47 Pareto chart of the effect of the factors onR2
6.3.48 Plots for testing the assumptions of the ANOVA and pertubation Curve 6.3.49 Contour plot and RS Plot – Effect of NaCl DL and NaCl PL on R2 6.3.50 Half normal plot of the effect of the factors on lag time
6.3.51 Normal plot of the effect of the factors on lag time 6.3.52 Pareto chart of the effect of the factors on lag time
6.3.53 Plots for testing the assumptions of the ANOVA and pertubation curve 6.3.54 Contour plot and RS Plot – Effect of NaCl DL and Propylene Glycol on
lag time
6.3.55 Contour plot and RS Plot – Effect of NaCl DL and weight gain on lag time
6.3.56 Contour plot and RS Plot – Effect of Weight gain and Propylene Glycol on lag time
xiv
Figure No List of Figures
6.3.58 In-vitro dissolution study of the optimized batch
6.3.59 Desirability contour plot and RS plot – Effect of NaCl DL and Propylene Glycol
6.3.60 Desirability contour plot and RS plot – Effect of NaCl DL and Weight gain
6.3.61 Desirability contour plot and RS plot – Effect of Weight gain and Propylene Glycol
6.3.62 Desirability contour plot and RS plot – Effect of Weight gain and NaCl PL
6.3.63 Desirability contour plot and RS plot – Effect of NaCl DL and NaCl PL 6.3.64 Desirability contour plot and RS plot – Effect of NaCl PL and Propylene
Glycol
Product development and optimization of push –pull osmotic tablets of Carvedilol phosphate
6.3.65 Dissolution profile of C1 to C10 batches 6.3.66 Dissolution profile of C11 to IC20 batches
6.3.67 FDS graph of the design selected for the FI study & optimization 6.3.68 Standard error contour plots of FI study & optimization
6.3.69 Half normal plot for the effect of the factors on the PCUR at 24 hrs 6.3.70 Normal plot for the effect of the factors on the PCUR at 24 hrs 6.3.71 Pareto chart for the effect of the factors on the PCUR at 24 hrs
6.3.72 Plots for the testing the assumptions of ANOVA and perturbation curve 6.3.73 AD and AC interaction plots on PCR at 24 hrs
6.3.74 Contour plot and RS Plot - Effect of PEO DL and PEO PL on PCUR at 24 hrs
6.3.75 Contour plot and RS Plot -Effect of PEO DL and NaCl PL on PCUR at 24 hrs
6.3.76 Contour plot and RS Plot -Effect of PEO DL and Propylene Glycol on PCUR at 24 hrs
6.3.77 Contour plot and RS Plot -Effect of PEO DL and weight gain on PCUR at 24 hrs
6.3.78 Contour plot and RS Plot -Effect of PEO PL and NaCl PL on PCUR at 24 hrs
6.3.79 Contour plot and RS Plot -Effect of PEO PL and Propylene Glycol on PCUR at 24 hrs
6.3.80 Contour plot and RS Plot -Effect of PEO PL and weight gain on PCUR at 24 hrs
xv
Figure No List of Figures
6.3.82 Contour plot and RS Plot -Effect of NaCl PL and Propylene Glycol on PCUR at 24 hrs
6.3.83 Contour plot and RS Plot -Effect of weight gain and Propylene Glycol on PCUR at 24 hrs
6.3.84 Cube plot of the effect of PEO DL, Propylene Glycol and weight gain on PCUR at 24 hrs
6.3.85 Cube plot of the Effect of NaCl PL, PEO PL and Weight gain on PCUR at 24 hrs
6.3.86 Cube plot of the Effect of PEO PL, NaCl PL and PEO DL on PCUR at 24 hrs.
6.3.87 Cube plot of the Effect of PEO PL, Propylene Glycol and Weight gain on PCUR at 24 hrs
6.3.88 Half normal plot of the effect of the factors selected on R 2 6.3.89 Normal plot of the effect of the factors selected onR2 6.3.90 Pareto chart of the effect of the factors selected onR2
6.3.91 Plots for Testing the assumptions of the ANOVA and pertubation curve on R2
6.3.92 AC interaction plot on R2
6.3.93 Contour plot and RS Plot – Effect of NaCl DL and NaCl PL on R2 6.3.94 Contour plot and RS Plot – Effect of PEO DL and SLS DL on R2 6.3.95 Half normal plot of the effect of the factors selected on lag time 6.3.96 Normal plot of the effect of the factors selected for on lag time 6.3.97 Pareto chart of the effect of the factors selected on lag time
6.3.98 Plots for testing the assumptions of the ANOVA and pertubation Curve 6.3.99 Contour plot and RS Plot – Effect of NaCl DL and Propylene Glycol on
lag time
6.3.100 Contour plot and RS Plot – Effect of NaCl DL and weight gain on lag time
6.3.101 Contour plot and RS Plot – Effect of Weight gain and Propylene Glycol on lag time
6.3.102 Cube plot of effect of NaCl DL, Propylene Glycol and Weight gain on lag time
6.3.103 Invitro dissolution study of the optimized batch of Carvedilol phosphate push pull OT
6.3.104 Desirability contour plot and RS plot - Effect of PEO DL and NaCl DL 6.3.105 Desirability contour plot & RS plot -Effect of PEO DL and NaCl PL 6.3.106 Desirability contour plot and RS plot – Effect of PEO DL and PEO PL 6.3.107 Desirability contour plot and RS plot – Effect of PEO DL and Propylene
xvi
Figure No List of Figures
6.3.108 Desirability contour plot and RS plot – Effect of PEO DL and Weight gain
6.3.109 Desirability contour plot and RS plot – Effect of NaCl DL and PEO PL 6.3.110 Desirability contour plot and RS plot – Effect of NaCl DL and NaCl PL 6.3.111 Desirability contour plot and RS plot – Effect of NaCl DL and Propylene
Glycol
6.3.112 Desirability contour plot and RS plot – Effect of NaCl DL and Weight gain
6.3.113 Desirability contour plot and RS plot – Effect of PEO PL and NaCl PL 6.3.114 Desirability contour plot and RS plot – Effect of PEO PL and Propylene
Glycol
6.3.115 Desirability contour plot and RS plot – Effect of PEO PL and Weight gain
6.3.116 Desirability contour plot and RS plot – Effect of NaCl PL and Propylene Glycol
6.3.117 Desirability contour plot and RS plot – Effect of NaCl PL and Weight gain
6.3.118 Desirability contour plot and RS plot – Effect of Weight gain and Propylene Glycol
Product development and optimization of push –pull osmotic tablets of Nisoldipine
6.3.119 Dissolution profile of N1 to IN10 batches 6.3.120 Dissolution profile of N11 to N20 batches
6.3.121 FDS graph of the design selected for the FI study & optimization 6.3.122 Standard error contour plots of FI study & optimization
6.3.123 Half normal plot for the effect of the factors on the PCUR at 24 hrs 6.3.124 Normal plot for the effect of the factors on the PCUR at 24 hrs 6.3.125 Pareto chart for the effect of the factors on the PCUR at 24 hrs
6.3.126 Plots for the testing the assumptions of ANOVA and perturbation curve 6.3.127 AC interaction on PCR at 24 hrs
6.3.128 Contour plot and RS Plot - Effect of PEO DL and PEO PL on PCUR at 24 hrs
6.3.129 Contour plot and RS Plot -Effect of PEO DL and NaCl PL on PCUR at 24 hrs
6.3.130 Contour plot and RS Plot - Effect of PEO DL and Propylene Glycol on PCUR at 24 hrs
xvii
Figure No List of Figures
6.3.132 Contour plot and RS Plot -Effect of PEO PL and NaCl PL on PCUR at 24 hrs
6.3.133 Contour plot and RS Plot -Effect of PEO PL and Propylene Glycol on PCUR at 24 hrs
6.3.134 Contour plot and RS Plot -Effect of PEO PL and weight gain on PCUR at 24 hrs
6.3.135 Contour plot and RS Plot -Effect of NaCl PL and Propylene Glycol on PCUR at 24 hrs
6.3.136 Contour plot and RS Plot -Effect of NaCl PL and weight gain on PCUR at 24 hrs
6.3.137 Contour plot and RS Plot -Effect of weight gain and Propylene Glycol on PCUR at 24 hrs
6.3.138 Cube plot of the effect of PEO DL, PG and weight gain on PCUR at 24 hrs
6.3.139 Cube plot of the Effect of NaCl PL, PEO PL and Weight gain on PCUR at 24 hrs
6.3.140 Cube plot of the Effect of PEO PL, NaCl PL and PEO DL on PCUR at 24 hrs.
6.3.141 Cube plot of the Effect of PEO PL, Propylene Glycol and Weight gain on PCUR at 24 hrs
6.3.142 Half Normal plot of the effect of the factors selected on R2 6.3.143 Normal plot of the effect of the factors selected onR2 6.3.144 Pareto chart of the effect of the factors selected onR2
6.3.145 Plots for Testing the assumptions of the ANOVA and pertubation Curve 6.3.146 AC interaction Plot on R2
6.3.147 Contour plot and RS Plot – Effect of NaCl DL and NaCl PL on R2 6.3.148 Contour plot and RS Plot – Effect of PEO DL and SLS DL on R2 6.3.149 Half Normal plot of the effect of the factors selected on lag time 6.3.150 Normal plot of the effect of the factors selected on lag time 6.3.151 Pareto chart of the effect of the factors selected on lag time
6.3.152 Plots for Testing the assumptions of the ANOVA and perturbation Curve 6.3.153 Contour plot and RS Plot – Effect of NaCl DL and Propylene Glycol on
lag time
6.3.154 Contour plot and RS Plot – Effect of NaCl DL and weight gain on lag time
6.3.155 Contour plot and RS Plot – Effect of Weight gain and Propylene Glycol on lag time of Nisoldipine Push pull OT
xviii
Figure No List of Figures
6.3.157 In-vitro dissolution study of the optimized batch of Nisoldipine push pull OT
6.3.158 Desirability contour plot and RS plot -Effect of PEO DL and NaCl DL 6.3.159 Desirability contour plot & RS plot -Effect of PEO DL and NaCl PL 6.3.160 Desirability contour plot and RS plot – Effect of PEO DL and PEO PL 6.3.161 Desirability contour plot and RS plot – Effect of PEO DL and Propylene
Glycol
6.3.162 Desirability contour plot and RS plot – Effect of PEO DL and Weight gain
6.3.163 Desirability contour plot and RS plot – Effect of NaCl DL and NaCl PL 6.3.164 Desirability contour plot and RS plot – Effect of NaCl DL and PEO PL 6.3.165 Desirability contour plot and RS plot – Effect of NaCl DL and Propylene
Glycol
6.3.166 Desirability contour plot and RS plot – Effect of NaCl DL and weight gain
6.3.167 Desirability contour plot and RS plot – Effect of PEO PL and NaCl PL 6.3.168 Desirability contour plot and RS plot – Effect of PEO PL and Propylene
Glycol
6.3.169 Desirability contour plot and RS plot – Effect of PEO PL and weight gain 6.3.170 Desirability contour plot and RS plot – Effect of NaCl PL and Propylene
Glycol
6.3.171 Desirability contour plot and RS plot – Effect of NaCl PL and weight gain
6.3.172 Desirability contour plot and RS plot – Effect of weight gain and Propylene Glycol
Invivo animal studies
6.4.1 Calibration curve of Ropinirole HCl
6.4.2 Calibration curve of Ivabradine HCl
6.4.3 Calibration curve of Carvedilol phosphate
6.4.4 Calibration curve of Nisoldipine
6.4.5 Comparative plasma profiles of Ropinirole HCl
6.4.6 Comparative plasma profiles of Ivabradine HCl
6.4.7 Comparative plasma profiles of Carvedilol phosphate
Abbreviation
xxi
LIST OF ABBREVIATION
CRDDS Controlled release drug delivery systems
CR Controlled release
AUC Area under the curve
MSC Maximum safe concentration
OCODDS Osmotically controlled oral drug delivery systems
OT/OTs Osmotic tablet/Osmotic tablets
OODS Oral osmotic delivery systems
BCS Biopharmaceutical classification system
OROS Osmotically regulated oral system
PPOP Push pull osmotic pump
DoE Design of experiments
UV Ultra violet
λmax Lamda max
DSC Differential scanning colorimetry
OCOT Osmotically controlled oral tablet
PEO Poly ethylene oxide
NaCl Sodium chloride
SLS Sodium lauryl sulphate
PG Propylene Glycol
CA Cellulose acetate
DCP Di calcium phosphate
IPA Iso propyl alcohol
BHT Butylated hydroxy toluene
DL Drug layer
PL Push layer
Factor A Poly ethylene oxide in drug layer
Factor B Sodium chloride in drug layer
Factor C Sodium lauryl sulphate in drug layer
Abbreviation
xxi
Factor E Sodium chloride in push layer
Factor F Sodium lauryl sulphate in push layer
Factor G Propylene Glycol
Factor H Weight gain
PCUR Percentage cumulative release
R2 Release rate constant
Wt gain Weight gain
ANOVA Analysis of variance
SL Significant level
p-value Probability value
FDS curve Fraction of design space curve
RS plot Response surface plot
CI Confidence interval
TI Tolerance interval
RH Relative humidity
HPLC High performance liquid chromatography
Cmax Maximum plasma concentration
tmax Time to reach maximum plasma concentration
T ½ Half life
Kel Elimination constant
mg Milligram
ml Milliliter
μg Microgram
mm Millimeter
cm Centimeter
nm Nanometer
hrs Hours
0
C Degree Celsius
Abs Absorbance
Chapter -1
Introduction
1
1. INTRODUCTION
1.1. CONTROLLED DRUG DELIVERY SYSTEMS 1, 2-5
Controlled release drug delivery systems (CRDDS) offer many advantages
over conventional dosage forms like improved patient compliance and
convenience and reduced adverse effects. A constant therapeutic plasma
concentration of the drug within the therapeutic index of the drug over extended
periods was maintained in CRDDS. Figure No. 1.1.1.
Figure No.1.1.1: Plasma drug concentration profiles of controlled release and conventional formulations
In conventional oral dosage forms, the resulting pattern of concentration of
drug in plasma widely varies and this may cause unpredictable and undesired
clinical effects. Variations of the blood concentration above the MSC may result
in adverse effects. With CR products drug entry with a precise extent, rate, or
timing into the blood can be programmed or achieved. Release of the drugs from
all other conventional dosage forms except intravenous dosage forms follows
first-order kinetics. This results in irregular high and low concentrations and only
a brief optimal therapeutic level. But the controlled release systems release the
drug at a constant rate (zero order) for a definite time period. This results in
consistent concentration of drug in tissue and plasma. In order to maintain blood
Higher prevalence of side effects in this region
MSC
MEC
Time - 24 hours
Plasm
a
co
ncentra
tion
Zero-order controlled-release formulation
Introduction
2 concentrations within the therapeutic index, frequent dosing will be done for drugs
with short half life. Frequency of dosing and patient compliance is inversely
related. CR products have the potential to improve patient compliance by reducing
the number of daily doses.
1.2. ADVANTAGES OF OSMOTIC DRUG DELIVERY SYSTEM 5
Zero order delivery rate can be achievable.
Pulsed or delayed drug delivery is obtainable.
In vitro delivery rate can be accurately predicted using mathematical equations.
High level of in vivo correlation.
Rate of delivery is independent of pH variations in the gastrointestinal tract
environment.
Rate of delivery is independent of agitations like GI motility.
Rate of release from osmotic system is well predictable and programmable.
Drugs are delivered from the system in the solution form which is ready for
absorption.
Delivery rate is nearly independent of delivery orifice size within limits.
Device is reasonably simple to produce.
Drugs with extensively altering solubility’s can be included.
1.3. DRUG CANDIDATE SELECTION FOR OCODDS 4-5
The selection of the OCODDS technology should be done only after
studying the pharmacokinetic profile of the drug under consideration. In order to
formulate a successful extended-release dosage form, drugs which have higher
permeability, less pre systemic metabolism, no absorption window can be chosen.
Ideal BCS classes are I, II and V. For BCS class I, the solubilisation step is
usually quick and not rate-limiting. So permeability characteristics determine the
drug release and absorption. For BCS class II and V, solubility is rate limiting and
drug should be delivered in an oversaturated solution. Consistent absorption of the
Introduction
3 not, the use of OCODDS may not be beneficial because of the impaired
bioavailability. Drug solubility and dosage strength are the main two criteria that
should be taken care of during the device selection for OCODDS. In order to
deliver highly soluble drugs elementary osmotic pumps, controlled porosity
osmotic pumps and swellable core osmotic pumps are considered to be better than
other devices. Osmotic devices using self emulsifying technologies can be used
for poorly soluble drugs. But push pull and push stick osmotic pumps can
indiscriminately be used for both highly and poorly soluble drugs.
1.4. PUSH PULL OSMOTIC TABLETS 1- 37
Figure No.1.1.2: Osmotic push pull pump
Push pull osmotic tablet is a tailored made elementary osmotic pump
intended to release the drug at zero order rate. This device resembles a bilayer
coated tablet. The upper layer contains drug, polymeric osmotic agent and other
tablet ingredients. This polymeric osmogen can form a suspension of drug in situ
when this tablet later imbibes water. The other layer contains osmotic agent,
polymer, colouring agent and other tablet excipients. The layers are made and
punched together to form a bilayer single core. A layer of semipermiable
membrane coat of reasonable thickness is applied over the bilayer tablet. A small
opening can be drilled on the membrane usually on the drug layer with the help of
mechanical or laser drill. The balance between the osmotic pressure created by the
osmotic agent present both in drug and push layer was responsible for the perfect
zero order release. This device is equally suitable for both highly and poorly
Introduction
4
1.5. DESIGN OF EXPERIMENTS 38-51
The QbD (Quality by design) is a systemic approach to pharmaceutical
development. ICH Q8 guidance, states that “quality cannot be tested into
products; it should be built in by design”. This new advance to development of
products could increase efficiencies, provide flexibility, regulatory support and
offer significant business benefits. The FDA publicized a new initiative (cGMP
for the 21st Century: A Risk based Approach) in 2002. This initiative proposed to
modernize the FDAs regulation of pharmaceutical quality, and establish a new
regulatory agenda focused on risk management, QbD, and quality system. The
initiative of the FDA challenged industry to look beyond quality by testing (QbT)
for ensuring product quality and performance. An important part of QbD is to
understand how process and formulation parameters affect the product
characteristics and subsequent optimization of these parameters. This is done with
the help of design of experiments.
1.5.1. Importance of Design of experiments.
Design of experiments (DOE) extensively helps the designers to figure out
simultaneously the main as well as the interaction effects among the vast number
of factors which are affecting the actual outcome. DOE helps to pin point the
responsive parts and sensitive areas in your process that cause problems in the
outcome of the process. The findings can be used to furnish a fruitful process. The
major advantages of DoE can be summarised as follows,
A one factor at a time approach (OFAT) adopted by most of the industries
burden the manufacturer with large number of experimental trials, which is
time consuming and costly. Well designed experimental trials reduce both
the problems.
Systematic study of the interaction of factors can be done, which are not
possible with OFAT experiments.
Factor space and design space can be identified. The forecast of the
response in the factor space can be done as per the requirements. The
Introduction
5
1.5.2. Flow chart of the proceedings using DoE
The systematic steps of optimization of products using DoE is shown in the
flow chart given below,
Figure No 1.1.3: Systematic steps of design of experiments 43
1.5.3. Screening studies
When large number of factors were affecting a process/ product outcome, it
is essential to identify the few vital factors. Screening designs are used for
reducing the number of factors down to the few that have vital effects. These
important factors are then examined more closely using other design models. In a
screening design, each continuous factor is usually set at two levels to economize
on the number of runs required. The design consists of a fraction of the possible
combinations of factor levels.
1.5.4. Factor influence study
When vital factors are identified, a factor influence study will be done to
find out the magnitude of the factor influences. When sufficient literatures are
Known factors Un Known factors
Screening Screening
Factor effects and Interactions
Vital few
Trivial many
No
Yes
Response surface Methods Characterization
Optimization
Confirmation
Yes
Back up
Celebrate Curvature
Introduction
6 available, researcher can skip the screening study and start with factor influence
study. Full factorial designs and fractional factorial design are used for factor
influence study.
1.5.5. Full factorial designs
A full factorial DOE is a planned set of tests on the response variable(s)
with one or more inputs (factors) with all combinations of levels. Commonly used
full factorial designs are 2 level full factorial designs and 3 level full factorial
designs.
1.5.6. Fractional factorial designs
Fractional factorial design in the following way: "A factorial experiment in which only an adequately chosen fraction of the treatment combinations required for the complete factorial experiment is selected to be run." 49 Full factorial designs are the first choice for any problems. But the main disadvantages of these
designs are the existence of large number of runs. For a 26 full factorial design 64
runs should be executed. A good number of center point runs also to be added to
this design to predict the linearity/non linearty of the model.
Fractional factorial designs or partial design offers the flexibility of performing
the runs in fractions such as ½, ¼, 1/8, 1/16 etc. Various approaches that ensure a
fitting, choice of runs can be used. The basic purpose of a fractional factorial
design is to economically investigate cause-and-effect relationships of
significance in a given experimental setting.
Lower resolution fractional factorial designs are only used to study the main
effects as the main effects are aliased with two way or 3 way interactions. So these
deigns are called as screening designs.
Designs with resolution five or higher are used estimate main
effects as well as interaction effects. The main effects are aliased with 4 way/5
way interaction which can be negligible. The results obtained are considered to be
accurate than the lower resolution fractional factorial designs. Theses designs can
Chapter- 2
Aims &Objectives
7
2. AIMS AND OBJECTIVES
2.1. AIMS OF THE STUDY
For a successful drug therapy the concentration of the drug in the plasma
should be maintained constant within the therapeutic index (TI) throughout the
treatment period. It avoids the fluctuations in plasma concentration of drug and
improves the patient compliance. Diseases which need a longer duration of
treatment (sometimes a life time) require more careful medications and drug
delivery systems for the better patient compliance and comfort. Controlled release
drug delivery systems, release the drug at a controlled and constant manner within
the therapeutic index throughout the treatment period. Osmotic pumps are such a
device which can strictly maintain a controlled release of the drug in the blood
plasma within the therapeutic index up to the desired time period.
The drug candidates were selected after extensively studying the drug
properties for the suitability of osmotic drug delivery systems. Ropinirole HCl is a
potent antiparkinsons agent having a half life of 6 hrs. It is highly soluble in water
(BCS class I) and absorbed fastly achieving the peak plasma concentration within
1-2 hours. Ivabradine HCl which is an anti ischemic drug having half life 2 hrs,
highly soluble (BCS class I) and rapidly absorbed after oral administration.
Therefore, both these drugs are potential candidates for controlled drug delivery
formulations; however, controlling its release is a challenging task due to its high
water solubility.
Carvedilol phosphate which is an Alpha/beta-adrenergic blocking agent
having half life 7-10 hrs and Nisoldipine, a calcium channel blocker having a
half life of 7 -12 hrs. Both these drugs are poorly water soluble (BCS class II)
making the candidates extremely problematic for any type of extended/controlled
Aims &Objectives
8 So our work aims to develop a suitable dosage form for successfully
delivering both the categories of drugs which can release the selected drugs at a
zero order rate throughout the treatment period. As tablets are considered one of
the best acceptable dosage forms, an OCODDS in the form of tablets was chosen
as the drug delivery system for the selected drugs. The selected drugs show
extreme solubility characteristics. So development of push pull type osmotic
tablets was planned for the successful delivery of the drugs as this is the only
device which is equally suitablefor the complete as well as constant delivery of
both highly and poorly soluble drugs.
So aim of our study is to develop and optimize push pull osmotic tablets of
highly water soluble drugs (Ropinirole HCl, Ivabradine HCl) and highly water
insoluble drugs (Carvedilol phosphate, Nisldipine) that deliver the drug at zero
order rate up to 24 hours.
The major challenges during the development of push pull osmotic tablets
are the optimization of core as well as coating parameters to achieve the desired
release profile. So a factor influence study of core variables and coating
membrane variables on the release profile of the selected drugs from the device
were planned using design of experiments. As the selected drugs show extreme
solubility characteristics, the study also focus on the extensive comparison of
different core and membrane variables affecting the release profile of the highly
and poorly water soluble drugs. The study also aims on the optimization of the
significant variables/factors of both core and membrane using numerical
Aims &Objectives
9
2.2. OBJECTIVES OF THE STUDY
To develop and evaluate an OCODDS (Push pull osmotic tablets) of
highly and poorly water soluble drugs.
To study and optimize core as well as membrane parameters affecting the
release profile using design of experiments (DoE)
To compare and conclude the effect of different parameters of the
formulation on the release profile/pattern of the selected drugs from the
device using different statistical tools.
To optimize the push pull osmotic tablet formulation of all the four
selected drugs using numerical optimization and desirability techniques.
To study the factor influence on the desirability function of highly and
poorly soluble drugs.
To conduct the stability studies of the selected optimized formulations as
per ICH guidelines.
To conduct an in vivo animal studies for the selected optimized
Chapter -3
Literature Review
10
3. LITERATURE REVIEW
Wakode R et al, 2010 52 developed push pull osmotic tablets of Pramipexole. Invivo efficiency of the once a day formulation was evaluated. The formulation contained bilayered tablets of drug layer and polymer layer coated
with cellulose acetate membrane with water soluble pore forming agents.
Different pharmacokinetic parameters were estimated. The developed formulation
maintained plasma levels of pramipexole with in the TI for time duration of 24
hrs.
Wakode R et al, 2012 53 developed and characterized an extended release push-pull osmotic oral system which can deliver Pramipexole at a constant rate.
A bilayer osmotic drug delivery device with an orifice at the drug layer was
developed. They studied the effect of the concentration of a pore-forming agent
such as PEG 400, pH of dissolution media, dibutyl phthalate, the effect of
agitation and osmotic agents on drug release. The release of the drug was found to
follow zero order kinetics. Release of the drug was increased with an increase in
osmotic pressure.
Mane SS et al, 2012 54 focused on various components of osmotic systems, their role in controlling drug release, different types of ODDS in research
phase and some formulations available in market.
Zhang ZH et al, 2011 55 for the formulation ofpush –pull osmotic pump tablets an expert system was built. A vast number of poorly soluble drugs were
studied. Rules regarding the PPOP was created and recorded in the database for
preparations containing poorly soluble drugs and pharmaceutical excipients. Large
number of articles available was also studied. A back propagation (BP) neural
network was used for the prediction of release behaviour of the drug from the
systems.
Literature Review
11
Chaudhary A et al, 2011 56 developed a micro porous bilayer oral drug delivery system for colon targeting. Dicyclomine hydrochloride and Diclofenac
potassium were the drugs of choice. Various formulation variables were studied
for their effect on the drug release. Osmogen, hydroxy propyl methyl cellulose,
sodium carboxy methyl cellulose and pore former were studied. In vitro
dissolution results confirmed that the system showed acid-resistant, timed release.
A zero order release up to 24 hrs was reported.
Waterman KC et al, 2011 57 described an osmotic, oral, controlled-release capsule. Constant delivery rates (t 80%=6 or 14 h) obtained was reported
which was independent of drug properties (e.g., solubility or drug loading). The
findings will be useful for rapid development of formulations of drugs. This
concept type formulation offer greater flexibility for the clinical trials.
Sankar C et al, 2011 58 developed osmotic tablets as well as capsules of Amoxicillin and combination with Tinidazole. Further preparation of osmogen
coated tablets was done for evaluating coat and core osmogen effects. Prepared
osmotic pump tablets as well as capsules would be a better alternative in complete
eradication of H. Pylori infection with improved patient compliance and reducing
toxicity, bacterial resistance.
Thakor RS et al, 2010 59 reviewed different types of oral osmotic devices, various features and different factors affecting drug release from these devices,
and its critical formulation factors. The release of drug(s) from osmotic systems
was governed by different formulation factors such as solubility and osmotic
pressure of the core component(s), nature of the rate-controlling membrane and
size of the delivery orifice. With the help of optimization of process and
formulation factors, development of osmotic systems to deliver drugs of varied
nature at a pre-programmed rate was done.
Malaterre V et al, 2009 60 studied different factors and its effect on the drug release. Polynomial equations and mathematical assumptions and statistical
Literature Review
12 and Chlorpheniramine (CPA) were selected as the model drugs. Different
significant factors and its effects on the release rate and extend were studied. To
predict the drug delivery kinetics of the formulated push pull osmotic tablets the
suggested mathematical models were used and found to be useful and efficient for
optimization.
Rathore GS et al, 2009 61 described various oral osmotically controlled devices. Formulation aspects, clinical applications and different evaluation
methods were explained.
Liu L et al, 2008 62 developed a bilayer-core osmotic pump device (OPD) which does not require mechanical formation of the orifice during manufacturing.
Optimization of the formulations variables was done with the help of orthogonal
design. Similarity factor (f2) was used to evaluate various formulations. The
preparated bilayer-core tablets were coated with highly soluble pore forming agent
which will produce drug delivery pores insitu. Both release media and agitation rates were not affecting the rate and extend of the drug release. A 24 hr release
with zero order was achievable which was proven highly predictable and
reproducible.
Pramod Kumar et al, 2009 63 developed a unitary core osmotic pump system of Tramadol hydrochloride (TRH). Different formulation factors affecting
drug delivery kinetics were identified as expandable polymer and plasticizer,
thickness of the coating membrane. The effect of the above said factors were
closely monitored and reported. A positive relationship was found between level
of plasticizer and osmotic pressure with release rate. But the change in the
expandable polymer and core thickness had a negative effect on the release rate.
Patel VK et al, 2012 64 developed a push-pull osmotic pump for zero order delivery of Lithium carbonate for a period of 24 hr. The effect of various
formulation variables on bilayer core tablet and its semi permeable coating along
with orifice diameter have been investigated and optimized for desired drug
Literature Review
13 and drug release. But a direct effect was reported for the amount of pore formers.
Tang X et al, 2013 65 designed and evaluated Gliclazide push-pull osmotic pump (PPOP) coated with aqueous colloidal polymer dispersions-Eudragit(®) RL
30D and Eudragit(®) RS 30D. The influence of diacetin, diethyl phthalate, dibutyl
sebacate and triethyl citrate on the free Eudragit (®) RL 30D and Eudragit (®) RS
30D films as plasticizers on drug release were studied. Among these four
plasticizers, diacetin offered the smoothest surface of the cast films, and it
displayed greatest water vapor transmission coefficient. Free RL and RS films
with diacetin also exhibited greatest erosion compared with the other three
plasticizers.
Derakhshandeh K et al, 2014 66 designed a permeable osmotically driven drug delivery system for controlling the release of Buspirone from the delivery
system. The core of the tablets was prepared by direct compression technique and
coated using dip-coating. The effect of various processing variables such as the
amount of osmotic agent, the amount of swellable polymer, concentration of the
core former, concentration of the plasticizer, membrane thickness and quantum of
orifice on drug release from osmotic pump were evaluated.
Sharkheliya DB et al, 2013 67developed push pull osmotic tablets of Glipizide. Cellulose acetate NF (CA-398-10 NF) in a concentration of 8 % w/w
for 10.0 mg tablet was optimized as coating polymer and Polyethylene Glycol
3350 NF in a concentration of 0.284% as pore former for Glipizide tablets.
Veronica C et al, 1999 68 demonstrated efficiently the advantages of designed experiments over one factor at a time (OFAT) experiments. Real life
examples were demonstrated to justify the major significances of the designed
experiments in various research areas.
Literature Review
14 micro openings on both the sides. The push layer was sandwiched between two
drug layers. By this formulation maximum drug loading can be achievable.
Different formulation variables were studied and its effects on the release rate
were reported. The study reported a similar release rate and profile up to 24 hrs as
that of the marketed push pull osmotic tablet of Nifedipine.
Ketjinda W et al, 201170 prepared oral push–pull osmotic device of Felodipine. A complex of chitosan (CS) and poly(acrylic acid) (PAA) was used
as osmogen. The effects of different variables like compression forces, type of
plasticizers and polymer concentrations on release profile of the drug were
studied. The study revealed that a 12 hrs or 24 releases with a zero order was
programmable by changing the plasticizer. A prolonged lag time and slower
release of the drug was obtainable with dibutyl sebacate as plasticizer. But by
using polyethylene glycol 400 a shorter lag time and faster release was achieved.
Jinghua Y et al, 2011 71 determined the effects of various concentrations of cellulose acetate to PEG, solvent systems and molecular weights of PEG on the
permeability of CA-free films and thermo mechanical properties. Statistical
approaches were used for analyzing the effect of the above mentioned factors on
the responses. These researchers reported graphical and mathematic
representations of the effect of factors on the responses.
Mutyaba MR al, 201172 developed and optimized an osmotically controlled drug delivery system of Diclofenac sodium. A level
three-factorial Box–Behnken experimental design was used to characterize and optimize
three formulation parameters, i.e. level of osmotic agent, pore former and
plasticizer. Initial level of pore former had a positive effect on the release rate of
drug, but membrane weight and osmotic pressure had a negative effect.
Patel KN et al, 2013 73 optimized and evaluated push pull osmotic pump (PPOP) tablets of Nicardipine hydrochloride (NH). A 32 full factorial design was
Literature Review
15 independent variables that influence the drug release. Solubility of the NH was
improved by preparing inclusion complex using β-Cyclodextrin. Optimization of
amount of osmotic agent, and osmopolymer were done to obtain the predicted
drug release. From the in vitro drug release study, it was reported that the release rate is increased with the amount of osmotic agent and osmopolymer.
Saini S et al, 2012 74 formulated and evaluated colon targeted drug delivery system using microbially triggered osmotically controlled approach.
central composite design - face centred was used to study the effect on
independent factors (concentration of sodium chloride, polyethylene glycol, and
chitosan) on percentage cumulative release and disintegration time. The research
revealed that solubilising agent chitosan had a major significant effect on the drug
release than the other factors.
Malaterre V et al, 2009 75 developed a push–pull osmotic system to transport poorly soluble drugs. Different core tablet factors were studied for its
effect on the drug release kinetics and loadability. The study revealed that either
core factors or the membrane characteristics can be modulated for obtaining the
desired release profile. Changes in the concentrations of swellable polymer in the
drug layer and osmotic agent in the drug layer were a better option than changing
the membrane characteristics to obtain the desired release. Effect of the drug
loading on the release rate was also investigated. An undisturbed 24 hrs zero order
release was reported up to 20% of the drug loading. This could be achieved by
carefully tailoring concentration of osmotic agent proportions and by selecting
viscous-grade polymers.
Malaterre V et al, 2009 76 investigated the use of magnetic resonance imaging (MRI) for determining the mechanism of release from push–pull osmotic
Device. A new benchtop apparatus was demonstrated in this research paper. A
Non invasive study was carried out to characterize the hydration and swelling
kinetics by monitoring the signal intensity profiles of both PPOS layers. High
Literature Review
16 hydration. The work showed that the tablet core composition, high osmotic
pressure developed by the push layer, the hydration of both the drug and the push
layers were the significant factors controlling the hydration and swelling. A
proper balance between the factors will le