INDICATING RP-HPLC METHOD FOR ESTIMATION
OF NELARABINE IN BULK AND PHAMACEUTICAL
DOSAGE FORM
A dissertation submitted to
THE TAMILNADU Dr.M.G.R MEDICAL UNIVERSITY
CHENNAI- 600 032.In partial fulfillment of the requirements for the award of Degree of
MASTER OF PHARMACY
IN
PHARMACEUTICAL ANALYSIS
Submitted By
Reg No: 261230958
DEPARTMENT OF PHARMACEUTICAL ANALYSIS
EDAYATHANGUDY.G.S PILLAY COLLEGE OF PHARMACY
Department of Pharmaceutical Analysis,
Edayathangudy.G.S.Pillay College of Pharmacy,
Nagapattinam – 611 002.
CERTIFICATE
This is to certify that the dissertation entitled
“Development and
validation of stability indicating RP- HPLC method for estimation of
Nelarabine in bulk and pharmaceutical dosage form”
submitted by
Srinivas ganta
(Reg No: 261230958) in partial fulfillment for the award
of degree of Master of Pharmacy to the Tamilnadu Dr. M.G.R Medical
University, Chennai is an independent bonafide work of the candidate
carried out under my guidance in the Department of Pharmaceutical
Analysis, Edayathangudy.G.S Pillay College of Pharmacy during the
academic year 2013-2014.
Place: Nagapattinam
(Prof.
Dr. Dheen Kumar,
M.Pharm., Ph.D.,)
I would like to express profound gratitude to
Chevalier
Thiru.G.S.Pillay,
Chairman, E.G.S.Pillay College of Pharmacy, and
Thiru. S.Paramesvaran,
M.Com., FCCA.,Secretary, E.G.S.Pillay College
of Pharmacy.
I express my sincere and deep sense of gratitude to my guide
Dr.
P. Dheen Kumar, M. pharm, PhD.,
Associate professor, Department of
Pharmaceutical Analysis. E.G.S.Pillay College of Pharmacy, for his
invaluable and extreme support, encouragement, and co-operation
throughout the course of my work.
It is my privilege to express my heartfelt thanks to
Prof.
Dr.D.Babu Ananth,
M.Pharm, Ph.D.,
Principal, E.G.S.Pillay College of
Pharmacy, for providing me all facilities and encouragement throughout
the research work.
I express my sincere gratitude to
Prof. Dr.M.Murugan,
M.Pharm.,Ph.D
.
, Director cum Professor, Head, Department of Pharmaceutics.
E.G.S.Pillay College of Pharmacy, for his encouragement throughout the
course of my work.
I wish to express my great thanks to
Prof.K.Shahul Hameed
Maraicar,
M.Pharm., (Ph.D),Director cum Professor , Department of
Pharmaceutics, E.G.S.Pillay College of Pharmacy, for his support and
valuable guidance during my project work.
I would like to extend my thanks to all the
Teaching Staff
and
Non Teaching Staff
, who are all supported me for the successful
and kindness.
INDEX
S.NO
CONTENTS
PAGE NO
1
INTRODUCTION
1
2
DRUG PROFILE
35
3
LITERATURE REVIEW
38
4
PLAN OF WORK
42
5
MATERIALS & METHODS
43
6
RESULTS & DISCUSSION
58
7
SUMMARY
95
8
CONCLUSION
96
1. INTRODUCTION
The quality of a drug plays an important role in ensuring the safety and efficacy of the drugs. Quality assurance and control of pharmaceutical and chemical formulations is essential for ensuring the availability of safe and effective drug formulations to consumers. Hence Analysis of pure drug substances and their pharmaceutical dosage forms occupies a pivotal role in assessing the suitability to use in patients. The quality of the analytical data depends on the quality of the methods employed in generation of the data. Hence, development of rugged and robust analytical methods is very important for statutory certification of drugs and their formulations with the regulatory authorities.[1]
The wide variety of challenges are encountered while developing the methods for different drugs depending on its nature and properties. This along with the importance of achieving the selectivity, speed, cost, simplicity, sensitivity, reproducibility and accuracy of results gives an opportunity for researchers to come out with solution to address the challenges in getting the new methods of analysis to be adopted by the pharmaceutical industry and chemical laboratories.
1.1.ANALYTICAL METHODS
Analytical methods are defined as the set of techniques that allow us to
determine qualitatively and / or quantitatively the composition of any material and chemical state in which it is located.[1]
Chemical methods
:
The chemical methods include the gravimetric and volumetric procedures which are based on complex formation; acid-base, precipitation and redox reactions. Titrations in non-aqueous media and complexometry have also been used in pharmaceutical analysis.[2]
Instrumental (Physical methods) :
Table. No. 1.1. Classification of Instrumental methods
S.NO
Method
Examples
1. Electrochemical methods [2]
Potentiometry Conductometry Electrogravimetry
Polarography Coulometry
2. Optical methods Atomic absorption
spectroscopy Raman spectroscopy Emission spectroscopy Refractometry Absorption spectrophotometry Turbidimetry Nephelometry Luminescence analysis X-Ray spectroscopy
3. Radiometric methods Isotopic dilution
4. Mass spectroscopy
5. Nuclear magnetic resonance
6. Chromatography
(separation and analytical method)
Thin layer Chromatography Paper Chromatography Column Chromatography High Performance Liquid
Ion Exchange Chromatography Gas Chromatography
1.2 CHROMATOGRAPHY
Chromatography (Chroma means ‘color’ and graphein means to ‘write’) is the collective term for a set of laboratory techniques for the separation of mixtures. It involves passing a mixture dissolved in a "mobile phase" through a stationary phase, which separates the analyte to be measured from other molecules in the mixture based on differential partitioning between the mobile and stationary phases.[3]
Table. No.1. 2.Different types of chromatographic techniques
S. No
Basic principle involved
Type of Chromatography
1. Techniques by chromatographic bed
shape
Column chromatography
Paper chromatography
Thin layer chromatography
2 Techniques by physical state of mobile
phase
Gas chromatography
Liquid chromatography
3 Affinity chromatography Supercritical fluid chromatography
4 Techniques by separation mechanism Ion exchange chromatography
Size exclusion chromatography
5 Special techniques Reversed phase chromatography
Simulated moving-bed
chromatography
Pyrolysis gas chromatography
Counter current chromatography
Chiral chromatography
1.3.HIGH PERFORMANCE LIQUID CHROMATOGRAPHY (HPLC)
The modern form of column chromatography has been called high performance, high
pressure, high-resolution and high-speed liquid chromatography.
High-Performance Liquid Chromatography (HPLC)is a special branch of column
chromatography in which the mobile phase is forced through the column at high
speed. As a result the analysis time is reduced by 1-2 orders of magnitude relative to
classical column chromatography and the use of much smaller particles of the
adsorbent or support becomes possible which increase the column efficiency
substantially.[4]
CLASSIFICATION OF HPLC
Table. No. 1.3.Classification of Chromatography [4]
Sl. No Type of Chromatography
1 Modes of Chromatography
Normal phase Chromatography
Reverse phase Chromatography
2 Principle of separation
Adsorption Chromatography Partition Chromatography Ion exchange Chromatography Size exclusion Chromatography
Affinity Chromatography Chiral phase Chromatography
3 Elution Technique
Isocratic Separation
Gradient Separation
4 Scale of Operation
Analytical HPLC
Preparative HPLC
5 Type of Analysis
Qualitative Analysis
Partition chromatography
This method results from a thermodynamic distribution of analytes between two liquid phases. On the basis of relative polarities of stationary and mobile phase, partition chromatography can be divided into normal phase and reverse phase chromatography.
Normal Phase - High Performance Liquid Chromatography
(NP-HPLC)
In Normal phase HPLC the stationary phase is polar and mobile phase is non-polar. Common solvents (such as hexane, heptanes, etc.) with the small addition of polar modifier (i.e., methanol, ethanol) are generally used. Packing materials traditionally used in NP-HPLC are usually porous oxides such as silica (SiO2) or alumina (Al2O3). Surface of these stationary phases is covered
with the dense population of OH groups, which makes these surfaces highly polar. Chemically modified stationary phases can also be used in NP-HPLC. Silica modified with trimethoxy glycidoxypropyl silanes (common name: diol-phase) is typical packing material with decreased surface polarity. Since NP-HPLC uses mainly non-polar solvents, it is the method of choice for highly hydrophobic compounds (which may show very stronger interaction with non polar mobile phases), which are insoluble in polar or aqueous solvents.[5]
Reversed Phase - High Performance Liquid Chromatography
(RP-HPLC)
background interaction energy in the chromatographic system very low compared to other separation techniques. This low background energy allows for distinguishing very small differences in molecular interactions of closely related analytes. Adsorbents employed in this mode of chromatography are porous rigid materials with hydrophobic surfaces. The majority of packing materials used in RP-HPLC are chemically modified porous silica.[5]
Adsorption chromatography
The analyte interact with solid stationary surface and are displaced with eluent for active sites on surface.
Ion exchange chromatography (IEC)
IEC is based on the differences in affinities of the analyte ions for the oppositely charged ionic center in the resin or adsorbed counter ions in the hydrophobic stationary phase. Consider the exchange of two ions A+
and B+
between the solution and exchange resin E−:
A·E + B+↔
B·E + A+
This essentially determines the relative affinity of both cations to the exchange centers on the surface. If the constant is equal to 1, no discriminating ability is expected for this system.Four major types of ion-exchange centers are usually employed [6]:
•SO3-—strong cation-exchanger
•CO2-—weak cation-exchanger
•Quaternary amine—strong anion-exchanger •Tertiary amine—weak anion-exchanger
Analyte retention and selectivity in ion exchange chromatography are strongly dependent on the pH and ionic strength of the mobile phase.
Size exclusion chromatography (SEC):
space of packing material due to their steric hindrance. Hydrodynamic radius of the analyte molecule is the main factor in determining its retention. This is the only chromatographic separation method where any positive interaction of the analyte with the stationary phase should be avoided.
INSTRUMENTATION OF HPLC
HPLC is a special branch of Column Chromatography in which the mobile phase is forced through the column at high speed. As a result, the analysis time is reduced by 1-2 orders of magnitude relative to classical Column chromatography and the use of much smaller particles of the absorbent or support becomes possible increasing the column efficiency substantially[7]
. The basic HPLC Instrumentation is shown in the Fig. No. 1.1
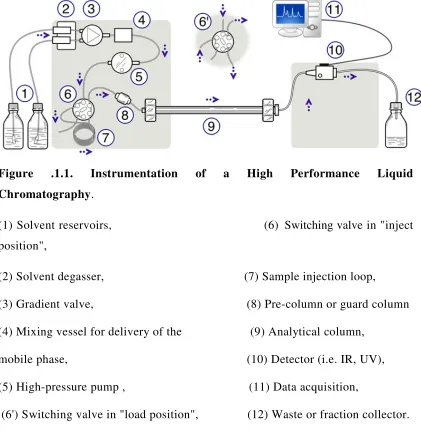
Figure .1.1. Instrumentation of a High Performance Liquid
Chromatography.
(1) Solvent reservoirs, (6) Switching valve in "inject
position",
(2) Solvent degasser, (7) Sample injection loop,
(3) Gradient valve, (8) Pre-column or guard column
(4) Mixing vessel for delivery of the (9) Analytical column,
mobile phase, (10) Detector (i.e. IR, UV),
(5) High-pressure pump , (11) Data acquisition,
[image:14.595.110.531.277.708.2]i.Solvent delivery system:
The most important component of HPLC in solvent delivery system is the pump, because its performance directly effects the retention time, reproducibility and detector sensitivity. Among the several solvent delivery systems, (direct gas pressure, pneumatic intensifier, reciprocating etc.) reciprocating pump with twin or triple pistons is widely used, as this system gives less baseline noise, good flow rate reproducibility etc.
The pumping systems used in HPLC can be categorized in three different ways.
The first classification is according to the eluent flow rate that the pump is capable of delivering: Standard bore systems, Micro bore systems
The second classification is according to the construction materials : Metallic, non-metallic
The final classification is according to the mechanism by which the
pump delivers the eluent : syringe pumps and reciprocating-piston pump.
ii.Solvent degassing system
The constituents of the mobile phase should be degassed and filtered before use. Several methods can be applied to remove the dissolved gases in the mobile phase. They include
heating and stirring,
filtration through 0.45µm filters,
vacuum degassing with an air-soluble membrane,
Helium purging ultra signification or purging or combination of these
methods.
HPLC systems are also provided an online degassing system which
continuously removes the dissolved gases from the mobile phase.[8]
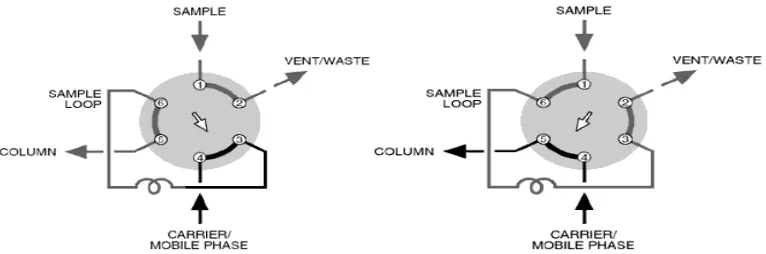
Two means for analyte introduction on the column are injection into a flowing stream and a stop flow injection. These techniques can be used with a syringe or an injection valve. Automatic injector is a microprocessor-controlled version of the manual universal injector.
Injector
Injectors should provide the possibility of injecting the liquid sample within the range of 0.1 to 100 ml of volume with high reproducibility and under high pressure (up to the 4000 psi). They should also produce minimum band broadening and minimize possible flow disturbances. The most useful and widely used sampling device for modern LC is the micro sampling injector valve. With these sampling valves, samples can be introduced reproducibly into pressurized columns without significant interruption of flow even at elevated temperatures.[9]
LOAD (the sample loop) INJECT (move the
sample loop
[image:16.595.110.493.406.533.2]In the mobile phase
Fig. No.1.2 .Injection system
iv.Columns
common packing material and mobile phases depends on the physical properties of the drug.[9]
The following properties of the column stationary phases play an important role in giving different selectivity for separations.
i) Particle size, ii) Particle shape, iii) Pore size / Pore volume, iv) Specific surface area, v) End capping, vi) % carbon loading.
The following are the most widely used columns with stationary phases for separation and quantification of wide variety of drugs.
i). Silica based columns with different bonding phases like C4, C6, C8, C18, C20 and bonding phases having functional groups like cyano, phenyl, naphthyl and amino.
ii). Silica based columns with polar embedded phases within chains of C8, C18, NH2.
iii). Strong cation exchange (SCX) and strong anion exchange (SAX) columns. iv). Size Exclusion chromtography (SEC) or gel permeation chromatography (GPC) columns.
v). Silica based monolith columns.
vi). Fused core silica columns with bonding phases like C8, C18, CN, phenyl.
vii). Metal oxide columns like zirconia based and alumina based. viii). Chiral columns.
Column-packing materials
Silica (SiO2.X H2O) is the most widely used substance for the manufacture of
packing materials it consist of a network of siloxane linkages(Si-O-Si) in a rigid three dimensional structure containing inter connected pores.[10]
from 100 to 800 m2
/g and particle sizes from 3 to 50 µm. The silonol groups on the surface of silica give it a polar character, which is exploited in adsorption chromatography using non-polar organic elutents. Silica can be drastically altered by reaction with organochlorosilanes or organoalkoxysilanes giving Si-O-Si-R linkages with the surface. The attachment of hydrocarbon chain to silica produces a non polar surface suitable for reversed phase chromatography where mixtures of water and organic solvents are used as eluents. The most popular material is octa decyl silica (ODS) which contains C18chains, but
material with C2, C6, C8 and C22 chains are also available.
The most popular brands of LC columns
:
Inertsil, Hypersil, X-terra, X-bridge, Sun-fire, Atlantis, Aquity-BEH, Zorbax, Lichrosphere, Purosphere, Sperisorb, Luna, Kromasil, ACE, YMC, Symmetry, Chiralcel and Chiralpak.
The LC columns are supplied in different dimensions:
Column lengths - 10 mm, 50 mm, 100mm, 150mm, 250mm, 300mm, 500mm and Internal diameters -2.1mm, 3.0mm, 4.0mm, 4.6mm.
LC columns with stationary phases having different particle sizes like 5.0 µm, 4.0 µm 3.5 µm, 3.0 µm, 2.5 µm, 2.0 µm, 1.9 µm, 1.8 µm, 1.7 µm and 1.3 µm are available.
V.Mobile phase
Mobile phases used for HPLC are typically mixtures of organic solvents and water or aqueous buffers.
The following points should also be considered when choosing a mobile phase:
It is essential to establish that the drug is stable in the mobile phase for at least the duration of the analysis.
Reduce cost and toxicity of the mobile phase by using methanol instead of acetonitrile whenever possible.
Minimize the absorbance of buffer. Since trifluroacetic acid or formic acid absorb at shorter wavelengths. They may prevent detection of products without chromophores above 220 nm. Carboxylic acid modifiers can be frequently replaced by phosphoric acid which does not absorb above 200 nm.[11]
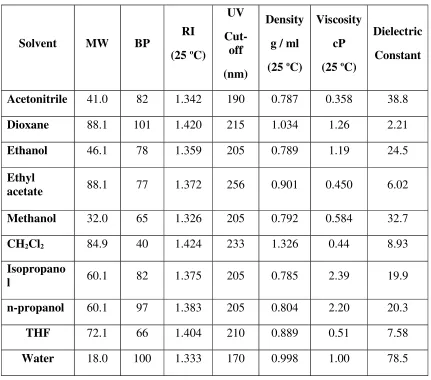
[image:19.595.101.532.291.671.2]
Physical properties of some HPLC solvents were summarized in Table: 1.4
Table No. 1.4. Physical properties of common HPLC solvents
Solvent MW BP
RI
(25 o
C) UV Cut-off (nm) Density
g / ml
(25 o
C)
Viscosity
cP
(25 o
C)
Dielectric
Constant
Acetonitrile 41.0 82 1.342 190 0.787 0.358 38.8
Dioxane 88.1 101 1.420 215 1.034 1.26 2.21
Ethanol 46.1 78 1.359 205 0.789 1.19 24.5
Ethyl
acetate 88.1 77 1.372 256 0.901 0.450 6.02
Methanol 32.0 65 1.326 205 0.792 0.584 32.7
CH2Cl2 84.9 40 1.424 233 1.326 0.44 8.93
Isopropano
l 60.1 82 1.375 205 0.785 2.39 19.9
n-propanol 60.1 97 1.383 205 0.804 2.20 20.3
THF 72.1 66 1.404 210 0.889 0.51 7.58
Water 18.0 100 1.333 170 0.998 1.00 78.5
Vi. Detectors
solvents. The most selective wavelength for detecting a drug is frequently the longest ⋋max to avoid interference from solvents, buffers and excipients. Other
methods of detection can be useful are required in some instances.
•Solute specific detectors (UV-Vis, fluorescence, infra-red, radio activity) •Bulk property detectors (refractive index, viscometer, conductivity) •Desolvation detectors (flame ionization etc.)
•LC-MS detectors •Reaction detectors
Applications of HPLC in pharmaceutical research :
• Separation: This can be accomplished using HPLC by utilizing the fact that, certain compounds have different migration rates given a particular column and mobile phase. The extent or degree of separation is determined by the choice of stationary phase and mobile phase along with parameters like flow, temperature and gradient programme.
• Identification: For this purpose a clean peak of known sample has to be observed from the chromatogram. Selection of column mobile phase and flow rate matter to certain level in this process. Identification is generally by comparing with reference compound based on retention time and also based on UV-Vis spectra in some cases. Identification can be assured by combining two or more detection methods, where necessary.
• Quantification: Analyte concentrations are estimated by measuring the responses (peak areas) known reference standards followed by unknown samples. Quantification of known and unknown components are done by various methods like - area normalization method, internal standard method, external standard method and diluted standard method along with relative response factors.
buffers and solvents are preferred choice as mobile phases as it reduces the effort on purification. Solute purity and throughput is the key challenge in isolation and purification processes.
HPLC theory:
The theory of chromatography has been used as the basis for system- suitability tests, which are set of quantitative criteria that test the suitability of the chromatographic system to identify and quantify drug related samples by HPLC at any step of the pharmaceutical analysis.
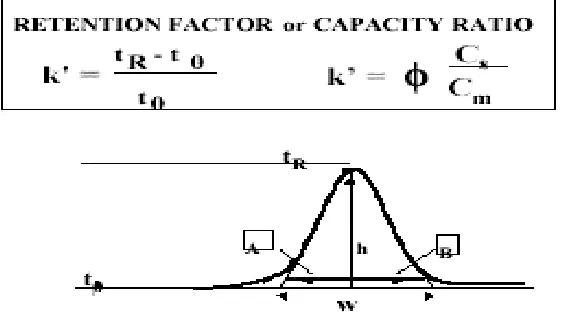
Retention time (tR), capacity factor k' and relative retention time (RRT)
The time elapsed between the injection of the sample components into the column and their detection is known as the retention time (tR). The retention
time is longer when the solute has higher affinity to the stationary phase due to its chemical nature. For example, in reverse phase chromatography, the more lyophilised compounds are retained longer. Therefore, the retention time is a property of the analyte that can be used for its identification. A non retained substance passes through the column at a time t0, called the void time.
[image:21.595.169.450.461.627.2]Retention factor is calculated as follows:
Fig. No.1.3. Figure showing retention factor
concentration at the mobile phase and phi is the ratio of the stationary and mobile phase volumes all within the chromatographic band. The Retention Factor is used to compare the retention of a solute between two chromatographic systems, normalizing it to the column's geometry and system flow rate. The retention factor value should be in between 1-20.[11]
Efficiency: Plate count N and peak capacity Pc:
The efficiency of the separation is determined by the plate count N when working at isocratic conditions, whereas it is usually measured by Peak Capacity Pc when working at gradient conditions. The following equation for
[image:22.595.156.474.376.486.2]the plate count is used by the United States Pharmacopoeia (USP) to calculate N:
Fig. No.1.4. Figure showing Number of Theoretical Plates
Where w is measured from the baseline peak width calculated using lines tangent to the peak width at 50 % height. European and Japanese pharmacopoeias use the peak width at 50% of the peak height, hence the equation becomes:
Peak capacity Pc is defined as number of peaks that can be separated within a
Where n is the number of peaks at the segment of the gradient selected for the calculation, tg. Thus peak capacity can be simply the gradient run time divided
by the average peak width. The sharper the peaks the higher is the peak capacity, hence the system should be able to resolve more peaks at the selected run time as well as detect lower concentrations.
Another measure of the column's chromatographic efficiency is the height equivalent to theoretical plate (HETP) which is calculated from the following equation:
HETP = (L/N)
Where L is column length and N is the plate count. HETP is measured in micrometer.
The behaviour of HETP as function of linear velocity has been described by various equations. It is frequently called "The Van-Deemter curve", and it is frequently used to describe and characterize various chromatographic stationary phases' performance and compare them to each other. The lower are the values of HETP, the more efficient is the chromatographic system, enabling the detection of lower concentrations due to the enhanced signal-to-noise ratio of all the peaks in the chromatogram.
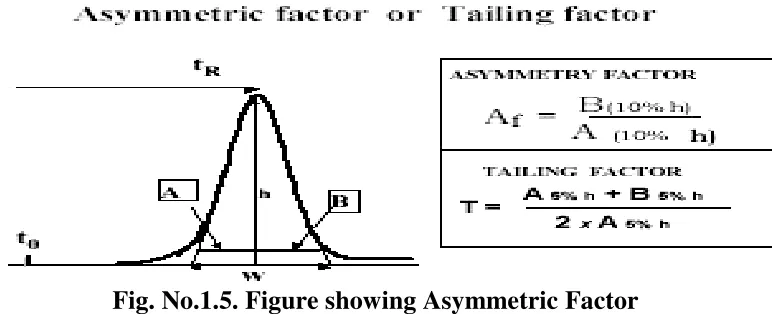
Peak asymmetry factor Af and tailing factor T:
integrity of the peak's integration, reducing the accuracy of the quantitation. This is the reason why USP Tailing is a peak's parameter almost always measured in the system suitability step of the analysis.[12]
The deviation from symmetry is measured by the asymmetry factor, Af or
tailing factor T. The calculation of asymmetry factor, Af is described by
[image:24.595.137.523.211.368.2]the following equation:
Fig. No.1.5. Figure showing Asymmetric Factor
Where A and B are sections in the horizontal line parallel to the baseline, drawn at 10% of the peak height. The calculation of tailing Factor, T, which is more widely used in the pharmaceutical industry, as suggested by the pharmacopeia’s, where A and B are sections in the horizontal line parallel to the baseline, drawn at 5% of the peak height. The USP suggests that tailing factor should be in the range of 0.5 up to 2 to assure a precise and accurate quantitative measurement.
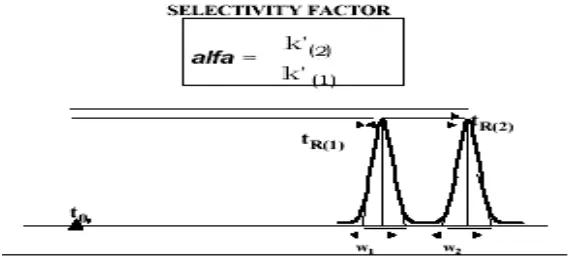
Selectivity Factor Alfa and Resolution Factor Rs:
resolution factor, Rs, accounts for the difference between the retention times of the two peaks relative to their width
Fig. No.1.6. Figure showing Resolution Factor
The equation that describes the experimental measurement of the resolution factor, Rs, is as follows: Rs = ∆tR / 0.5 (W1 + W2)
Where tR is the retention time of peaks 1 and 2 respectively and w is their
respective peak width at the tangents baseline. According to the pharmacopeia value should be above 1.5 for an accurate quantitative measurement.
[image:25.595.172.456.473.604.2]
Fig. No.1.7. Figure showing selectivity
decades of HPLC. This is also the rational behind the recent trend in HPLC, the use of sub 2 micron particle columns and the development of a specially design of ultra performance HPLC systems to accommodate such columns.[12]
1.4..ANALYTICAL METHOD DEVELOPMENT
Methods are developed for new products when no official methods are available. Alternate methods for existing (Non-Pharmacopoeias) products are developed to reduce the cost and time for better precision and ruggedness. Trial runs are conducted, method is optimized and validated. When alternate method proposed is intended to replace the existing procedure, comparative laboratory data including merits / demerits should be made available
Steps involved in method development
Documentation starts at the very beginning of the development process.
1. Analyte standard characterization
a) All known information about the analyte and its structure is collected i.e., physical and chemical properties.
b) The standard analyte (100 % purity) is obtained. Necessary arrangement is made for the proper storage (refrigerator, desiccators and freezer).
c) When multiple components are to be analyzed in the sample matrix, the number of components is noted, data is assembled and the availability of standards for each one is determined.
d) Only those methods (spectroscopic, MS, GC, HPLC etc.,) that are compatible with sample stability are considered.
2. Method requirements
3. Literature search and prior methodology
The literature for all types of information related to the analyte is surveyed. solubility profile (solubility of Drug in different solvents and at different pH conditions), analytical profile (Physico-chemical properties, Eg: pKa, melting point, degradation pathways, etc) and stability profile (sensitivity of the drug towards light, heat, moisture etc) and relevant analytical methods, books, periodicals, chemical manufacturers and regulatory agency compendia such as USP / NF, are reviewed.
4. Choosing a method
a) Using the information in the literatures and prints, methodology is adopted. The methods are modified wherever necessary. Sometimes it is necessary to acquire additional instrumentation to reproduce, modify, improve or validate existing methods for in-house analytes and samples.
b) If there are no prior methods for the analyte in the literature, from analogy, the compounds that are similar in structure and chemical properties are investigated and are worked out. There is usually one compound for which analytical method already exist that is similar to the analyte of interest.
c) 5. Instrumental setup and initial studies
6. Optimization
During optimization one parameter is changed at a time and set of conditions
are isolated, rather than using a trial and error approach. Work has been done
from an organized methodical plan, and every step is documented (in a lab
notebook) in case of dead ends. Table No.1.5-variables for improving
separation
Variable Comment
Choice of organic solvent A change from Methanol to Acetonitrile or THF often results in large changes in separation .
Mobile phase pH A Change in pH may result in a major effect on band spacing for samples that contain ionic or
ionisable compounds.
Solvent strength A change in percent organic often provides significant changes in retention and separation.
Column type This refers to the choice of bonded-phases for reversed-phase LC (C 18, C 8,Phenyl,cyano etc)
Concentration of mobile phase additives
The most common additives for varying band spacing include amine modifiers, acid modifiers,
buffers and salts.
Temperature The temperature can be varied between 0 to 70ºC for the purpose of controlling band spacing; however, temperatures of 25-60 ºC are more
common.
The originally determined analytical figures of merit are limit of quantitation (LOQ), limit of detection (LOD), linearity, time per analysis, cost, sample preparation etc., are documented.
8. Evaluation of method development with actual samples
The sample solution should lead to unequivocal, absolute identification of the analyte peak of interest apart from all other matrix components.
9.Determination of percent recovery of actual sample and demonstration of quantitative sample analysis
Percent recovery of spiked, authentic standard analyte into a sample matrix that is shown to contain no analyte is determined. Reproducibility of recovery (average + / - standard deviation) from sample to sample and whether recovery has been optimized or not has been shown. It is not necessary to obtain 100 % recovery as long as the results are reproducible and known with a high degree of certainty. The validity of analytical method can be verified only by laboratory studies. [13]
Table No.1.6.Separation goals in HPLC method development
Goal Comment
Resolution Precise and rugged quantitative analysis requires that Rs be
greater than 1.5.
Separation time <5-10 min is desirable for routine procedures.
Quantitation £2% for assays; £5% for less-demanding analyses ;
15% for trace analyses.
Pressure <150 bar is desirable, <200 bar is usually essential (new column assumed).
Peak height Narrow peaks are desirable for large signal/noise ratios.
METHOD DEVELOPMENT PROCEDURE
The wide variety of equipment’s, columns, eluent and operation preparations involved high performance liquid chromatography (HPLC) method development seems complex. The processes influenced by the nature of analytes and generally follow the following steps. [14]
Steps:
• Step 1 - Selection of the HPLC method and initial system • Step 2 - Selection of initial conditions
• Step 3 - Selectivity optimization
• Step 4 - System optimization
• Step 5 - Method validation.
HPLC method development
Step 1 - selection of the HPLC method and initial system.
When developing an HPLC method, the first step is always to consult the literature to ascertain whether the separation has been previously performed and if so, under what conditions - this will save time doing unnecessary experimental work. When selecting an HPLC system, it must have a high probability of actually being able to analyse the sample; for example, if the sample includes polar analytes then reverse phase HPLC would offer both adequate retention and resolution, whereas normal phase HPLC would be much less feasible. Consideration must be given to the following:
Sample preparation:
Is chemical derivatization required to assist detection sensitivity or selectivity
Column dimensions:
For most samples (unless they are very complex), long columns (25 cm) are recommended to enhance the column efficiency. A flow rate of 1-1.5 ml/min should be used initially. packing particle size should be 3 or 5 µm.
Detectors:
Consideration must be given to the following:
• Do the analytes have chromophores to enable UV detection • Is more selective/sensitive detection required
• What detection limits are necessary
• Will the sample require chemical derivatization to enhance
detectability and/or improve the chromatography.
Fluorescence or electrochemical detectors should be used for trace analysis. For preparative HPLC, refractive index is preferred because it can handle high concentrations without over loading the detector. UV wavelength for the greatest sensitivity λmax should be used, which detects all sample
components that contain chromophores. UV wavelengths below 200 nm should be avoided because detector noise increases in this region. Higher wavelengths give greater selectivity. The excitation wavelength locates the excitation maximum; that is, the wavelength that gives the maximum emission intensity. The excitation is set to the maximum value then the emission is scanned to locate the emission intensity. Selection of the initial system could, therefore, be based on assessment of the nature of sample and analytes together with literature data, experience, expert system software and empirical approaches.
This step determines the optimum conditions to adequately retain all analytes; that is, ensures no analyte has a capacity factor of less than 0.5 (poor retention could result in peak overlapping) and no analyte has a capacity factor greater than 10–15 (excessive retention leads to long analysis time and broad peaks with poor detectability). Selection of the following is then required. Mobile phase solvent strength:
The solvent strength is a measure of its ability to pull analytes from the column. It is generally controlled by the concentration of the solvent with the highest strength; for example, in reverse phase HPLC with aqueous mobile phases, the strong solvent would be the organic modifier; in normal phase HPLC, it would be the most polar one. The aim is to find the correct concentration of the strong solvent. With many samples, there will be a range of solvent strengths that can be used within the a fore mentioned capacity limits. Other factors (such as pH and the presence of ion pairing reagents) may also affect the overall retention of analytes.
Step 3 - selectivity optimization:
The aim of this step is to achieve adequate selectivity (peak spacing). The mobile phase and stationary phase compositions need to be taken into account. To minimize the number of trial chromatograms involved, only the parameters that are likely to have a significant effect on selectivity in the optimization must be examined. To select these, the nature of the analytes must be considered. Once the analyte types are identified, the relevant optimization parameters may be selected. Note that the optimization of mobile phase parameters is always considered first as this is much easier and convenient than stationary phase optimization.
Step 4 - system parameter optimization:
include column dimensions, column-packing particle size and flow rate. These parameters may be changed without affecting capacity factors or selectivity. Step 5 - Method validation:
Proper validation of analytical methods is important for pharmaceutical analysis when ensure of the continuing efficacy and safety of each batch manufactured relies solely on the determination of quality. The ability to control this quality is dependent upon the ability of the analytical methods, as applied under well-defined conditions and at an established level of sensitivity, to give a reliable demonstration of all deviation from target criteria.
Analytical methods should be used within good manufacturing practice (GMP) and good laboratory practice (GLP) environments, and must be developed using the protocols set out in the international conference on harmonization (ICH) guidelines (Q2A and Q2B). The US food and drug administration (FDA) and US Pharmacopoeia (USP) both refer to ICH guidelines. The most widely applied validation characteristics are accuracy, precision (repeatability and intermediate precision), specificity, detection limit, quantitation limit, linearity, range, robustness and stability of analytical solutions. Method validation must have a written and approved protocol prior to use.[14]
1.5.ANALYTICAL METHOD VALIDATION
Method validation can be defined as (ICH)
“Establishing documented evidence, which provides a high degree of assurance that a specific activity will consistently produce a desired result or product meeting its predetermined specifications and quality characteristics”.
1.System Suitability
Prior to the analysis of samples of each day, the operator must establish that the HPLC system and procedure are capable of providing data of acceptable quality. This is accomplished with system suitability experiments, which can be defined as tests to ensure that the method can generate results of acceptable accuracy and Precision. The requirements for system suitability are usually developed after method development and validation have been completed.[15]
Table.No.1.7.System Suitability Parameters and Recommendations
PARAMETER RECOMMENDATION
Capacity Factor (k’) The peak should be well-resolved from other peaks and the void volume,
generally k’>2.0
Repeatability RSD </= 1% for N >/= 5 is desirable. Resolution (Rs) Rs of > 2 between the peak of interest and
the closest eluting Potential interferent (impurity, excipient, degradation product,
internal standard) Theoretical Plates (N) In general should be > 2000
Tailing Factor (T) T of </= 2
2. Linearity
The linearity of a method is a measure of how well a calibration plot of response vs. concentration approximates a straight line. Linearity can be assessed by performing single measurements at several analyte concentrations. The data is then processed using a linear least-squares regression. The resulting plot slope, intercept and correlation coefficient provide the desired information on linearity.
The range is the interval between the upper and lower levels of the analytical method that have been demonstrated to obtain acceptable level of precision, accuracy and linearity.
Table.No.1.8. Range for the Analytical procedures
Analytical Procedure Range
Assay of a drug substance or a finished product
80 to 120 % of the test concentration
Impurity(quantification) Reporting threshold to 120% of Acceptance criteria Assay and Impurity One test with 100% standard
Linearity: Reporting threshold to 120% assay Acceptance criteria content uniformity 70 to 130 %of the test concentration
dissolution testing +/-20 % over the specified range
Drug release testing 20% after 1 hour upto 90% after 24 hours
0-110% of label claim
4. Precision
Precision can be defined as “The degree of agreement among individual test results when the procedure is applied repeatedly to multiple samplings of a homogenous sample”. A more comprehensive definition proposed by the International Conference on Harmonization (ICH) divides precision into three types:
1. Repeatability
2. Intermediate precision and 3. Reproducibility
Intermediate precision is the agreement of complete measurements (including standards) when the same method is applied many times within the same laboratory.
Reproducibility examines the precision between laboratories and is often determined in collaborative studies or method transfer experiments.
5. Accuracy
The accuracy of a measurement is defined as the closeness of the measured value to the true value. In a method with high accuracy, a sample (whose “true value” is known) is analyzed and the measured value is identical to the true value. Typically, accuracy is represented and determined by recovery studies. There are three ways to determine accuracy:
1. Comparison to a reference standard
2. Recovery of the analyte spiked into blank matrix or 3. Standard addition of the analyte.[15]
It should be clear how the individual or total impurities are to be determined. e.g.,Weight / weight or area percent in all cases with respect to the major analyte.
6. Specificity / selectivity
7. Robustness
The concept of robustness of an analytical procedure has been defined by the ICH as “a measure of its capacity to remain unaffected by small, but deliberate variations in method parameters”. A good practice is to vary important parameters in the method systematically and measure their effect on separation. The variable method parameters in HPLC technique may involves flow rate, column temperature, sample temperature, pH and mobile phase composition.
8. Limit of detection
Limit of detection (LOD) is the lowest concentration of analyte in a sample that can be detected, but not necessarily quantitated, under the stated experimental conditions. Several approaches for determining the LOD are possible, depending on whether the procedure is a non-instrumental or instrumental.
•Based on visual evaluation
•Based on signal-to-noise
•Based on the standard deviation of the response and the slope
The LOD may be expressed as:
LOD = 3.3 σ / S
Where,
σ = Standard deviation of Intercepts of calibration curves
S = Mean of slopes of the calibration curves
The slope S may be estimated from the calibration curve of the analyte.
Limit of quantitation (LOQ) is the lowest concentration of analyte in a sample that can be determined with acceptable precision and accuracy under the stated experimental conditions. Several approaches for determining the LOQ are possible depending on whether the procedure is a non-instrumental or instrumental.
•Based on visual evaluation
•Based on signal-to-noise Approach
•Based on the standard deviation of the response and the slope
The LOQ may be expressed as:
LOQ = 10 σ / S
Where,
σ = Standard deviation of Intercepts of calibration curves
S = Mean of slopes of the calibration curves
[image:38.595.106.532.493.622.2]The slope S may be estimated from the calibration curve of the analyte.[16]
Table.No.1.9. Acceptance criteria of validation for HPLC S.No Characteristics Acceptance criteria
1 Specificity No interference
2 Accuracy 98-102%
3 Precision RSD<2
4 Detection limit S/N > 2or 3
5 Quantitation limit S/N > 10
6 Linearity R2
> 0.999
7 Range 80-120%
10. Stability
standard and sample solution stability can be required even for short (10 min) separation. When more than one sample is analyzed (multiple lots of one sample or samples from different storage conditions from a single lot),
automated, overnight runs often are performed for better lab efficiency. Such practices add requirements for greater solution stability.
Degradation studies:
Degradation studies or stress testing is conducted in order to investigate the likely degradation products, which in turn helps to establish the degradation pathways and the intrinsic stability of the drug molecule and also to provide foundation for developing a suitable stability indicating method. Stress testing the drug molecule under particular stress condition generate samples containing degradation products. Use these samples to develop suitable analytical methods. The degradation products generated in the stressed samples are termed as “potential” degradation products that may or may not be formed under relevant storage conditions. Stress drug product, and placebo separately to understand the peaks due to placebo components, if any. Four major forced degradation studies are [17]
2. LITERATURE REVIEW
2.1. Drug Profile
NELARABINE:-Chemical structure
:
Fig no. 2.1. Structure of Nelarabine
IUPAC name :
Molecular Formula : C11H15N5O5
Molecular Weight : 297.267
CAS number : 121032-29-9
General
properties:-Colour : White powder
State : Crystalline powder
Solubility : Slightly soluble to soluble in water,
soluble in
methanol.
Melting point : 209-2170
C
Dosage form : Injection
Stability : Nelarabine Injection is stable in
polyvinyl- chloride (PVC) infusion bags and glass containers for 8 hours
up to 30° C
Category : Antineoplastic agent.Used in treatment
of T-cell acute lymphoblastic leukemia.
Brand names : Arranon (Glaxosmithkline), Atriance Official : Not official in any Pharmacopoeias
Mechanism of action : Nelarabine is a pro-drug of the
deoxyguanosine analogue 9-β-D-arabinofuranosylguanine (ara-G).
Nelarabine is demethylated by adenosine deaminase (ADA) to ara-G,
mono-phosphorylated by deoxyguanosine kinase and deoxycytidine
ara-GTP. Accumulation of ara-GTP in leukemic blasts allows for
incorporation into deoxyribonucleic acid (DNA), leading to inhibition of
DNA synthesis and cell death. Other mechanisms may contribute to the
cytotoxic and systemic toxicity of nelarabine.
Side effects : Nelarabine may cause serious side effects of the central
nervous system.[18]
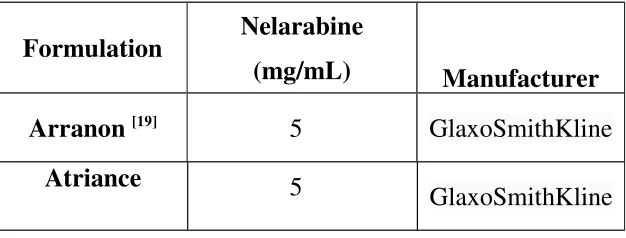
[image:42.595.160.473.352.471.2]Formulation :
Table no. 2.1.Various brands of the formulation
Formulation Nelarabine
(mg/mL) Manufacturer
Arranon [19]
5 GlaxoSmithKline
Atriance 5
GlaxoSmithKline
Huang Qiaoqiao et al.,(2012) established a nonaqueous titration method for the determination of Nelarabine using 0.1 mol/L perchloric acid as titrant. Effect of different solvents and indicators on the titration endpoint was compared in this paper. Using acetic acid as solvent and determining the endpoint potentiometrically 5 times, the average content of Nelarabine was found to be 99.8%(RSD=0.22%). The method is simple and precise,and can be used to determine the content of Nelarabine in APIs.[20]
Yoshiyuki Minamide1,Minamide, et al.,(2012)developed a highly sensitive liquid chromatography tandem mass spectrometry (LC-MS/MS) method for quantitation of arabinofuranosyl guanosine 5’-triphosphate (ara-GTP) in human peripheral blood mononuclear cells (PBMC) and validated using a standard addition method with the human Tlymphoblastoid cell line as an alternative blank matrix. Ara-GTP was extracted with methanol/250 mmol/L ammonium carbonate solution (7/3, v/v) from the cells at a density of 106 cells per 0.5 mL. Extracts were subjected to LC-MS/ MS using a TurboIon spray interface and selected reaction monitoring with the transitions of m/z 524 to m/z 152 for quantitation. Endogenous guanosine triphosphate in the extract was used as an internal standard. Separation of the analytes was achieved on a porous graphitic carbon column (100 mm length × 2.1 mm i.d., 5 µm particle size) by isocratic elution with 250 mmol/L ammonium carbonate buffer (pH 9.5)/water/acetonitrile (40/51.5/8.5, v/v/v) at a flow rate of 0.2 mL/min. The method was validated in the range of 2–250 pg/mL. The pharmacokinetic profile of ara-GTP in PBMC in a Phase I clinical study of nelarabine in relapsed or refractory T-ALL/T-LBL patients was successfully determined using this method.[21]
phase consisted of 80% 0.01 M potassium dihydrogen phosphate (pH 6.8) solution and 20% methanol.The flow rate was set at 1.0 mL/minute, with an injection volume of 10 µL. The detection wavelength was set at 265 nm. The stability tests revealed that nelarabine infusion solutions are physico-chemically stable for a minimum of four weeks. Nelarabine concentrations remained at a level of > 95% of the initial concentration independent of the storage conditions.[22]
N.Y.Sreedhar, C.Nageswara Reddy (2011) developed a robust, highly reliable and reproducible adsorptive stripping voltammetric procedure for the determination of nelarabine in pharmaceutical formulations and urine samples. The analytical procedure was based on the reduction of the >C=N- of the pyrozole ring of the drug molecule at the hanging mercury drop electrode(HMDE) surface in Universal buffer of pH 6.0. The optimal experimental parameters for the drug assay were, accumulation potential -0.78V (vs. Ag/AgCl), accumulation time 60sec,pulse amplitude 25mV and scan rate 40mV s-1
in universal buffer (pH.6.0).The linear concentration range of application was 1.0×10⁻² to 1.0×10⁻⁷ M of nelarabine, with a relative standard deviation of 1.3% and a detection limit of 1.0×10⁻⁷
M. The method was successfully applied to the determination of nelarabine in human urine and pharmaceutical formulations.[23]
Ara-GTP was clearly separated from other nucleotides by using an anion-exchange
column DEAE 2 SW(250×4.6mm) and it was quantitated by its peak area. The standard curve was linear with % CV less than 10 and a sensitive detection
limit (10 pmol). This study was the first to evaluate the potential of ara-G
against ATL cells.[24]
Berg SL, Brueckner C, Nuchtern JG, Dauser R, McGuffey L, Blaney SM (2007) studied Plasma and cerebrospinal fluid pharmacokinetics of nelarabine in nonhuman primates using LC-MS method. Nelarabine (35 mg/kg, approximately 700 mg/m2) was administered over 1 h through a surgically implanted central venous catheter to four nonhuman primates. Blood (four animals) and ventricular CSF (three animals) samples were obtained at intervals for 24 h for determination of nelarabine concentrations, which were measured by HPLC-mass spectrometry. The nelarabine plasma AUC (median+/-s.d.) was 2,820+/-1,140 microM min and the ara-G plasma AUC was 20,000+/-8,100 microM min. The terminal half-life of nelarabine in plasma was 25+/-5.2 min and clearance was 42+/-61 ml/min/kg. The excellent CSF penetration of nelarabine and ara-G supports further study of the contribution of nelarabine to the prevention and treatment of CNS leukemia.[25]
Carlos O. Rodriguez Jr., and William Plunkett et al.,(2000) developed a gradient anion-exchange high-performance liquid chromatographic assay for the simultaneous determination and quantitation of the cytotoxic triphosphates of arabinosylguanine (ara-GTP) and fludarabine (F-ara-ATP). To assess the clinical utility, perchloric acid extracts of circulating human leukemia cells isolated from patients treated with fludarabine and nelarabine were analyzed. Samples were eluted gradiently using 60% 0.005 M NH4 H2 PO4 (pH 2.8) and 40% 0.75 MNH4 H2 PO 4 (pH 3.6) at a constant flow-rate of 1.5 ml/min, in 10-SAX Partisil anion-exchange column (4.6×250 mm, Whatman, Clifton,
and combinations of nelarabine and fludarabine, and for correlating the therapeutic efficacy and levels of the cytotoxic triphosphates in target cells.[26]
2.3. RESEARCH ENVISAGED
From the literature survey it is clear that only one RP-HPLC method have been reported so far for Nelarabine in commercially available formulation. Very few methods have been reported in determination of arabinosyl guanine triphosphate, active form of nelarabine present in biological fluids. Hence an attempt has made to develop a RP-HPLC method for the estimation of Nelarabine in bulk and pharmaceutical dosage form.
3.1. PLAN OF WORK
The experimental work has been planned as follows
STEP
1-• Study of physico-chemical properties of drug (pH, pka, solubility, and
molecular weight)
• Preparation of drug standard and sample solution • Selection of stationary phase
• Selection of mobile phase • Preparation of solutions
• Developing simple, rapid and specific RP-HPLC method for the
quantitative estimation of Nelarabine in the dosage form. • Optimizing the chromatographic conditions
STEP 2-To validate the newly developed method in accordance with the
analytical validation parameters mentioned as ICH guidelines(Q2B) Selectivity/specificity
Linearity and range Accuracy
Precision (repeatability and reproducibility) Limit of detection (LOD)
Limit of quantification (LOQ) Robustness
Forced degradation studies
3.2 Materials and Methods
3.2.1 Chemicals and standards used
Table.No.3.1. List of Chemicals
and standards usedS.NO Chemicals/reagents Grade
Manufacturer
1 Methanol GR Merck
2 Acetonitrile GR Merck
3 Purified water Milli-Q NA
4 Trifluoroacetic acid GR Merck
3.2.2 Equipment used during assay development
S. No. Name Manufacturer 1. HPLC(empower-2software) Aliance waters(2489)
2. HPLC detector UV/Visible detector
3. pH Meter Lab india
4. UV Spectrophotometer SHIMADZU
5. Micro Balance Mettle Toledo
6. Water Purifier Millipore
3.3. METHODOLOGY
3.3.1Assay method development:
The project work entitled as ‘Development and validation of stability indicating
RP-HPLC for estimation of Nelarabine in bulk and pharmaceutical dosage form’ was
carried out at Natco Pharma Limited, Kothur, Hyderabad.
A new RP-HPLC method was developed for the determination of nelarabine in i.v
infusion . The HPLC method was then validated to indicate that the analytical
procedure used is suitable for intended use by using various parameters like
specificity, linearity, precision, accuracy, system suitability.
3.3.1.1 Selection of initial conditions for Method Development:
Determination of absorption maxima by UV/Visible Spectroscopy:
Accurately weighed and transferred about 100mg of nelarabine working standard into
10 minutes to dissolve and diluted up to mark with methanol and mix well. Further
dilute 10ml ofthe above solution to 100ml with methanol and mix well. Finally dilute
10ml of above solution to 100ml with methanol. Final concentration of Nelarabine is
about 10 ppm.
The solution was scanned over a range of 200-400nm and a UV spectrum was
recorded. The best possible wavelength was chosen as 266nm.
3.4.METHOD DEVELOPMENT OF NELARABINE INFUSION BYRP-HPLC
The method was developed mainly basing on pka concept of drug and mobile phase
composition, flow rate,λmax, different columns and column temperature.Nelarabine has
two pka values that are 12.45 and 3.45. Generally pH of buffer solution should be
1 of pka value of drug. In this method pKavalue 3.45was selected because
in HPLC, solution may damage column with pH more than10. So pka12.45 of
Nelarabinewas eliminated. Then trials were performed by adjusting pH of buffer 1
ofpKa value 3.45 and also by changing mobile phase composition. Finally good peak
was obtained at pH 2.44 of buffer and retention time was also less compared to other
trials. So the method was optimized at these conditions.
Further validation study was performed as per ICH guidelines.
Trial- 1
Chromatographic conditions:
Mobile phase : 0.1% Trifluoroacetic acid and acetonitrile in the ratio 60:40v/v
Column : Cosmicsil Adze C18 column (150×4.6mm,5µm)
Flow rate : 1.0 ml/min
Detector wavelength : 266 nm
Column temperature : 300 C
Injection volume : 10 µL
Retention time : 5.97 min
Inference:An extra peak and peak tailing appeared
Trial-2
Chromatographic conditions:
Mobile phase : 0.1% Trifluoroacetic acid and acetonitrile in the ratio 60:40v/v
Column : Cosmicsil Adze C18 column (150×4.6mm,5µm)
Flow rate : 1.3 ml/min
Detector wavelength : 266 nm
Column temperature : 300 C
Injection volume : 10 µL
Run time : 8 min
Retention time : 5.77 min
Inference:Peak tailing appeared with improper baseline.
Trial-3
Chromatographic conditions:
Mobile phase :0.1% Trifluoroacetic acid and acetonitrile in the ratio 80:20v/v
Column : Cosmicsil Adze C18 column (150×4.6mm,5µm)
Flow rate : 1.3 ml/min
Detector wavelength : 266 nm
Column temperature : 300 C
Injection volume : 10 µL
Retention time : 5.42 min
Inference:peak tailing is obtained
Trial-4
Chromatographic conditions:
Mobile phase :0.01% Trifluoroacetic acid and acetonitrile in the ratio 60:40v/v
Column : Cosmicsil Adze C18 column (150×4.6mm,5µm)
Flow rate : 1.0 ml/min
Detector wavelength : 266 nm
Column temperature : 300 C
Injection volume : 10 µL
Run time : 8 min
Retention time : 5.775 min
Inference: Tailing factor is more than 2 and baseline disturbance appeared.
Trial-5
Chromatographic conditions:
Mobile phase :0.01% Trifluoroacetic acid and acetonitrile in the ratio 80:20v/v
Column : Cosmicsil Adze C18 column (150×4.6mm,5µm)
Flow rate : 1.0 ml/min
Detector wavelength : 266 nm
Column temperature : 300C
Injection volume : 10 µL
Run time : 8 min
Inference: Baseline is not proper
Trial-6
Optimized Chromatographic conditions:
Mobile phase : 0.01% Trifluoroacetic acid and acetonitrile in the ratio 85:15v/v
Column : Cosmicsil Adze C18 column (150×4.6mm,5µm)
Flow rate : 1.0 ml/min
Detector wavelength : 266 nm
Column temperature : 300
Injection volume : 10 µL
Run time : 8 min
Retention time : 3.83 min
Inference: Sharp peak was obtained at 3.83minutes.
3.4.1.Preparation of solutions:
Buffer Preparation:
100µL of Trifluoroacetic acid was transferred in to 1000mL of purified water and mixed well.Finally the solution was filtered through 0.45µm membrane filter and degassed.
Mobile phase
The buffer and acetonitrile were mixed in the ratio of 85:15 v/v respectively and degassed.
Diluent
Purified water was used as diluent.
Standard Preparation:
Accurately 20.0mg of Nelarabine working Standard was weighed and transferred into a 100 ml clean ,dry volumetric flask, and 60 ml of diluent was added and sonicated to dissolve. The solution was cooled to room temperature and diluted to volume with diluent. Then 1.0 ml of the above solution was transferred into 10 ml volumetric flask and diluted with mobile phase.
Sample preparation:
2mL of sample was transferred into 50 ml of clean, dry volumetric flask. About 20 ml of diluents was added and sonicated for 15 min with occasional shaking. The solution was cooled to room temperature and diluted to 20ml with diluent.Then 1.0 ml of above solution was transferred into 10 ml volumetric flask and diluted with mobile phase.
Where,
TA = peak area response due to Nelarabine from sample
SA = peak area response due to Nelarabine from standard
SW = Weight of Nelarabine working standard takenin mg
TW = weight of sample taken in mg
P = purity of Nelarabine working standard taken on as is basis
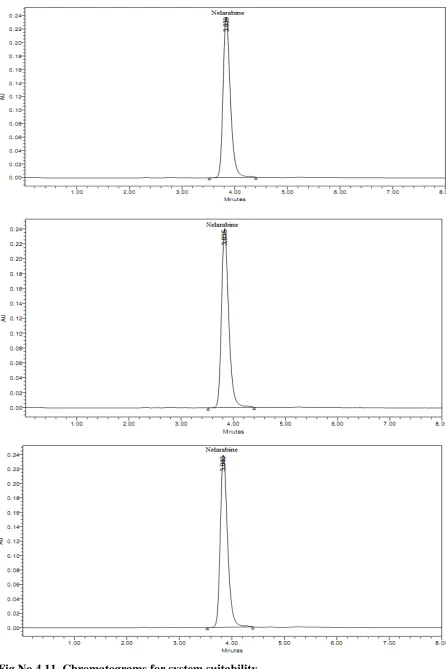
3.4.3.SYSTEM SUITABILITY:
Standard Preparation:
Weigh and transfer accurately 100 mg of Nelarabine working standard into a 100 ml clean, dry volumetric flask and add about 60 ml of diluent and sonicate to dissolve. Cool the solution to room temperature and dilute to volume with solvent mixture. Then transfer 10.0 ml above solution into 100 ml volumetric flask and dilute with mobile phase.A Standard solution was prepared by using Nelarabine working standard as per test method and was injected six timesinto the HPLC system.
Acceptance criteria:
%RSD for replicate injections of peak area response for Nelarabine peak from the standard preparation should be not more than 2.0.
The Tailing factor for Nelarabine peak should be not more than 2.0.
The number of Theoretical plates for Nelarabine peak should be not less than 2000
3.5. ANALYTICAL METHODVALIDATION
Validation was done for the developed method as per ICH Guidelines (Q2B).The method validation parameters for assay of Nelarabine include
Specificity Accuracy
Linearity and Range Precision
Repeatability
Intermediate precision (ruggedness) Detection Limit
Quantitation Limit Robustness
Specificity of the developed method was determined by injecting blank,3 replicates of working standard solution and 3 replicates of working sample solution containing 20µg/ml of Nelarabine.
3.5.2. LINEARITY AND RANGE:
Preparation of stock solution
Weigh and transfer accurately 100mg Nelarabine working standard into a 100 ml clean,dry volumetric flask and add about 60 ml of diluentand sonicated to dissolve. Cool the solution to room temperature and dilute to volume with diluent. Then transfer 10.0 ml of theabove solution into 100 ml volumetric flask and dilute with mobile phase.
Preparation of Level – I (20 µg/mL)
2.0ml of stock solution was taken in to 10ml of volumetric flask and dilute up to the mark with mobile phase.
Preparation of Level – II (40 µg/mL)
4.0ml of stock solution was taken in to 10ml of volumetric flask and dilute up to the mark with mobile phase.
Preparation of Level – III (60 µg/mL)
6.0ml of stock solution was taken in to 10ml of volumetric flask and dilute up to the mark with mobile phase.
Preparation of Level – IV (80 µg/mL)
8.0ml of stock solution was taken in to 10ml of volumetric flask and dilute up to the mark with mobile phase.
Preparation of Level – V (100 µg/mL)
10ml of stock solution was taken in to 10ml of volumetric flask
Procedure
Each level was injected into the chromatographic system and peak area was measured.Plot a graph of peak area versus concentration (on X-axis concentration and on Y-axis Peak area) and the correlation coefficient was calculated.
Acceptance Criteria
RANGE
Based on precision, linearity and accuracy data it can be concluded that the assay method is precise, linear and accurate in the range of 50-150% of Nelarabine.
3.5.3 ACCURACY
Preparation of stock solution:
Accurately weigh and transfer 10 mg of Nelarabine working standard into a 10 mL volumetric flask add about 7 mL of diluent and sonicate to dissolve it completely and make volume up to the mark with the same solvent. (Stock solution)
Preparation of 60 µg/ml solution:
Further pipette 0.6 ml of the above stock solution into a 10ml volumetric flask and dilute upto the mark with diluent. Mix well and filter through 0.45µm filter.
Preparation of Nelarabine sample solution:
For preparation of 50% solution (With respect to target Assay concentration):
1 mL of Nelarabine sample was taken into a 10 mL volumetric flask and about 7 mL of diluent was added.The resulted solution was sonicated and the volume was made to the mark with the same solvent. (Stock solution)
Pipette 0.6 ml of the above stock solution into a 10ml volumetric flask and dilute up to the mark with diluent. Mix well and filter through 0.45µm filter.
For preparation of 100% solution (With respect to target Assay
1 mL of Nelarabine sample was taken into a 10 mL volumetric flask and about 7 mL of diluent was added.The resulted solution was sonicated and the volume was made to the mark with the same solvent. (Stock solution)
Pipette 1.2 ml of the above stock solution into a 10ml volumetric flask and dilute up to the mark with diluent. Mix well and filter through 0.45µm filter. For preparation of 150% solution (With respect to target Assay concentration):
1 mL of Nelarabine sample was taken into a 10 mL volumetric flask and about 7 mL of diluent was added.The