Age specific patterns of growth and reproduction in tropical herbivorous fishes
338
0
0
Full text
(2) Age specific patterns of growth and reproduction in tropical herbivorous fishes. Thesis submitted by Dong Chun Lou BSc Hons (Shanghai) in June 1992. for the degree of Doctor of Philosophy in the Department of Marine Biology at James Cook University of North Queensland.
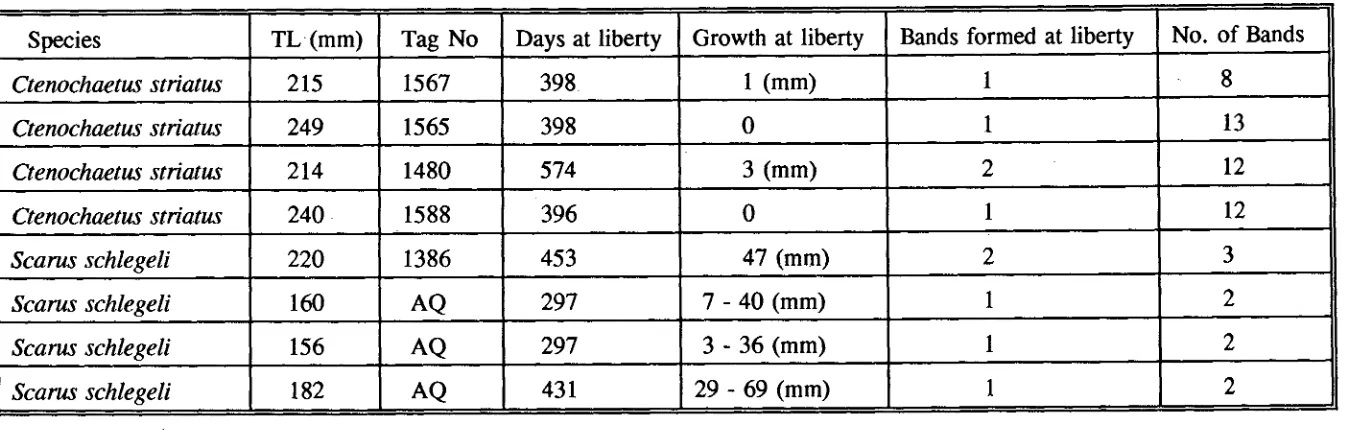
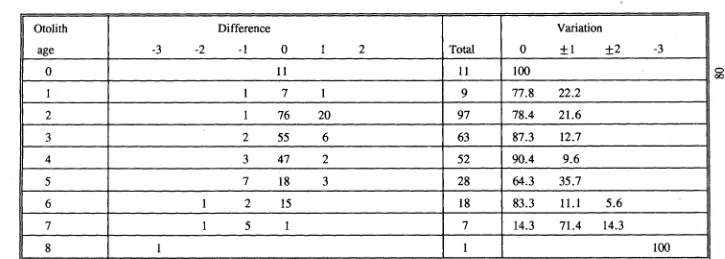
(3) ABSTRACT. Research of growth and reproduction was undertaken for scarids and acanthurids in coral reefs around Lizard Island, the Northern Great Barrier Reef, Australia. The study species were mainly the scarids Scarus rivulatus and Scarus. schlegeli, and the acanthurids Ctenochaetus binotatus and Ctenochaetus striatus. The study focussed on the establishment of validated aging information for both scarids and acanthurids, and the age-specific patterns of reproduction of scarids. Age and growth parameters were determined by enumerating growth increments within otolith microstructure for each species. Various mounting and grinding/polishing techniques were employed to reveal both fine lapillus growth rings in juveniles and sagitta growth bands in adults. Daily periodicity in otolith increments was demonstrated in 55 juvenile individuals in four of the main study species:. S.rivulatus (20), S.schlegeli (21), C.binotatus (12) and C.striatus (2), and 28 individuals of other species within the two families. Ring periodicity was determined by staining the otoliths in situ with tetracycline, and maintaining the individuals in captivity to compare the rings laid down with the number of elapsed days. Double staining techniques were also employed to determine the rings laid down between stainings. Annual periodicity in otolith bands was demonstrated by tag-recapture experiments in the both the aquarium and the field, and by otolith marginal increment analyses for the four study species. All recaptured specimens, including four. S.schlegeli and four C.striatus, showed annual otolith bands. The otolith marginal development on regular samples over the year for S.rivulatus and S.schlegeli also.
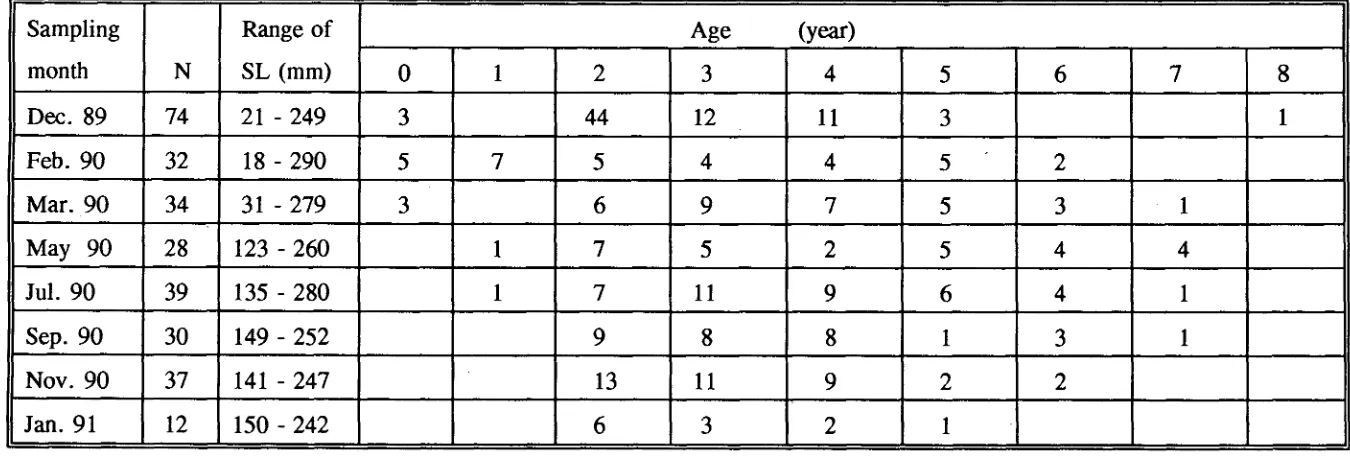
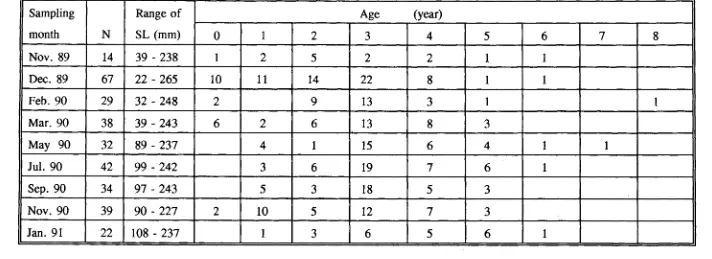
(4) indicated that a single otolith band was formed during December to May. By enumerating otolith increments and bands, age of the field captured individuals of each study species was estimated. The age of scarids ranged up to 8 years with the majority being younger than 5 years. The growth rate was increasing with age in days during the juvenile phase, and gradually decreased after that. The acanthurids lived for relatively long period in excess of 16 years, and the growth rate decreased with age after settlement. In addition, the age of settlement was estimated to be from 28 to 47 days for scarids and from 47 to 74 days for acanthurids. Reproductive biology of scarids was studied by seasonal examination of gonads. The gonads were examined histologically to determine the sexual identity and maturity state of individuals. By using validated aging information, the dynamics of sexual transition was observed. Mature gonads of the two species were found throughout the year. However, a pronounced spawning peak occurred between May and September in S.schlegeli while a relatively less pronounced spawning peak took place from September to January in S.rivulatus. These patterns were indicated by seasonal development of gonadosomatic index, seasonal distribution of mature gonads, oocyte length, and the proportion of mature stage oocytes within the gonads. The proportion of mature stage oocytes within mature ovaries of two species also suggested that these species were serial spawners. Enumerating mature oocytes within the subsamples of 20 individuals in each species showed positive relationships between fecundity and body length or age. Both females and primary males of the two species reached sexual maturity at 2 years. Females started to change sex at 3 years, and the sexual transition of the ii.
(5) population lasted for approximately another 3 years. Similarly, the primary males started changing color phase at 3 years. Growth rates appeared to be different between the initial phase and the terminal phase individuals, and the terminal phase individuals had a higher growth rate than that of the initial phase individuals of the same age. The proportional liver weight in S.rivulatus and S.schlegeli changed over time, and this reflected the compositional states. Larger livers had high levels of lipids, which fact was indicated by the colour and lipid droplets. High proportional liver weight occurred immediately before spawning for both species, suggesting that the liver is an important energy storage organ providing lipids for the gonadal development. For the two species of scarids studied in similar microhabitats and similar physical environments both showed seasonal patterns of liver weight and gonadal development, but it varied in timing and magnitude. This study suggests that scarids, which have relatively fast growth rates and short lifespans, are more suitable candidates for intensive fisheries than the lowgrowth and long-lifespan acanthurids. However, as the population dynamics of scarids is complicated by the protogynous hermaphroditism, comprehensive management is required in scarid fisheries.. iii.
(6) ACKNOWLEDGMENTS I am very grateful to my supervisor, Prof. Howard Choat, for his constant guidance, enthusiasm and encouragement; also for his assistance in the sample collection. I would also like to make especial mention of two persons: Dr Kendall Clements, whose constant help in the field work, making-a-great contribution to this project; and Dr George Jackson, who made improvement on the earlier manuscript. I would also like to thank: The Chinese government for providing an initial financial support; James Cook University of North Queensland for supporting my research with a James Cook University Postgraduate Scholarship Research Award, and an ARC grant to Prof. J.H. Choat and Dr. G. Russ; the staff of the Lizard Island Research Station; the technical staff of the School of Bioscience, James Cook University, especially Leigh Winsor and Zolly Florian; Dr David Bellwood, Brigid Kerrigan, Mark McCormick, Alison Green, Lida Axe, Beatrice Ferreira for additional help in the field. Mark McCormick, Natalie Moltschaniwskyj, Mark Hearnden, Orpha Bellwood, Bodle Hendrarto, Frank Hoedt, Pat Vance, and Ann Sharp for help with production, computing, sampling design and analysis; Phil McGuire, Jim Darley and L. R. Reilly for help with experiments and photograph; Finally, I am grateful to my wife, study.. for her love and support throughout this. iv.
(7) DECLARATION I declare that this thesis is my own work and has not been submitted in any form for another degree or diploma at any university or other institution of tertiary education. Information derived from the published or unpublished work of others has been acknowledged in the text and a list of references is given.. D.C. Lou 30 June 1992.
(8) STATEMENT OF ACCESS I, the undersigned, the author of this thesis, understand that James Cook University of North Queensland will make it available for use within the University Library and, by microfilm or other photographic means, allow access to users in other approved libraries. All users consulting this thesis will have to sign the following statement: "In consulting this thesis I agree not to copy or closely paraphrase it in whole or in part without the written consent of the author; and to make proper written acknowledgment for any assistance which I have obtained from it." Beyond this, I do not wish to place any restriction on access to this thesis.. 10/ -7 tya. (signature). (date). vi.
(9) Page. TABLE OF CONTENTS. Abstract iv. Acknowledgments Declaration Statement of Access. vi. Table of Contents. vii. List of Figures. xiv. List of Tables. xix. List of Plates. xxiii. CHAPTER 1: GENERAL INTRODUCTION. 1. CHAPTER 2: GENERAL METHODS. 7. 2.1 Study species. 7. 2.2 Study area. 8. 2.3 Sampling and preserving methods. 9. 2.4 Terminology. 14. 2.5 Colour phase and sexual identity of scarids. 15. CHAPTER 3: VALIDATION OF AGING TECHNIQUE FOR JUVENILE ACANTHURIDS AND SCARIDS. 16. 3.1 INTRODUCTION. 16. 3.2 MATERIALS AND METHODS. 18. 3.2.1 Juvenile collection. 18. 3.2.2 Validation experiments. 18. 3.2.3 Otolith preparation. 19. 3.2.4 Otolith increment counting and its consistency test. 22 23. 3.3 RESULTS vii.
(10) 3.3.1 General structures. 23. 3.3.2 Validation of daily otolith increments. 24. 3.3.3 Consistency test in increment counting. 31 31. 3.4 DISCUSSION 3.4.1 Daily otolith increments. 34. 3.4.2 Counting procedure. 36. CHAPTER 4: VALIDATION OF AGING TECHNIQUE FOR ADULT ACANTHURIDS AND SCARIDS. 37. 4.1 INTRODUCTION. 37. 4.2 MATERIALS AND METHODS. 38. 4.2.1 Specimen collection. 38. 4.2.2 Analysis of otoliths. 39. 4.2.2.1 Whole otoliths. 39. 4.2.2.2 Transverse section. 39. 4.2.3 Validation of periodicity of otolith growth bands. 41. 4.2.3.1 Tagging experiment. 41. 4.2.3.2 Analysis of otolith marginal increments. 42 42. 4.2.4 Scale analysis. 46. 4.3 RESULTS. 46. 4.3.1 Analysis of otoliths 4.3.1.1 Whole sagittae. 46. 4.3.1.2 Transverse sections. 47. 4.3.2 Validation of the periodicity of band formation. 64. 4.3.2.1 Tagging recapture. 64. 4.3.2.2 Analysis of otolith marginal increments. 65. viii.
(11) 4.3.3 Analysis of scales. 75. 4.3.4 Comparison of otolith and scale methods. 76 76. 4.4 DISCUSSION 4.4.1 Otolith aging method. 76. 4.4.2 Scale aging method. 89. CHAPTER 5: AGE AND GROWTH IN SCARIDS AND ACANTHURIDS. 92. 5.1 INTRODUCTION. 92. 5.2 MATERIALS AND METHODS. 93. 5.2.1 Estimation of age and growth for juveniles. 93. 5.2.2 Settlement checks. 94. 5.2.3 Estimation of age and growth for adults. 94. 5.2.3.1 Growth functions and curves. 95 96. 5.2.4 Growth comparison 5.2.4.1 Between species. 96. 5.2.4.2 Between locations. 97 98. 5.3 RESULTS. 98. 5.3.1 Age and growth in scarids 5.3.1.1 SL-WT relationship. 98. 5.3.1.2 Juvenile growth. 98. 5.3.1.3 Age structure and growth in adults. 99. 5.3.2 Age and growth in acanthurids. 110. 5.3.2.1 SL-WT relationship. 110. 5.3.2.2 Juvenile growth. 110. ix.
(12) 5.3.2.3 Age structure and growth in adults. 111. 5.3.3 Settlement age. 121. 5.3.4 Comparison on growth between acanthurids and scarids . .. 121. 5.3.4.1 Juveniles. 121. 5.3.4.2 Adults. 122. 5.3.5 Growth differences between locations in Scarus rivulatus .. 122. 5.3.5.1 Magnetic Island. 122. 5.3.5.2 Arlington & Thetford Reefs. 128. 5.3.5.3 Growth comparison. 128. 5.4 Discussion. 131. 5.4.1 Juvenile growth. 131. 5.4.2 Adult growth. 132. 5.4.3 Growth comparison. 135. CHAPTER 6: REPRODUCTIVE BIOLOGY OF SCARIDS. 137. 6.1 INTRODUCTION. 137. 6.2 MATERIALS AND METHODS. 138. 6.2.1 Specimen collection and processing. 138. 6.2.2 Histological examination of gonads. 138. 6.2.2.1 Classification of gonads. 139. 6.2.2.1.1 Female and secondary male. 139. 6.2.2.1.2 Primary male. 146. 6.2.2.1.3 Distinction between 1°d'cr and 2°d'cr. 146. 6.2.2.2 Pilot study on oocyte sampling. 146. 6.2.2.3 Ovary examination. 147.
(13) 6.2.3 Gonadosomatic index. 149. 6.2.4 Fecundity. 149. 6.2.5 The relationship between sex and growth rate. 150. 6.3 RESULTS. 150. 6.3.1 Anatomical features of the gonads. 150. 6.3.2 General sexual structure. 151. 6.3.3 Distribution of sexual and colour patterns. 151. 6.3.3.1 Scarus rivulatus. 154. 6.3.3.2 Scarus schlegeli. 155. 6.3.4 Seasonal pattern of gonad activities 6.3.4.1 Temporal distribution of gonad development classes. 162 162. 6.3.4.1.1 Scarus rivulatus. 162. 6.3.4.1.2 Scarus schlegeli. 163. 6.3.4.2 Seasonal variation in oocyte size and relative abundance of mature stages in the gonad. 164. 6.3.4.2.1 Pilot sampling program. 164. 6.3.4.2.2 Distribution of mature oocytes and their sizes. 170. 6.3.4.2.2.1 Scarus rivulatus. 170. 6.3.4.2.2.2 Scarus schlegeli. 171. 6.3.4.3 Multiple spawning and fecundity. 178. 6.3.5 Size at age among sexes and color phases. 181 182. 6.4 DISCUSSION 6.4.1 Anatomical features of the gonads and sexual transformation schedule 6.4.2 The breeding season, multiple spawning, and fecundity . . xi. 182 191.
(14) 6.4.3 Growth among sexes and color phases. 192. CHAPTER 7: LIVER AND HEPATIC LIPIDS OF TROPICAL SCARIDS 195 7.1 INTRODUCTION. 195. 7.2 MATERIALS AND METHODS. 195. 7.2.1 Liver collection. 196. 7.2.2 Histological examination. 196. 7.2.2.1 Process. 196. 7.2.2.2 Hepatic lipid measurement. 196. 7.3 RESULTS. 197. 7.3.1 General structure. 197. 7.3.2 Hepatisomatic index. 201. 7.3.2.1 Distribution by SL and age. 201. 7.3.2.2 Seasonal distribution. 208. 7.3.2.2.1 Scarus schlegeli. 208. 7.3.2.2.2 Scarus rivulatus. 208. 7.3.3 Hepatic lipids. 209. 7.3.3.1 Lipid droplets. 209. 7.3.3.2 The relationship between liver colour and HLI. 212. 7.3.3.3 Distribution of HLI. 212. 7.3.3.3.1 Scarus rivulatus. 216. 7.3.3.3.2 Scarus schlegeli. 216. 7.4 DISCUSSION. 219. CHAPTER 8: GENERAL DISCUSSION AND CONCLUSIONS 8.1 GENERAL DISCUSSION. 223 223. xii.
(15) 8.2 CONCLUSIONS References. 229 232.
(16) LIST OF FIGURES. Page. Chapter Two Fig. 2.1 The map of Lizard Island showing all sampling sites 2.2 The maps of Arlington & Thetford Reefs and Magnetic Island. 10 11. Chapter Three Fig. 3.1 Regressions of otolith increments counted against number of days for individuals maintained after tetracycline staining. 29. Chapter Four Fig. 4.1 Sagitta diagrams. 45. Fig. 4.2 Ctenochaetus binotatus. Relationships between otolith dimensions and fish length (SL). 52. Fig. 4.3 Ctenochaetus striatus. Relationships between otolith dimensions and fish length (SL). 53. Fig. 4.4 Scarus rivulatus. Relationships between otolith dimensions and fish length (SL). 54. Fig. 4.5 Scarus schlegeli. Relationships between otolith dimensions and fish length (SL). 55. Fig. 4.6 Relationships between fish length (SL) and relative growth rates (RG) of otolith dimensions. 56. Fig. 4.7 Scarus rivulatus. Percent of otoliths with opaque margins by each sampling occasion. 72. Fig. 4.8 Scarus schlegeli. Percent of otoliths with opaque margins by each sampling occasion. 72. Fig. 4.9 Ctenochaetus binotatus. Percent of otoliths with opaque margins by each sampling occasion. 73. Fig. 4.10 Ctenochaetus striatus. Percent of otoliths with opaque margins by each sampling occasion. 73. Fig. 4.11 Relationships between scale radius (SR) and fish length (SL). 82. Fig. 4.12 Schematic diagram of parrotfish scale. 83. Chapter Five xiv.
(17) Fig. 5.1 Scarus rivulatus. The relationship between standard length and body weight. 106. Fig. 5.2 Scarus schlegeli. The relationship between standard length and body weight. 106. Fig. 5.3 Scarus rivulatus. The growth curve of juveniles. 107. Fig. 5.4 Scarus schlegeli. The growth curve of juveniles. 107. Fig. 5.5 Scarus rivulatus. Means of observed SL versus age and means of back-calculated SL. 108. Fig. 5.6 Scarus schlegeli. Means of observed SL versus age and means of back-calculated SL. 108. Fig. 5.7 Scarus rivulatus. The overall theoretical growth curves. 109. Fig. 5.8 Scarus schlegeli. The overall theoretical growth curves. 109. Fig. 5.9 Ctenochaetus striatus. The relationship between standard length and body weight. 117. Fig. 5.10 Ctenochaetus binotatus. The relationship between standard length and body weight. 117. Fig. 5.11 Ctenochaetus striatus. The growth curve of juveniles. 118. Fig. 5.12 Ctenochaetus binotatus. The growth curve of juveniles. 118. Fig. 5.13 Ctenochaetus striatus. Means of the observed SL versus gage and means for back-calculated SL. 119. Fig. 5.14 Ctenochaetus binotatus. Means of the observed SL versus age and means of back-calculated SL. 119. Fig. 5.15 Ctenochaetus striatus. The overall theoretical growth curves. 120. Fig. 5.16 Ctenochaetus binotatus. The overall theoretical growth curves. 120. Fig. 5.17 The juvenile growth curves of Ctenochaetus binotatus, C.striatus, Scarus rivulatus and S.schlegeli. 126. Fig. 5.18 Otolith increment width series from ten juveniles. 127. Fig. 5.19 von Bertalanffy growth curves for Ctenochaetus binotatus, C striatus, 130 Scarus rivulatus and S.schlegeli xv.
(18) Fig. 5.20 von Bertalanffy growth curves for Scarus rivulatus collected from Lizard 130 Island, Magnetic Island and Arlington & Thetford Reef Chapter Six Fig. 6.1 Summary of the pilot study on oocyte measurements. 148. Fig. 6.2 The schematic diagrams showing morphological change of testes in 1° cre and 2° d'e with age. 153. Fig. 6.3 Proportions of each sexual type in successive 20 mm SL groupings of Scarus rivulatus from Lizard Island. 160. Fig. 6.4 Proportions of each sexual types in each age group of Scarus rivulatus from Lizard Island. 160. Fig. 6.5 Proportions of each sexual type in successive 20 mm SL groupings of Scarus schlegeli from Lizard Island. 161. Fig. 6.6 Proportions of each sexual type in each age group of Scarus schlegeli from Lizard Island. 161. Fig. 6.7 Number of individuals of Scarus rivulatus in each ovary development class. 165. Fig. 6.8 Distribution of average mature ovary indices (GSI) from Scarus rivulatus. 165. Fig. 6.9 Number of individuals of Scarus rivulatus in each testes development class. 166. Fig. 6.10 Average mature testes indices (GSI) from IP male Scarus rivulatus. 166. Fig. 6.11 Number of individuals of Scarus schlegeli in each ovary development class. 167. Fig. 6.12 Average mature ovary indices (GSI) from Scarus schlegeli. 167. Fig. 6.13 Number of individuals of Scarus schlegeli in each testes development class. 168. Fig. 6.14 Average mature testes indices (GSI) from IP male Scarus schlegeli. 168. Fig. 6.15 Distribution of the different stage oocytes from testing specimens of Scarus schlegeli. 174. xvi.
(19) Fig. 6.16 Distribution of the different stage oocytes from the testing specimens of Scarus rivulatus. 175. Fig. 6.17 Average proportion of stage 4 and 3 oocytes for mature females of Scarus rivulatus. 176. Fig. 6.18 Average oocyte length for mature females of Scarus rivulatus. 176. Fig. 6.19 Average proportion of stage 4 and 3 oocytes for mature females of Scarus schlegeli. 177. Fig. 6.20 Average oocyte length for mature females of Scarus schlegeli. 177. Fig. 6.21 Distribution of the total number of vitellogenic oocytes by SL of Scarus rivulatus. 179. Fig. 6.22 Distribution of the total number of vitellogenic oocytes by age of Scarus rivulatus. 179. Fig. 6.23 Distribution of the total number of vitellogenic oocytes by SL of Scarus schlegeli. 180. Fig. 6.24 Distribution of the total number of vitellogenic oocytes by age of Scarus schlegeli. 180. Fig. 6.25 Mean lengths for successive age groups of females, IP lod'd', TP lod'e and 20 d'd' of Scarus rivulatus. 187. Fig. 6.26 Mean lengths for successive age groups of females, IP 10 d'o", TP loedi and 2 0 0"e of Scarus schlegeli. 188. Chapter Seven Fig. 7.1 A schematic diagram of histological liver sections. 198. Fig. 7.2 Scarus rivulatus. The distribution of hepatosomatic index (HSI) by SL in different sexual types and color phases. 206. Fig. 7.3 Scarus rivulatus. HSI distribution by age classes in different sexual types and color phases. 206. Fig. 7.4 Scarus schlegeli. HSI distribution by SL in different sexual types and color phases. 207. Fig. 7.5 Scarus schlegeli. HSI distribution by age class in different sexual types and color phases. 207. xvii.
(20) Fig. 7.6 Average HSI from Scarus schlegeli. 210. Fig. 7.7 Average HSI from Scarus rivulatus. 210. Fig. 7.8 Distribution of hepatic lipid droplets in four measuring areas (DO, VE, PR and CE) in 276 Scarus rivulatus. 215. Fig. 7.9 Distribution of hepatic lipid droplets in four measuring areas (DO, VE, PR and CE) in 289 Scarus schlegeli. 215. Fig. 7.10 An overall distribution of hepatic lipid index (HLI) by HSI for Scarus rivulatus. 217. Fig. 7.11 An overall distribution of hepatic lipid index (HLI) by HSI for Scarus schlegeli. 217. Fig. 7.12 Seasonal distributions of hepatic lipid index (HLI) for female, male and immature Scarus rivulatus. 218. Fig. 7.13 Seasonal distributions of hepatic lipid index (HLI) for female, male and immature Scarus schlegeli. 218. xviii.
(21) LIST OF TABLES. Page. Chapter Two Table 2.1 Summary of samples from various sites around Lizard Island. 12. Table 2.2 Scarus rivulatus collected from the other sites. 13. Chapter Three Table 3.1 The details of validation experiments at Lizard Island. 20. Table 3.2 Results of Chi-square tests of the validation experiments at Lizard Island. 28. Table 3.3 Results of ring counts between left and right otoliths. 32. Table 3.4 Results of otolith ring counts between readers. 33. Chapter Four Table 4.1 Details of sampling for the otolith marginal analysis in surgeonfishes. 43. Table 4.2 Details of sampling for the otolith marginal analysis in parrotfishes. 44. Table 4.3 Ctenochaetus striatus. Comparison between otolith dimensions and fish length (SL). 48. Table 4.4 Ctenochaetus binotatus. Comparison between otolith dimensions and fish length (SL). 49. Table 4.5 Scarus rivulatus. Comparison between otolith dimensions and fish length (SL). 50. Table 4.6 Scarus schlegeli. Comparison between otolith dimensions and fish length (SL). 51. Table 4.7 Comparison of two counts on otolith bands from surgeonfishes. 66. Table 4.8 Comparison of two counts of the otolith bands from parrotfishes. 67. Table 4.9 Results of otolith band counting between two readers in Scarus rivulatus. 68. Table 4.10 Results of otolith band counting between xix.
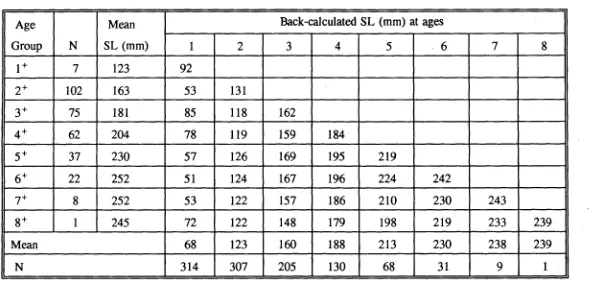
(22) two readers in Scarus schlegeli. 69. Table 4.11 Results of tag-recapture experiments. 70. Table 4.12 The results of counts on the fine increments in otoliths of tag-recaptured Scarus schlegeli. 71. Table 4.13 Scarus rivulatus. The age composition of samples used in the otolith marginal analysis. 77. Table 4.14 Scarus schlegeli. The age composition of samples used in the otolith marginal analysis. 78. Table 4.15 Comparison between scale radius (SR) and fish length (SL). 79. Table 4.16 Scarus rivulatus. Comparison of age estimates from otoliths and scales. 80. Table 4.17 Scarus schlegeli. Comparison of age estimates from otoliths and scales. 81. Table 4.18 Otolith annual bands of the other tetracycline mark-recapture parrotfishes from the Great Barrier Reef (GBR). 91. Chapter Five Table 5.1 Length-weight relationships for Scarus rivulatus and S.schlegeli between males (M) and females (F). 101. Table 5.2. Scarus rivulatus. Comparison between the mean of observed SL and the predicted SL. 102. Table 5.3 Scarus schlegeli. Comparison between the mean of observed SL and the predicted SL. 103. Table 5.4 Scarus rivulatus. Back-calculated lengths for each age group. 104. Table 5.5 Scarus schlegeli. Back-calculated length (mm) for each age group. 105. Table 5.6 Ctenochaetus striatus. Comparison between the mean of observed SL and the predicated SL. 113. Table 5.7 Ctenochaetus binotatus. Comparison between the mean of observed SL and the predicted SL. 114. Table 5.8 Ctenochaetus striatus. Back-calculated length xx.
(23) for each age group. 115. Table 5.9 Ctenochaetus binotatus. Back-calculated lengths for each age group. 116. Table 5.10 Summary of settlement patterns for the species studied. 123. Table 5.11 Growth performance indexes (0) of the species studied Table 5.12 Mean SL of Scarus rivulatus from different parts of the GBR. .. 124 129. Chapter Six Table 6.1 Stages of scarids' oogenesis. 141. Table 6.2 Stages of scarids' spermatogenesis. 141. Table 6.3 Frequency of sexual types, color phase in each 20-mm size class for Scarus rivulatus. 156. Table 6.4 Frequency of sexual types and color phase in each age group of Scarus rivulatus. 157. Table 6.5 Frequency of sexual types and color phase in each 20-mm size class for Scarus schlegeli. 158. Table 6.6 Frequency of sexual types and color phase in each age group of Scarus schlegeli. 159. Table 6.7 Results of ANOVA on the data of oocyte length for Scarus schlegeli in the pilot study. 172. Table 6.8 Results of ANOVA on the data of oocyte length for Scarus rivulatus in the pilot study. 173. Table 6.9 Mean SL ± s.d. (sample size) of Scarus rivulatus. 183. Table 6.10 Mean SL ± s.d. (sample size) of Scarus schlegeli. 184. Table 6.11 Means of gonad weight (g) ± s.d. (sample size) of Scarus rivulatus. 185. Table 6.12 Means of gonad weights (g) ± s.d. (Sample size) of Scarus schlegeli. 186. Chapter Seven. xxi.
(24) Table 7.1 Means+s.d. of HSI between sexual types, color phases in each 20-mm size class for Scarus rivulatus. 202. Table 7.2 Means+s.d. of HSI between sexual types, color phases in each age class for Scarus rivulatus. 203. Table 7.3 Means+s.d. of HSI between sexual types, color phases in each 20-mm size class for Scarus schlegeli. 204. Table 7.4 Means+s.d. of HSI between sexual types, color phases in each age class for Scarus schlegeli. 205. Table 7.5 Relationship between liver colour and hepatic lipids in Scarus schlegeli. 213. Table 7.6 Relationship between liver colour and hepatic lipids in Scarus rivulatus. 214.
(25) LIST OF PLATES. Page. Chapter Three Plate 3.1 Microstructure of lapilli of the juvenile surgeonfish and parrotfish. 25. Plate 3.2 Validated daily increments on the lapilli of surgeonfishes. 26. Plate 3.3 Validated daily increments on the lapilli of parrotfishes. 30. Chapter Four Plate 4.1 Ctenochaetus binotatus. Otolith transverse sections with the various number of bands. 57. Plate 4.2 Ctenochaetus striatus. Otolith transverse sections with the various number of bands. 58. Plate 4.3 Scarus rivulatus. Otolith transverse sections with the various number of bands. 59. Plate 4.3 Cont.. 60. Plate 4.4 Scarus schlegeli. Otolith transverse sections with the various number of bands. 61. Plate 4.4 Cont.. 62. Plate 4.5 Otolith transverse sections of tag-recapture specimens from both field and the aquarium. 74. Plate 4.6 Parrotfish scales. 84. Chapter Five Plate 5.1 Settlement checks (SC) on the lapillus. 125. Chapter Six Plate 6.1 Scarus rivulatus. Photomicrographs of ovary development classes 1 through 4. 142. Plate 6.2 Scarus schlegeli. Photomicrographs of ovary development classes 1 through 4. 143. Plate 6.3 Photomicrographs of gonad development for male Scarus rivulatus and S.schlegeli. 144.
(26) Plate 6.4 The gonads of transitional and 1° dud' individuals. 145. Plate 6.5 The testes of 2°0"di individuals. 152. Chapter Seven Plate 7.1 General structure of a transverse section of scarid liver from 230 mm Scarus schlegeli. 200. Plate 7.2 Comparison between the normal histological liver sections and the liver-extracted sections in the scarids. 211. x x iv.
(27) CHAPTER 1. GENERAL INTRODUCTION. This thesis focuses on growth and reproduction of an important group of herbivorous coral reef fish, the Family Scaridae. Two areas of research are critical to the understanding of the dynamics of coral reef fishes. Firstly, it is essential to establish growth rates and age structures by validated age information. Secondly, as the majority of coral reef fishes are protogynous hermaphrodites the patterns of different growth and mortality for each sexual group must be clarified. This thesis addresses these problem by undertaking a detailed analysis of two species of the Family Scaridae. In addition this thesis also examines the age structure and growth rate of two species of the Family Acanthuridae, another important group of coral reef fishes. Unlike the majority of coral reef fishes, acanthurids are not protogynous hermaphrodites, and thus have a different life history pattern from scarids. By comparing growth between scarids and acanthurids, this study investigates variations on demography between protogynous hermaphroditic and non-protogynous hermaphroditic species of herbivorous reef fishes. Scarids and acanthurids are two dominant components of the reef fish fauna on coral reefs, in terms of both biomass and species richness (Williams and Hatcher, 1983; Russ 1984a & b; Horn, 1989). Research into the age and demography of these herbivorous reef fish is because of the important role these fishes play in trophodynamics of coral reefs (Hatcher, 1981, 1983; Klumpp et al., 1987; Klumpp and Polunin, 1989), bioerosion (Bardach, 1961; Gygi, 1969, 1975; Frydi and Stearn, 1978; Hutchings, 1986; Horn, 1989, Bellwood and Choat, 1990), and fisheries in the 1.
(28) Asia and Pacific region (Alcala and Luchavez, 1981; Johannes, 1981; Munro and Williams, 1985; Russ and St. John, 1988; Russ, 1991). There is a strong need for the study of age determination in coral reef fishes, especially for adult individuals based on seasonal and annual banding patterns (Russ, 1991). Research into the dynamics of tropical fish populations has been hampered by the absence of long term age composition data (Longhurst and Pauly, 1987). Previous publications have contained a considerable diversity of opinions with regard to the methodology for the direct aging of tropical fish from hard anatomical structures (Weatherley and Gill, 1987). Data presented in the literature has suggested conflicting views for both the existence of annuli (Fagade, 1974; Blake and Blake 1978, 1981; Fowler, 1990; Lou, 1992 ) and non-existence of annuli (Holden, 1955; Pannella, 1974) within the hard anatomical structures. Moreover, Weatherley and Gill (1987), Dee and Radtke (1989) and Radtke (1987) considered that annual age determination was too difficult to carry out on tropical fishes. One factor contributing to this problem has been the use of inappropriate methodologies to describe or interpret calcified structures. In many instances there has been a lack of appropriate validation for justifying the use of a method for annual age determination. Validation of the daily and annual periodicity in otolith growth increments has been a major breakthrough in the study of growth dynamics in tropical herbivorous reef fishes. Without the ability to age individuals, it is difficult to obtain estimates of cohort age from population samples. Early attempts to age scarids and acanthurids have involved the enumeration of marks on the cleithra (Warner and Downs, 1977), checks on the scale (Papaconstantinou and Petrakis, 1986) and supposed daily otolith 2.
(29) increments (Itano, 1988). However, none of these studies reached satisfactory conclusions with regard to using these structures to determine individual age. In tropical reef fishes, daily otolith growth increments were first documented by Ralston (1976), and the majority of research has been carried out on larvae and juveniles within the last decade (Victor, 1982, 1983,1986a&b,1987; Brothers et al., 1983; Pitcher, 1988; Fowler, 1989; Lou and Moltschaniwskyj, 1 1992 ). Annual otolith bands were recently reported on the small, tropical coral reef fish,. Pomancentrus mollucensis, by Fowler (1990). This growing pool of evidence regarding aging in tropical reef fish suggests that accurate size-at-age information could be obtained for tropical species and used to construct age-specific growth and maturity schedules. The majority of tropical herbivorous fish ageing research has been preliminary in scope and focused on larvae and juveniles. There was therefore a need to undertake a more detailed demographic analysis on the application of otolith age data for scarids and acanthurids. The dynamics of some reef fish populations is complicated by sequential hermaphroditism, which is a phenomenon characterised by an individual changing from one sex to another at some point in its life history, and widespread in teleost fishes (Reinboth 1970; Pollock, 1985; Sadovy and Shapiro, 1987; Ebisawa, 1990). There are two types of such phenomenon, one of which is protandrous in that animals change from male to female and the other is the reverse (protogyny). Previous studies on the population dynamics of sequential hermaphroditic reef teleosts show that demographic parameters generally vary in different sexual groups within the population (Warner, 1975; Ross, 1984; Cowen, 1990). Members of the Scaridae are predominantly protogynous hermaphrodites 3.
(30) (Choat and Robertson, 1975; Robertson and Warner, 1978; Randall and Choat, 1980; Randall and Bruce, 1983; Choat and Randall, 1986). Adult scarids possess two main colour phases, a drab color phase and a gaudy color phase. Drab color phase individuals may be either male or female, whilst gaudy color phase individuals are invariable male. Some individuals are male throughout their life, i.e. during both drab and gaudy color phases. Most males, however, spend the drab color phase period as a female before developing testes and exhibiting gaudy phase colouration. This complex life history in scarids has drawn the attention of many scientists. Consequently, a number of studies have been carried out on their life histories in regard to sexual patterns (Choat, 1969; Choat and Robertson, 1975; Robertson and Warner, 1978; Yogo et al., 1980). However, there has been no study which reliably describes the sexual pattern in age specific terms even though such a study is the basis for estimating the demographic parameters for different sexual phases. By using validated aging and growth data and histological examination of the gonads, this study investigates the detailed life pattern of different sexual groups within the scarid population. Furthermore, as the pattern and magnitude of seasonal change in reproduction and condition in coral reef fishes is virtually unknown, this will also be examined by regularly seasonal sampling. Fish condition generally reflects the storage of energy within the body. The liver is an important organ of energy storage in teleosts (Weatherley and Gill, 1987), and it plays a significant role in the gonadal development of some species (Crupkin. et al., 1988; Smith et al., 1990). Previous studies indicate that scarids have large and oily livers (Al Hussaini, 1945, 1947; Bellwood, 1985), but the function of these has not been described. Therefore, it is worthwhile to examine the seasonal and age 4.
(31) and reproduction. The research results are organised into five chapters (numbered 3-7) along with a chapter dealing with the general background biology and biogeography of each main study species (Chapter 2). Chapter three and four deal with the establishment of techniques for the validation and enumeration of otolith growth increments in both juveniles and adults, while the next three chapters (5 - 7) deal with population biology, reproduction and liver function focusing primarily on the species Scarus. rivulatus and S.schlegeli. The primary aims and topics addressed in each of the chapters are as follows:. Chapter 3. To examine whether juvenile individuals of the respective species possess growth rings within the otolith microstructure, whether experimental methods can be employed to determine the periodicity of these rings, whether any techniques can be employed to visualise and enumerate these growth rings and therefore to estimate the age of individual juveniles.. Chapter 4. To investigate if adult individuals of the respective species possess annual growth bands within the otolith microstructure, if experimental methods can be employed to determine the periodicity of these bands, if any techniques can be employed to visualise and enumerate these growth bands and therefore to estimate the age of individual adults.. Chapter 5. To estimate the age specific growth pattern of Scarus rivulatus,. S.schlegeli, Ctenchaetus binotatus and C.striatus and how fast these species are 5.
(32) growing. To examine their settlement age and how large the variation in growth is between different species and different locations.. Chapter 6. To assist whether individual age analysis can reveal about the timing of maturity processes, sexual and colour phase change in scarids. By using gonadal analysis age-specific schedules of maturity and sexual transition were determined. The seasonal pattern of gonadal activities and the variation of demographic parameters between different sexual groups among color phases were also examined.. Chapter 7. Preliminary liver analysis was carried out to determine age-specific and seasonal variations of liver condition with regard to sexual maturity schedules.. Finally, a general discussion reviews the main results, and analyses these results in relation to the population dynamics of tropical scarids and acanthurids. Suggested directions for future study are also outlined. In addition, a summary of the main conclusions is listed.. 6.
(33) CHAPTER 2. GENERAL METHODS. This chapter provides background information with regard to study species and the marine environment at localities sampled during this research program. General collection and preservation techniques are also provided. In addition, general terminology is described. More detailed specific methods are given in each of the respective chapters.. 2.1 Study species. Ctenochaetus striatus (Quoy & Gaimard 1825) and Ctenochaetus binotatus (Randall 1955) are both belonged to the family Acanthuridae (common name: surgeonfish). This family is characterised by a small terminal mouth, a single row of teeth, a compressed body, thick skin with tiny scales and a pair of sharp spines on the caudal peduncle (Myers, 1989). Both species occur on coral reefs in the IndoPacific region (Randall et al. 1990), and are dominant components of the reef fish fauna on coral reefs (Williams and Hatcher, 1983; Russ, 1984a,b; Horn, 1989). They feed on fine detrital and soft algal material by sucking their sediments (Russ, 1984a; Randall et al., 1990).. C. striatus inhabits over coral rock, pavement, or rubble substrate F of reef flats, lagoon and seaward reefs to a depth of over 30 m. Similarly, C. binotatus inhabits in coral and rubble areas of deep lagoons and seaward reefs to a depth of up to 53 m (Myers, 1989). These two species do not change sex.. Scarus rivulatus (Valenciennes 1840) and Scarus schlegeli (Bleeker 1861) are grouped in the family Scaridae (common name: parrotfish). This family is 7.
(34) characterised by their bright colours and the fusion of their teeth forming beak-like plates in the jaws (Randall et al., 1990). The former is widespread in the western Pacific but does not extend into the Indian Ocean (Choat and Randall, 1986; Randall. et al., 1990). While the latter is confined to the islands of Oceania (except the easternmost) and the western Pacific (Randall et al., 1990). In the Great Barrier Reef both species are abundant on mid-shelf reefs while S. rivulatus is also abundant on inshore reefs (Russ, 1984a,b; Choat and Randall, 1986). They mainly feed on benthic algae which they scrape from dead coral rock. In this way they usually remove some of the surface layer of limestone, and are a major producer of sediment in tropical and subtropical seas (Randall et al., 1990). Like most members of the family, S. rivulatus and S.schlegeli display distinct color phases at different stages of their life, and are protogynous hermaphrodites (Choat and Robertson, 1975; Randall and Choat, 1980; Choat and Randall, 1986).. 2.2 Study area The majority of sampling was undertaken at Lizard Island and neighbouring reefs while a small number of specimens was collected at Arlington & Thetford Reefs and Magnetic Island. Lizard Island (Fig. 2.1) is a continental island in the northern Great Barrier Reef (GBR), and is situated 36 km off the mainland coast and 16 km from the outershelf reefs (14°45'S, 145°28'E). The prevailing wind direction at Lizard Island is from the southeast, particularly during the trade-wind months from March to September. From October to February, winds become lighter and more variable. Sea surface temperatures range from 22°C to 32°C. The wet season generally occurs 8.
(35) from December to May, and the dry season lasts from June to November. Sampling was carried out at Lizard Island between September 1987 and January 1991, and these specimens were used throughout this thesis. All sampling sites around Lizard Island mentioned in the text are depicted in Figure 2.1. Arlington and Thetford Reefs are mid-shelf reefs (16°45'S 146°10'E), and located approximately 17 nautical miles northeast of Cairns in the northernmost of the central GBR (Fig. 2.2a). Magnetic Island is a continental island off Townsville (19°00'S, 146°10'E). The sample was taken at Nelly Bay and Geoffrey Bay, on the south-east coast of the Island (Fig. 2.2b). Sampling was conducted in these locations between April and October 1988. The specimens (Scarus rivulatus) were only used for growth comparison in Chapter 5.. 2.3 Sampling fixative and preserving methods All individuals were collected by netting and spearing (Tables 2.1,2). Large individuals (predominantly standard length (SL) > 135 mm) were generally collected with a 40-45 mm mesh square mono-gill net (30 m length, 1.5 m width) and a Horsepower spear gun. The post-juveniles (generally SL ranged from 80 to 135 mm) were usually sampled using a hand spear gun, and the juveniles (SL < 80 mm) were collected using 7 mm mesh square mono-filament barrier net (1.5 m length, 1 m width) and a hand net. All collection was carried out using SCUBA. Most of the large acanthurids and scarids were fresh processed while a few specimens were immediately frozen upon collection for up to one day. All material for histological analysis was fixed immediately after capture (see Chapter 6 and 7). The small specimens (juveniles and post-juveniles) were either frozen or fixed 9.
(36) Fig. 2.1 The map of Lizard Island showing all sampling sites (arrowed).. 10.
(37) • ". ca y. .. Mermaid Cove Granite Bluffs. -• North Reef Macs Reef 4.. .. Turtle Beach Bombie Bay Watsons Bay Crystal Beach Osprey Is.. Pidgin Point. Coconut Beach. Palfrey Is. 1 c=5'. Bird Is.. 1 Km.
(38) Fig. 2.2 Maps of Arlington & Thetford Reefs and Magnetic Island. A. The map of Arlington and Thetford Reefs; B. The map of Magnetic Island showing Nelly Bay and Geoffrey Bay (arrowed); C. The map of the Great Barrier Reef showing relative position of A and B.. 11.
(39)
(40) Table 2.1 Summary of samples from various sites around Lizard Island. Sr - Scarus rivulatus; Ss - Scarus schlegeli; Cb - Ctenochaetus binotatus; Cs Ctenochaetus striatus.. Number of Sampling sites. individuals Spearing. Netting. Mermaid Cove. 36 Sr, 74 Ss, 18 Cb, 5 Cs. 19 Sr, 50 Ss, 5 Cb, 1 Cs. Granite Bluffs. 14 Sr, 31 Ss, 1 Cb, 1 Cs. 1 Sr, 4 Ss, 10 Cb, 15 Cb. Turtle Beach. 19 Sr, 20 Ss, 7 Cb, 4 Cs. 30 Sr, 54 Ss, 1 Cb. Watsons Bay. 26 Sr, 41 Ss. 5 Sr, 7 Ss. Osprey Island. 10 Sr, 9 Ss 4 Sr. Palfrey Island. 33 Sr, 16 Ss. Lagoon P&S. 10 Sr, 1 Ss, 1 Cb, 1 Cs. South Island. 94 Sr, 15 Ss, 1 Cb, 1 Cs. Lagoon. 39 Sr, 14 Ss, 4 Cb,. Bird Island. 7 Sr, 12 Ss,. 5 Sr. 2 Sr, 1 Ss, 7 Cb, 10 Cs. Coconut Beach. 4 Sr, 12 Ss. Pidgin Point. 2 Sr, 3 Ss. Crystal Beach. 6 Ss. 9 Sr, 7 Ss,. Bombie Bay. 2 Sr, 2 Cb. 3 Sr. Macs Reef. 1 Sr, 9 Ss. 6 Sr. North Reef. 7 Sr, 19 Ss, 23 Cb, 2 Cs. 7 Sr, 2 Ss, 10 Cb, 11 Cs. Total. 288 Sr, 258 Ss, 60 Cb, 17. 107 Sr, 149 Ss, 33 Cb, 40. Cs. 12. Cs.
(41) Table 2.2 Scarus rivulatus collected from the other sites. Number of Sampling sites. Netting. Arlington Reef. 10. Thetford Reef. 16. Nelly Bay. 9. individuals Spearing. 5 19. Geoffrey Bay. 13.
(42) directly in 70% ethanol.. 2.4 Terminology. Acanthurids and scarids are generally referred to family Acanthuridae and. Scaridae. However, these are in reference to the genera Ctenochaetus and Scarus in this thesis. General fisheries measurements were used in this thesis, i.e. standard length (SL) - the length of fish body, taken from the middle of the tip of the upper jaw to the base of the caudal fin; total length (TL) - the greatest possible length of a fish, from the tip of the longest jaw to the longest caudal ray; body weight (WT) - wet body weight of fish with guts. Standard scientific abbreviations are used throughout this thesis; grn = micrometre, mm = millimetre, m = metre, km = kilometre, °C =degree celsius, h =hour, d =day, mg =milligram, g =gram, ml =millilitre and 1=litre. In otoliths, the fine periodic laminae are referred to as increments, and the large periodic rings are referred to as bands throughout this thesis. The thin periodic rings on scales are defined as checks. An age group in this thesis is defined as follows: All fish of the same age are grouped together in a single age group which is designated by an arabic numeral indicating the number of years of life completed. Thus fish in their first year of life belong to the 0 group, in the second year to the 1 group, and so on. The arabic numeral may be followed by a + sign, which indicates that fish concerned have already passed through a portion of the next year of life. 14.
(43) Juveniles in this thesis refer to as young acanthurids and scarids which have settled on reefs, and whose SL is generally less than 100 mm. For purpose of this thesis adults are considered fishes whose SL exceeds 100 mm.. 2.5 Color phase and sexual identity of scarids Within many scarid species there exist three distinct, relatively permanent color patterns. In this study, the terminology used by Warner and Robertson (1978) is followed, i.e juvenile, initial and terminal phases. The juvenile phase is a color pattern characteristic of immature individuals. The initial phase is a drab color phase characteristic of small adult individuals while the terminal phase is a colourful phase characteristic of the largest males. Work on protogyny in the scarids (Choat and Robertson, 1975; Robertson and Warner, 1978; Randall and Bruce, 1983) indicate that ontogenetically, there are two types of males, those born as male (primary males ) and males which were originally females (secondary males). In addition, a further distinction is made between hermaphroditic males that functioned as females before changing sex (postmaturational secondary males ) and those that change sex before they have matured as females (pre-maturational secondary males). If a species contains both primary and secondary males, it is termed diandric. When the only males present are secondary, it is monandric (Reinboth, 1970; Sadovy and Shapiro, 1987). The scarids in this study (Scarus rivulatus and S.schlegeli) are both diandric (Choat and Randall, 1986). In the growth part of this thesis unless stated otherwise (Chapter 5), males included primary and secondary males.. 15.
(44) CHAPTER 3. VALIDATION OF AGING TECHNIQUES FOR JUVENILE ACANTHURIDS AND SCAMS. 3.1 INTRODUCTION. The use of otolith increments for aging larval and juvenile fish has become increasingly popular for establishing growth parameters in wild populations (Jones, 1986). This technique is based upon the assumption that otolith increments are formed at a rate of one per day and the degree of precision in increment counts reflects the accuracy in estimating age. A prerequisite of otolith age determination in each species is the validation of the periodicity of otolith increments (Beamish and McFarlane, 1983). The presence of daily increments has been validated in a number of juvenile coral-reef fish species on the Great Barrier Reef (GBR), Australia (eg. six species of pomacentrids, Pitcher, 1988; three species of chaetodonts, Fowler, 1989). In contrast, juvenile acanthurids and scarids have received , little attention in regard to their age and growth from scientists although they are two dominant groups of herbivorous fishes in the region (Lou and Moltschaniwskyj, 1992 )• On the assumption that growth increments in otoliths are deposited on a regular daily basis, Brothers et al. (1983) estimated the age of larval and juvenile acanthurids and scarids on GBR. However, this assumption has yet to be validated for the Scaridae, and the Acanthuridae. The reliability and precision in increment counts, have yet to be assessed in tropical coral-reef fish. Such an assessment of the precision of daily increment counts will improve the aging methodology for tropical coral-reef fish. Methods of validation that are widely used include otolith increment counts 16.
(45) of known-age fish hatched and raised in the laboratory (Brothers et al., 1976; Neilson and Geen, 1982; Moksness and Wespestad, 1989), sequential sampling of a population with discrete cohorts (Struhsaker and Uchiyama, 1976), and chemically marking the otoliths to produce a time mark (Schmidt, 1984; Thorrold, 1989; D'Amours et al., 1990). Chemical marking techniques commonly employ oxytetracycline-hydrochloride, which is incorporated into growing calcified tissue such as the margins of otoliths, and can be detected as it fluoresces under ultraviolet light (Wild and Foremen, 1980; Campana and Neilson, 1982; Beamish et al., 1983; Hetter, 1984; Pitcher, 1988; Fowler, 1989; Schultz, 1990). Other methods for placing time marks on otolith involve stressing the fish at known dates (eg. subjecting fish to total darkness without food for 4 days-Victor, 1982) or producing abrupt changes in increment width by providing larger quantities of food to fish over several days (eg. Struhsaker and Uchiyama, 1976; Victor, 1982). However, neither of these two techniques are unambiguous because the history of natural stresses on the fish is usually unknown (Campana and Neilson, 1985), and a lag time may exist between changes in food intake and changes in increment width (Neilson and Geen, 1985). In some cases, increased food intake apparently does not induce wider otolith increments (Milicich, 1986). In the surgeonfishes and parrotfishes, sequential sampling seems to be unsatisfactory due to protracted spawning seasons (Thresher, 1984). While culturing fish from hatching (thereby obtaining known age of individuals) is often difficult and time consuming, artificially placing a chemical time mark on otoliths is perhaps one of the most convenient methods for validating the periodicity of otolith increments. This chapter was emphasised on establishing an aging method for tropical 17.
(46) juvenile acanthurids and scarids. The detailed purposes included: to examine the otolith microstructure; to determine the periodicity of the otolith increments; and to test the consistency and reliability of increment counts in age estimates.. 3.2 MATERIALS AND METHODS 3.2.1 Juvenile collection Samples of juveniles were collected from the study sites around Lizard Island from December 1987 to February 1990 (see Chapter 2). A total of 69 juvenile. C.binotatus, 30 juvenile C.striatus, 60 juvenile S.rivulatus and 34 juvenile S.schlegeli were sampled. Among them 12 C.binotatus, 2 C.striatus, 21 S.rivulatus and 21. S.schlegeli were collected alive, and used in the validation experiments. Ten pairs of otoliths from each species were also examined for the consistency test in increment counts in this chapter. In addition to the above species, a number of juvenile surgeonfishes and parrotfishes including several other species (see Table 3.1 for details) were also collected for the validation experiments.. 3.2.2 Validation experiments Validation experiments over short periods were conducted in aquarium facilities at the Lizard Island Research Station. A longer experiment was carried out at James Cook University of North Queensland. Otoliths were marked by immersing fish in a solution of tetracycline-hydrochloride and seawater. Prior to these experiments a pilot study had been done to determine concentrations and immersion. times. Three concentrations (250, 300 and 400 mg/1) were tested from 10 to 20 hrs 18.
(47) using Scarus rivulatus of 37 to 61 mm SL. From each concentration and time period combination, otoliths were examined to assess the intensity of fluorescence. A minimum of 300 mg/1 for 12 hrs was found to be necessary for tetracycline to be incorporated into otolith microstructure. Details of validation experiments at Lizard Island are shown in Table 3.1. In the experiment carried out at the University, 20 Scarus schlegeli and 7 S.rivulatus were kept in outdoor aquaria after being marked with tetracycline (300 mg/1, 17 hrs). Several individuals were killed at regular intervals over a period of 56 days. Following validation experiments, both SL (mm) and body weight (WT) to 0.001 g were recorded. Three pairs of otoliths (sagittae, lapilli and asterisci) were extracted, using the technique described by Schneidervin and Hubert (1986), and stored dry, away from light.. 3.2.3 Otolith preparation. Otoliths were prepared in two ways depending on their size. For fish less than 20 mm SL, the lapilli were small and translucent enough that increment definition could be discerned without grinding and polishing. However, the lapilli from the fish greater than 20 mm SL generally required grinding and polishing to reveal the lapillus microstructure. Initially, whole, unground lapilli were mounted in the dibutyl-polystyrenexylene (D.P.X.). The lapillus was placed on a microscope slide, rinsed with ethanol and allowed to dry. The xylene assisted in decreasing the viscosity of the D.P.X. and facilitating the penetration of the mountant into the lapillus. A coverslip was then gently lowered on to the D.P.X. to spread the mountant out evenly. This mounting. 19.
(48) Table 3.1. The details of validation experiments at Lizard Island.. 1st. Immersion. 2nd. Period. Date of Sacrifice. N. Staining. Period. Acanthurus nigrofuscus. 2. 13/12/87. 12 hrs. -. Ctenochaetus binotatus. 2. 13/12/87. 12 hrs. -. Naso annulatus. 2. 13/12/87. 12 hrs. Scarus rivulatus. 13. 04/06/88. 14.75 hrs. 10/06/88. 14 hrs. 17/06/88. Scarus globiceps. 11. 04/06/88. 14.75 hrs. 10/06/88. 14 hrs. 17/06/88. Ctenochaetus binotatus. 4. 04/06/88. 14.75 hrs. 10/06/88. 14 hrs. 17/06/88. Scarus psittacus. 3. 04/06/88. 14.75 hrs. 10/06/88. 14 hrs. 17/06/88. Scarus sordidus. 3. 04/06/88. 14.75 hrs. 10/06/88. 14 hrs. 17/06/88. Scarus schlegeli. 1. 04/06/88. 14.75 hrs. 10/06/88. 14 hrs. 17/06/88. Zebrasoma scopas. 1. 04/06/88. 14.75 hrs. 10/06/88. 14 hrs. 17/06/88. Zebrasoma verliferum. 1. 04/06/88. 14.75 hrs. 10/06/88. 14 hrs. 17/06/88. Ctenochaetus binotatus. 6. 05/06/88. 15 hrs. 10/06/88. 14 hrs. 17/06/88. Ctenochaetus striatus. 2. 05/06/88. 15 hrs. 10/06/88. 14 hrs. 17/06/88. Scarus sordidus. 2. 05/06/88. 15 hrs. 10/06/88. 14 hrs. 17/06/88. Scarus niger. 1. 05/06/88. 15 hrs. 10/06/88. 14 hrs. 17/06/88. Scarus frenatus. 1. 06/06/88. 13.75 hrs. 10/06/88. 14 hrs. 17/06/88. Scarus oviceps. 1. 06/06/88. 13.75 hrs. 10/06/88. 14 hrs. 17/06/88. Species. * All immersion was undertaken over night.. Staining. Immersion -. 25/12/87 25/12/87 25/12/87.
(49) technique produced a high degree of increment resolution within the otolith microstructure of small individuals. This technique had the disadvantage, in that lapilli could not be manipulated or repositioned after mounting. Subsequently, the thermoplastic cement, Crystal Bond, was also found to have excellent optical qualities as a mounting medium. After heating a microscope slide on a hot plate, a small piece of Crystal Bond was then placed on slide. After the cement has melted, a dry lapillus was placed within the cement. Moreover, while the cement was still warm and pliable, the lapillus could be manipulated before the glue hardened. The cement could also be remelted for further manipulation of the otoliths. This technique had the advantage, in that the orientation of the lapilli could be changed within the cement. Crystal Bond was subsequently used as a mountant for otoliths of the larger specimens. Due to its convenience of being able to be remelted, the larger otoliths which required grinding and polishing could be easily manipulated. Furthermore, hardened Crystal Bond was relatively soft which facilitated grinding of the larger otoliths. Larger lapilli were embedded in the thermoplastic cement on a glass and ground by hand with wet 1200 grade carborundum paper. Scratches from the grinding were removed by hand polishing on wet suede with 0.05 Am alumina powder or by using a modified gem polishing machine equipped with a 16 cm rotating disc to which was attached a wet felt (Leco Lecloth) impregnated with alumina powder. Ground lapilli were either held by hand against the rotating polishing disc or lowered onto the disc with a special made microscope slide holding arm.. 21.
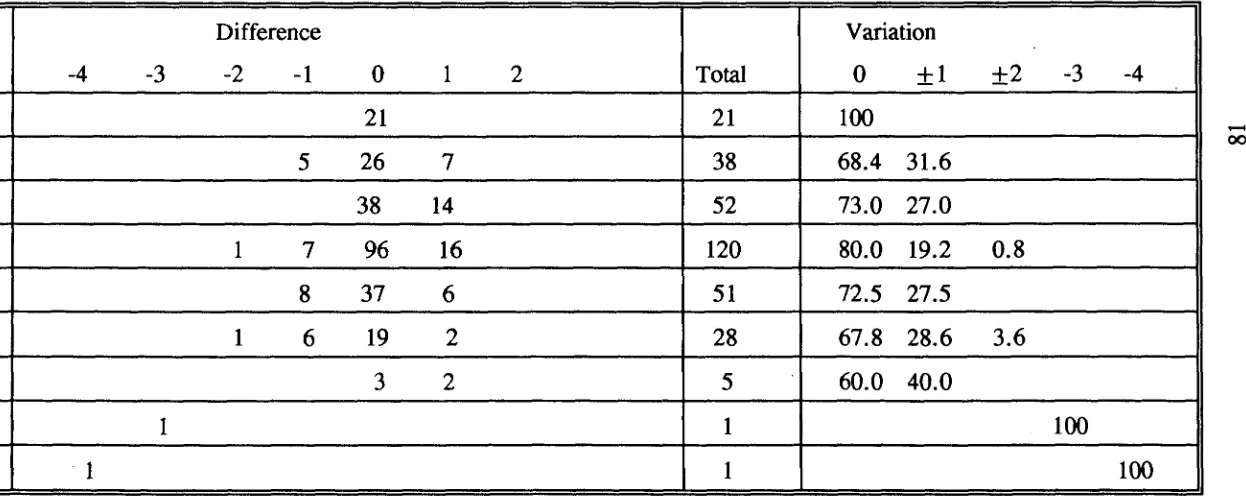
(50) 3.2.4 Otolith increment counting and its consistency test Otolith increments between the characteristic yellow tetracycline fluorescence and the otolith margin were identified and counted under a Leitz microscope (400 x1000 x) equipped with a combination of normal and fluorescent illumination. Fluorescent light was generated from a Ploemopak illuminator with a 50 watt mercury lamp. For individuals with two fluorescent bands, increments were counted from the innermost edge of the first fluorescent band to the innermost edge of the second fluorescent band. Increment counts were only considered valid if identical counts were obtained in two separate readings. Comparisons between the number of days post staining or between the number between the two stainings and actual increment counts were subjected to chi-square test, using the null hypothesis that the number of increments was equal to the number of days elapsed. For the extended University experiment, a linear regression was used to examine the relationship between the days elapsed and the number of otolith increments subsequent to the tetracycline band. Estimated age for each individual fish was taken as the mean of two independent counts of increments in lapilli. Increments were counted using an Olympus compound microscope mounted with an Ikegami ICD-290 high resolution black and white video camera connected to a Commodore-1084 monitor. Counting was facilitated by the use of a movable cursor superimposed over the image of the lapillus. Although no systematic difference in increment number between the left and right sagittae has been reported (Campana and Neilson, 1982; Neilson and Geen, 1982; Geffen, 1982), such an examination has never been applied to lapilli. Consequently, the consistency of increment counts between left and right otoliths was 22.
(51) examined for ten randomly selected pairs of lapilli from the four species,. C.binotatus, C.striatus, S.rivulatus and S.schlegeli. In assessing the similarity in age estimates from left and right otoliths, the difference between two counts for each lapillus was calculated and an average difference calculated for all ten otoliths. A difference in the estimated age for a fish from the left and right lapilli was then calculated and averaged. The average difference in estimated age obtained between the lapilli was compared with the average difference from multiple counts of the left or right lapilli. If the average difference between multiple lapillus increment counts was similar to (using 95% confidence limits) or larger than the average difference between left and right lapilli then the estimating age of an individual from either lapilli was considered acceptable. It is possible to obtain an indication of observer bias in age estimates by utilising several observers (Kimura and Lyons, 1990). To examine the precision of age estimates the left lapilli were counted by two experienced independent readers. The similarity of age estimates from different readers was treated as described for the left and right otoliths.. 3.3 RESULTS 3.3.1 General structures. Sagittae of parrotfishes and surgeonfishes were thick and had a complex three-dimensional shape. Due to the limited depth of field for one plane of focus, some increments were not discernible from the nucleus to margin even though the otolith was ground and polished. The asterisci had distinct fine growth increments which could be seen under a light microscope without grinding. However, due to its. 23.
(52) relatively small size, extraction and mounting was difficult. In contrast, the lapilli not only had the most distinct growth increments but were also relatively easy to extract (Plate 3.1a,b). Therefore, the lapillus was selected to use for aging juvenile parrotfishes and surgeonfishes. Lapilli generally have similar morphological features within the same families. lapilli of surgeonfishes are bell-shaped with the nucleus located at the centre of dorsal dome (Plate 3.1a). Growth increments were most visible in the sulcal region. In parrotfishes, lapilli are usually round (Plate 3,1b) , with the nucleus located close to the centre near the dorsal surface. Growth increments were clearly seen in all regions except for the dorsal area. Fine growth increments on the lapilli were bipartite in structure, consisting of incremental and discontinuous zones. Under the transmitted light, the incremental zone appeared as a broad, translucent band, while the discontinuous zone was relatively narrow and opaque (Plate 3.1c). lapillus increments in surgeonfishes were wider near the nucleus and narrow near the margin while the increment width was relatively consistent from the nucleus throughout the margin in parrotfishes.. 3.3.2 Validation of daily otolith increments Otoliths of fish immersed in tetracycline showed a bright fluorescent band medial to the edge. This band appeared to cover approximately three growth increments. The double marked otoliths displayed two bright fluorescent bands (Plate 3.2a,c), the outer band was close to the otolith edge, and overlapped by autofluorescence around the otolith margin. Such autofluorescence has been noted by Campana and Neilson (1982). The lapillus increments between tetracycline bands 24.
(53) Plate 3.1 Microstructure of lapilli of the juvenile surgeonfish and parrotfish. D - discontinuous zone; I - incremental zone; N - nucleus. a. The lapillus of. Ctenochaetus binotatus (SL = 28 mm, scale bar=100 Am). b. The lapillus of Scarus schlegeli (SL = 21 mm, scale bar=100 Am). c. The structure of daily increments in lapillus of C.binotatus (SL= 28 mm, scale bar=20 Am).. 25.
(54) C r► ..
(55) Plate 3.2 Validated daily increments on the lapilli of surgeonfishes. a,c Fluorescent micrographs of lapilli from a 30 mm SL Ctenochaetus binotatus (a) and a 36 mm SL C.striatus (c) marked twice with tetracycline 6 days apart. b,d light micrographs of the same lapilli. Arrows indicate tetracycline bands (scale bar = 50 tn).. 26.
(56)
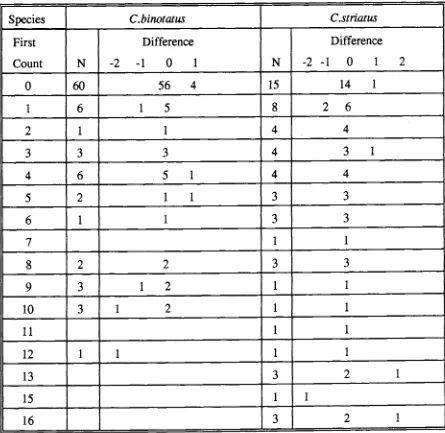
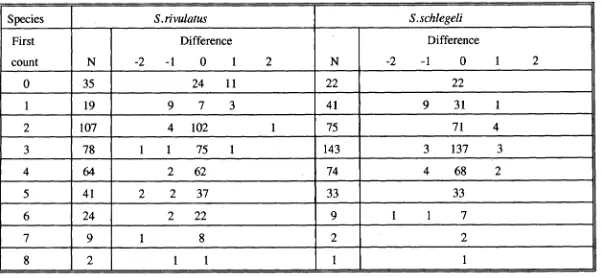
(57) were visible under transmitted light (Plate 3.2b,d). In the validation experiments at Lizard Island, Chi-square tests indicated that there was no significant difference between the number of chronological days subsequent to or between treatments and the number of increments deposited for. Scarus rivulatus, S.globiceps, S.sordidus, S.psittacus, Ctenochaetus binotatus, C.striatus, Acanthurus nigrofuscus and Naso annulatus (Table 3.2). No test was carried out for S.frenatus, S.niger, S.oviceps, S.schlegeli, Zebrasoma scopas and. Z.veliferum because only one specimen was examined for each species. However, the number of increments was equal to the number of chronological days for these six species. Of 50 individuals marked twice with tetracycline, forty-three deposited daily otolith increments. The other seven individuals had one less or one more increment compared to the chronological days between treatments. In the single tetracycline marking experiment (n = 6), however, three specimens deposited one less increments than the chronological days subsequent to treatments. Fish stained twice with tetracycline had a high percentage of agreement between the number of increments produced and the number of chronological days. In contrast, fish stained once had a relatively low percentage in agreement between the increment number and number of chronological days because increment counting became increasingly difficult at the margin of the lapillus. The validation experiment carried out in the University aquarium system demonstrated that parrotfishes from two species consistently deposited daily increments over a period of 11 to 56 days (Plate 3.3; Fig. 3.1). The slopes of the regressions were not significantly different from one, since the 95% confidence limits 27.
(58) Table 3.2. Results of Chi-square tests of the validation experiments at Lizard Island.. Days - chronological days subsequent to or between treatments. Counts - otolith increments between fluorescent bands or subsequent to fluoresent band. None were significantly different at p< 0.05. Species. N. Range SL (mm). Mean of counts (±s.d.). No. days. Chi-square. p. S.rivulatus. 13. 37 - 63. 6.07 (0.26). 6. 0.0705. 1. C.binotatus. 12. 26 - 48. 11.5 (0.5), 6 (0.7), 5.16 (0.27). 12,6,5. 0.3022. 1. S.globiceps. 11. 44. 52. 6.09 (0.51). 6. 0.2372. 1. S.sordidus. 5. 25 - 53. 6 (0), 5 (0). 6,5. 0.0000. 1. S.psittacus. 3. 50 - 52. 6 (0). 6. 0.0000. 1. C.striatus. 2. 36 - 47. 5 (0). 5. 0.0000. 1. A.nigrofuscus. 2. 35 - 43. 11.5 (0.5). 12. 0.0221. 0.881. N.annulatus. 2. 29 - 36. 11.5 (0.5). 12. 0.0221. 0.881. -. 00 (NI.
(59) Fig. 3.1 Regressions of otolith increments counted against number of days for individuals maintained after tetracycline staining.. 29.
(60) ❑. No. of increments. 10. 20. S rivulatus. A S. schlegeli. Y=0,95X-0.125 r"2 = 0,99 n=7. r"2 = 0.99. 30. Y=0.987X-1,21. n = 20. 40. Days after immersion. 50. 60.
(61) Plate 3.3 Validated daily increments on the lapilli of parrotfishes. a,c Fluorescent micrographs of lapilli from a 41 mm SL Scarus schlegeli (a) and 21. mm SL S.rivulatus (b), which were sacrificed 41 and 11 days respectively after tetracycline staining. b,d Light micrographs of the same lapilli. Arrows indicate tetracycline bands (scale bar = 50 Am).. 30.
(62)
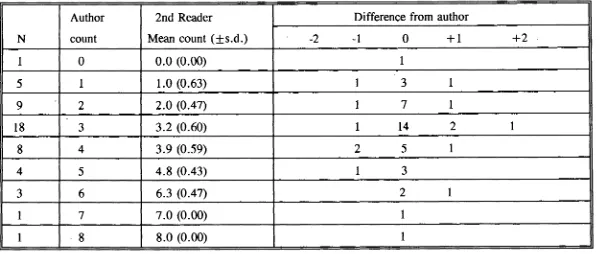
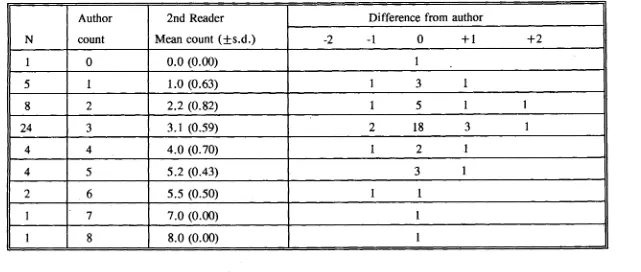
(63) for both Scarus rivulatus (0.942-1.03) and S.schlegeli (0.89-1.01) included one. Further confirmation of this trend would require a larger sample size.. 3.3.3 Consistency test in increment counting The average difference between multiple counts of each pair of left and right lapilli was found to be less than that difference between multiple readings of each lapillus for all four species (Table 3.3). It was therefore considered that the difference in estimating age obtained from the two lapilli was acceptable. Either the left or the right lapilli can be used to estimate age. In assessing observer differences in estimating age it was found that for. C.striatus, S.rivulatus and S.schlegeli the average difference in replicate counts by both readers was greater than the average difference between the two readers (Table 3.4). For Ctenochaetus binotatus reader 2 had a greater mean difference than between the two readers (Table 3.4). It was therefore concluded that the differences between the readers for the four species were acceptable. The variation in counts by an observer was predominantly due to lapilli which were difficult to read. In addition, the difficulties in changing focus and in counting increments near the nucleus and close to the margin would have contributed to the variation.. 3.4 DISCUSSION Lapilli have been used in many studies of age determination for coral reef fishes (e.g. Victor, 1982; Pitcher, 1988; Fowler, 1989). Agreement in the number of daily increments between sagittae and lapilli has been found in many tropical 31.
(64) Table 3.3 Results of ring counts between left and right otoliths. MD. -. mean difference; CL - confidence limits.. Species. S.rivulatus. S.schlegeli. C.binotatus. C.striatus. Otolith. N. Range age (day). Left. 10. 100 - 227. Right. 10. Between. MD. Range MD %. 95% CL. 9.6. 2.1 - 8.3. +/-8.4. 93 - 217. 8.5. 2.0 - 8.2. +/-7.0. 10. 93 - 227. 5.3. 1.0 - 5.3. +/-6.0. Left. 10. 83 - 165. 8.2. 1.3 - 5.0. +/-4.8. Right. 10. 85 - 170. 7.0. 1.4 - 4.0. +/-4.8. Between. 10. 83 - 170. 2.4. 0.0 - 3.9. +/-3.6. Left. 10. 69 - 121. 7.6. 1.4 - 5.2. +/-5.5. Right. 10. 72 - 119. 6.9. 1.6 - 4.8. +/-3.7. Between. 10. 69 - 121. 2.5. 0.8 - 4.8. +/-2.5. Left. 10. 81 - 202. 7.2. 3.4 - 7.9. +/-6.1. Right. 10. 87 - 206. 7.5. 4.0 - 8.0. +/-5.0. Between. 10. 81 - 206. 5.4. 0.5 - 9.1. +/-5.5.
(65) Table 3.4 Results of otolith ring counts between readers. MD. -. mean difference; CL - confidence limits.. Species S.rivulatus. S.schlegeli. C.binotatus. C.striatus. Reader. N. Range age (day). MD. Range MD %. 95% CL. Reader 1. 10. 95 - 200. 7.1. 1.8 - 10.8. +/-6.0. Reader 2. 10. 98 - 227. 9.6. 2.1 - 8.3. +/-8.4. Between. 10. 95 - 227. 6.3. 0.9 - 9.0. +/-12.4. Reader 1. 10. 72 - 166. 7.4. 0.0 - 12.9. +/-10.2. Reader 2 -. 10. 83 - 165. 8.2. 1.3 - 5.0. +/-4.8. Between. 10. 72 - 166. 7.3. 0.6 - 14.9. +/-11.7. Reader 1. 10. 73 - 125. 2.9. 1.2 - 5.4. +/-2.7. Reader 2. 10. 69 - 121. 7.6. 1.4 - 4.9. +/-5.5. Between. 10. 69 - 125. 5.4. 2.0 - 11.7. +/-5.9. Reader 1. 10. 87 - 189. 7.1. 3.6 - 8.7. +/-3.7. Reader 2. 10. 82 - 202. 7.2. 3.4 - 7.9. +/-6.1. Between. 10. 82 - 202. 7.0. 2.5 - 8.6. +/-5.0.
(66) species, for example, Mugil cephalus (Radtke, 1984) and Plectroglyphidodon. lacrymatus (Polunin and Brothers, 1989). Furthermore, lapilli have been preferentially used in larvae and juveniles of some species (Brothers et al., 1983; Fowler, 1989). These studies suggested that lapilli should be useful aging structures.. 3.4.1 Daily otolith increments. Generally, the deposition rates published in the literature for juvenile coral reef fishes tend to be close to one-ring-per-day (Brothers and McFarland, 1981; Victor, 1982; Pitcher, 1988; Fowler, 1989). When viewed under transmitted light, lapilli of surgeonfishes and parrotfishes display clear bipartite structures, which are similar to that described by Pannella (1971, 1974), Campana and Neilson (1985) and Fowler (1989). The lack of daily increment periodicity within the lapilli of few individuals in this study has also been observed in other validation studies of juvenile fish in the G.B.R. (Schmidt, 1984). This apparent difference may be partially due to the time for tetracycline to be incorporated into the growing otoliths. It is not known how long tetracycline apply to the otoliths of the parrotfishes and surgeonfishes. Campana and Neilson (1982) found that after injection, 50% of fish showed fluorescent otoliths after 10 hrs and 100% after 24 hrs. If this assumption is applicable to species in the present study, then a fluorescent band probably started to form 12 to 24 hrs after immersion. Since the discontinuous zone is thought to be formed daily from about 07:00 to 10:00 am in Hypoatherina tropicalis and Spratelloides dellicatulus caught near Lizard Island (Schmidt, 1984), increments counted on some individuals stained once were probably deposited one day after immersion. 34.
(67) The effect of tetracycline on otoliths may also influence the increment depositing rates. Tetracycline may inhibit mineralisation in scales and bone (Harris, 1960; Kobayashi et al., 1964). Since other studies have recorded no adverse effects of tetracycline on growth or mineralisation (Weber and Ridgway, 1967), it was not considered to be of importance in this study. Evidence from this research for daily periodicity of otolith growth increments, from chemical marking experiments, now exists for 83 individuals out of 14 species of tropical coral reef fishes (6 acanthurids and 8 scarids). Similar results were found in other tropical coral reef fish on the GBR (Pitcher, 1988; Fowler 1989). The juveniles of tropical species in this study provide further evidence for the one-ring : one day hypothesis, suggesting that daily otolith growth increments are a widespread phenomenon among young tropical teleost species. Obtaining accurate age estimates from young coral reef fishes has proven to be valuable to the understanding of their earlier biology. Important biological and demographic parameters can be ascertained by using otolith growth increments. However, the results obtained are only tentative until the periodicity of the increments can be validated. Since these validation experiments were carried out in artificial laboratory conditions, it can only be assumed that otolith increment periodicity which has been observed in the species of this study are similar to what occurs in the natural environment. Furthermore, the size range of each species validated was limited. Therefore, it is necessary to increase the sample size of validated individuals to extend age validation work beyond the scope of preliminary findings.. 35.
(68) 3.4.2 Counting procedure Gjosaeter et al. (1985) pointed out that if a reader is accurately reading the otolith, but there are larger differences in estimates between readers, the number of counters should be increased. For these species examined in this study, the difference in otolith increment counts between observers was smaller than or within 95% confidence limits of the difference between multiple counts by the same observer. Therefore, counts involving several persons may in principle appear unnecessary. However, increasing multiple counts of each otolith may be considered necessary in order to increase precision of the age estimate. Otolith growth increment analysis promises to be the most useful method for estimating juvenile age. However, this technique is only of value when it can be assured that there is a high level of accuracy in the increment counts. My test on increment count systematically addressed the degree of variation in age estimates between both otoliths and observers. To avoid such counting bias, replicate counts should be made for each otolith to provide estimates of variance in increment number. In addition, only a limited deviation between replicate counts should be accepted if age estimates are to be considered valid. In conclusion, daily otolith growth increments can be found in juvenile surgeonfishes and parrotfishes. These increments can be used in age estimates for juveniles. However, the accuracy of such estimates is largely dependent upon counting procedure. It is recommend that the degree of variation in increment counting should systematically be addressed before using this aging method, and that replicate counts with a standard deviation should be made for each otolith to improve the precision of age estimates for tropical coral-reef fish. 36.
(69) CHAPTER 4. VALIDATION OF AGEING TECHNIQUES FOR ADULT ACANTHURIDS AND SCARIDS. 4.1 INTRODUCTION Length frequency analysis, tag-recapture and direct aging from the hard anatomical structures are three basic techniques for providing information on the age and growth of fishes (Ricker, 1979). Of these, the later is the preferred approach as it is least prone to subjective interpretation and tagging artefacts (Brothers, 1982). In temperate waters, fisheries management largely relies on this technique for aging, and the otoliths have emerged as the anatomical structure most-often used (Pentilla and Dery, 1988). Aging tropical fishes based on their hard anatomical structures has not shared the same success as that experienced in temperate regions (Pannella, 1980; Longhurst and Pauly, 1987). This has been attributed to a lack of a discernible or interpretable pattern in structures such as the otoliths, which has been related to equitable growth in the supposed seasonal environment of the tropics (Pannella, 1980; Brothers, 1982). However, observations for some species of the families Lutjanidae (Johnson, 1983; Manooch, 1987), Sciaenidae (Poinsard and Troadec, 1966), Pomacentridae (Fowler, 1990), Serranidae and Lethrinidae (Loubens, 1978; McPherson et al., 1988) have indicated that annuli may occur more frequently in tropical reef taxa than was previously thought (Longhurst and Pauly, 1987). Aging and growth works up-to-date have mainly focused on large, carnivorous commercially important species (Radtke, 1987; McPherson et al., 1988; Dee and Radtke, 1989). However, many groups of herbivorous reef fishes are 37.
Figure
+7
Related documents
(2) Builder/ Warrantor Responsibility: Repair and/or caulk joints or cracks in exterior wall surfaces as required to correct deficiency one time during the first year of the
CES-D - Center for Epidemiologic Studies Depression Scale, TAU - Treatment As Usual, FIQ – Fibromyalgia Impact Questionnaire, VAS- Visual Analogue Scale, MOS-PF
In conclusion, the finding shows that Njala University, Njala Campus (NUNC) athletes were experienced in the knowledge of prime prevention strategy in slowing the
Conclusion: the results indicate that Njala campus athletes did display professional experience about primary prevention strategic knowledge of minimizing the process of ageing
Analysis of results from non-usage of drugs like cigarette smoking, alcohol consumption and performance enhancing drugs, shows two third of significance
Context/Objective: To examine the effect of Surface Spinal Stimulation with varied beat frequency on muscle fibre recruitment in lower limb in Incomplete Spinal Cord
A study conducted by Su et al (1994) reported that the greatest mean value of grip strength was found when shoulder was positioned in 180º of flexion with elbow in
The analysis of data shows that the male hockey players performed better in vertical jump test parameters like the squat jump flight time, squat jump height, counter
