1317
SPATIAL SCALE, SPECIES DIVERSITY, AND HABITAT STRUCTURE:
SMALL MAMMALS IN AUSTRALIAN TROPICAL RAIN FOREST
STEPHENE. WILLIAMS,1,4HELENE MARSH,2ANDJOHNWINTER3
1School of Tropical Biology/Rain forest CRC, James Cook University of North Queensland,
Townsville, Queensland 4811, Australia
2School of Environmental Studies and Geography, James Cook University, Townsville, Queensland 4811, Australia 3P.O. Box 151, Ravenshoe, Queensland 4872, Australia
Abstract. We investigated patterns of mammal assemblage structure on the Atherton Tableland in the Wet Tropics biogeographic region of northeastern Australia. We used live trapping and quantitative estimates of stratified vegetation density to examine the relation-ships between the structure of the mammal assemblage and habitat structure over three nested spatial scales across a natural vegetation gradient from rain forest to dry, open forest. The narrow transition zone enabled us to examine the relationships between mammal as-semblage structure and habitat structure while minimizing the confounding effects of dis-tance, climate, and biogeographic history. The structure of the mammal assemblages was closely related to vegetation structure across and within habitats, and over all spatial scales examined. Vegetation complexity and heterogeneity both influenced assemblage structure, but the relationships varied with spatial scale. Species richness was highest in the open forest and decreased across the gradient into the rain forest. Point diversity was only weakly explained by vegetation structure, whereas .80% of the variation in species richness at the local scale could be explained by vegetation structure. Local-scale species richness of ground-dwelling mammals was mostly a product of the spatial variability in assemblage structure (bdiversity), which was associated with the spatial variability in vegetation struc-ture. Local-scale habitat heterogeneity thus promoted local-scale species richness via the close ecological interaction between mammals and habitat structure. The multiscale ap-proach used here, and the nesting of spatial variability in within-habitat vegetation structure, enabled us to demonstrate the scale-dependent effects of spatial habitat heterogeneity and complexity on the structure and diversity of the small-mammal assemblage.
Key words: assemblage structure; Australia; diversity; ecotone; gradients; habitat complexity; habitat heterogeneity; patchiness; rain forest; small mammals; spatial scale; vegetation structure.
INTRODUCTION
Determining the factors that generate and maintain patterns of assemblage structure and diversity is a fun-damental topic in ecology (e.g., MacArthur and Mac-Arthur 1961, Ricklefs 1987, Ricklefs and Schluter 1993, Rosenzweig 1995, Gaston 2000). Developing an integrated theory of the determinants of assemblage structure requires comparative research on community patterns over a range of spatial scales and the consid-eration of the interfaces between the traditional ‘‘local’’ approach (niche theory) and the related fields of evo-lutionary biology, genetic diversity, phylogeography, landscape ecology, biogeography, and unique events that may have affected the evolution of the assemblage in question (Ricklefs 1987, Wiens 1989a, Schluter and Ricklefs 1993, Southwood 1996).
Attributes of assemblages are highly dependent on the scale at which they are examined (Whittaker 1972, Ricklefs 1987, Caley and Schluter 1997, Angermeier and Winston 1998, Hughes et al. 1999). Scale has been
Manuscript received 9 November 2000; revised 25 June 2001; accepted 27 June 2001; final version received 13 August 2001.
4E-mail: stephen.williams@jcu.edu.au
Biogeographic history has had a huge influence on the regional patterns of vertebrate assemblage structure in the rain forests of the Australian Wet Tropics (Winter 1988, Williams 1997, Williams and Pearson 1997). The regional fauna has a long and complicated history of exchange with both the surrounding sclerophyll forests and the rain forests on Cape York and New Guinea (Schodde and Calaby 1972, Winter 1988). Contractions of rain forest during the Quaternary probably have been the most significant influence on assemblage structure: the guilds present, the species packing within guilds, the proportion of regional endemism, and the total spe-cies richness of the mammals (Williams 1997, Williams and Pearson 1997). Genetic analyses suggest that most speciation pre-dates the Quaternary (Schneider et al. 1998), although there are several examples of more recent allopatric speciation (Winter 1997). Patterns of within-population genetic similarity suggest that re-colonization after localized extinctions during contrac-tion episodes also has had significant effects (Schneider et al. 1998). However, analyses at the regional scale can only infer processes responsible for the subregional or landscape species pool. Local assemblage structure is a product of the balance between local ecological interactions and the available regional species pool (Wiens 1989b, Levin 1992).
At least seven types of processes may contribute to assemblage structure (Schluter and Ricklefs 1993), three of which operate at the spatial scale of landscapes or smaller. First, the movement of individuals within a habitat may contribute to the spatial and temporal variability in local assemblages. Second, the movement of individuals between habitats, such as the mass effect, may inflate species richness by adding species that are essentially transient and incapable of permanent col-onization (Gaston 1996, Southwood 1996). Third, local ecological interactions such as species-specific re-sponses to habitat, habitat diversity, competition, pre-dation, and disturbance may limit species richness (Wiens 1989a).
The focus of our paper is the multiscale interactions between the structure of the small-mammal assemblage and habitat structure. Within the limitations set by the regional species pool, local diversity is determined by the ‘‘habitat capacity,’’ the habitat area and the length of time over which the environment has been relatively stable (Southwood 1996). Habitat capacity is the prod-uct of prodprod-uctivity and both spatial and temporal hab-itat heterogeneity (Southwood 1996). There is general agreement in the literature that habitat heterogeneity is related positively to diversity, but no general rule exists for the relationship between productivity and diversity. Habitat heterogeneity can have many dimensions, but all dimensions affect either the architectural com-plexity or the spatial and temporal heterogeneity of the habitat (Southwood 1996). Considerable research has been conducted on the relationships between habitat structure and mammal assemblage structure (e.g.,
M’Closkey 1976, Fox 1981, August 1983, Shenbrot et al. 1994, Williams and Marsh 1998, Fox and Fox 2000). Generalities have been elusive, however, and some re-searchers have cast doubt on the validity of applying findings from local-scale studies to larger spatial scales (Ricklefs 1987, Levin 1992, Ricklefs and Schluter 1993, Marquet 1994, Hughes et al. 1999). Studies have had mixed success in finding significant relationships between habitat structure and faunal diversity, and an inappropriate spatial scale of comparison has been cited as a potential problem (Rosenzweig 1995, Westoby 1998). Therefore, studies should address ecological in-teractions occurring at the local scale as well as the interface between processes at local and broader scales, and should consider both the variability in assemblage structure and the spatial scale of this variability.
We examined local-scale patterns of mammal assem-blage structure on the southern Atherton Tableland, Wet Tropics biogeographic region, northeastern Australia. The Atherton Tableland has the highest mammal di-versity in the region, and probably in Australia (Wil-liams et al. 1996), and provides an ideal environmental gradient along which to study the interactions between habitat structure and the mammal assemblage. From east to west, there is a gradient from a complex veg-etation structure (notophyll vine forest) to a simpler vegetation structure (open eucalypt woodland), within a distance of only 5 km. The boundary between the closed forest and the open forest is abrupt, with a com-plete transition from closed to open forest often oc-curring within 50 m. Because all sites included in our study were #10 km apart, confounding influences as-sociated with climate, topography, or biogeographic history are minimized. Given the dispersal ability of the species present, all species have the potential to be present throughout the study area within the limits of their individual habitat tolerances. Thus, all sites share the same biogeographic history and potential species pool, so differences in assemblage structure should re-flect processes mainly at the local and landscape scales. We wished to determine the effects of vertical com-plexity and spatial heterogeneity of vegetation on the assemblage structure of forest mammals over several spatial scales, and then to relate these patterns to the regional patterns of mammalian assemblage structure discussed in previous papers (Williams 1997, Williams and Pearson 1997). Specifically, we asked: (1) Can the spatial patterns in the structure of the mammal assem-blage (composition, abundances, diversity, biomass, numbers of individuals) be explained by vegetation structure? (2) What are the relative influences of habitat complexity and spatial heterogeneity on mammal as-semblage structure? (3) Are the effects of habitat struc-ture consistent across different spatial scales?
METHODS
north-TABLE1. Habitat type and vegetation classification of each site.
Site
Habitat
type† AMG‡ Vegetation classification§ Altitude (m)
A IRF 0343300/8042300 notophyll vine forest (8 and 9) 920
B ERF 0340700/8042700 notophyll vine forest withAcacia, Eucalyptus, and Agathis
emergents (5a and 13c)
1000 C WS 0338300/8042400 tall, open forest often with an understory of rain forest shrubs
(13c and 14 mix)
960
D DS 0337300/8042300 medium open forest (14 and 16 mix) 945
E IRF 0345100/8038100 complex notophyll vine forest (5a) 850
F ERF 0343700/8033300 notophyll vine forest withAcacia, Eucalyptus, and Agathis
emergents (5a and 13c)
740 G WS 0340700/8042100 tall, open forest with mixedE. grandis, Allocasuarina, and
bloodwoods (13c and 14 mix)
980 H DS 0343100/8033200 medium open forest with bloodwoods andAllocasuarina (16) 730
† Abbreviations: IRF, interior rain forest; ERF, edge rain forest; WS, wet sclerophyll; DS, dry sclerophyll. ‡ AMG, Australian Map Grid reference for approximate center of site (easting/northing).
§ Vegetation classifications, including numbered structural rain forest types in parentheses, follow Tracey and Webb (1975).
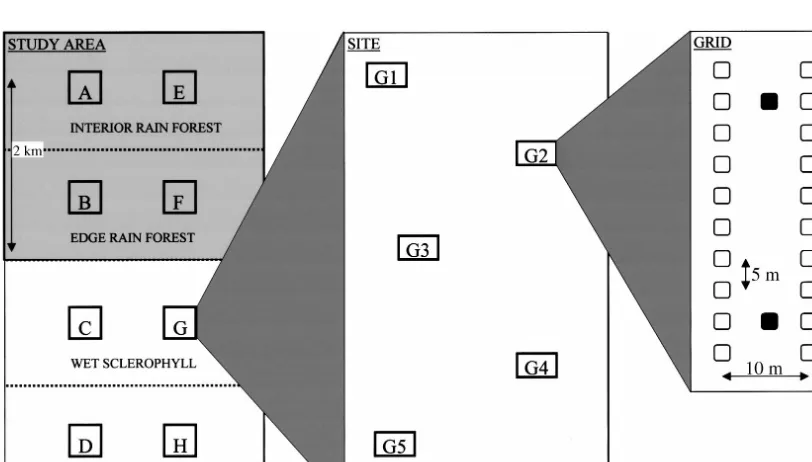
FIG. 1. Schematic diagram of the sampling design for our study of mammal assemblage structure. The study area box shows the placement of sites within habitat types (the shaded area is closed forest). The expanded site box shows an approximate layout of the five trapping grids. The expanded grid box shows the layout of traps within a grid (open squares represent Elliot traps, and solid squares are wire cage traps). This diagram is schematic and not to scale.
eastern Australia (178509 S, 1458329 E) at an altitude of 740–1000 m. Rainfall in the study area is ;2500 mm/yr, with a pronounced wet season between January and April. The Atherton Tableland contains the largest area of upland rain forest within the Wet Tropics (Bell et al. 1987, Williams et al. 1996) despite the extensive clearing that has occurred over the last 150 yr. This area is believed to have contained the largest area of refugial rain forest during the Pleistocene climatic fluc-tuations (Webb and Tracey 1981, Nix and Switzer 1991), although evidence from charcoal deposits within rain forest soils suggests that the refugia were frag-mented and discontinuous (Hopkins et al. 1993, 1996). Our study area was situated within continuous forest
that had not been subject to clearing. Vegetation clas-sifications and rain forest structural types (Tracey and Webb 1975) for all sites are listed in Table 1.
We selected four broad habitat types to represent the main changes along the vegetation gradient: interior rain forest, sites A and E (IRF, notophyll vine forest
[image:3.612.88.494.442.673.2]types. The two sites in each habitat were$5 km apart to ensure independence. The driest sites (D and H) were far enough along the gradient to have no species of rain forest specialists.
Previous studies (Williams 1990, Laurance 1994, Williams and Marsh 1998) have shown that the vertical stratification of foliage density is significantly related to the structure of small-mammal assemblages in the rain forests of the Wet Tropics. Therefore, trapping grids were placed to include as much variability in the vegetation structure as possible within each site. Five grids were established at each site with $100 m be-tween adjacent grids (Fig. 1). Each grid consisted of 20 small-mammal traps (Elliott type A, Elliot Scien-tific, Upwey, Victoria, Australia) and two wire-cage traps (30330360 cm, folding, treadle type; Mascot Wire Works, Enfield, New South Wales, Australia). Traps were set in two parallel lines 10 m apart with 10 Elliot traps (5 m apart) along each line (Fig. 1). The two cage traps were placed between the lines at the second trap in from each end. Traps were baited with a mixture of rolled oats and vanilla essence. Traps were checked and rebaited each morning for four nights at each site on each census. All animals caught were iden-tified, tagged with individually numbered monel ear tags, weighed, and released at the trap site. All sites were sampled in April 1992, August 1992, November 1992, March 1993, and June 1993. The sampling design was nested spatially to allow the examination of as-semblage patterns over a range of hierarchical spatial scales. Relative abundances were measured as the num-ber of individuals of each species trapped at a grid over the four-night census.
Habitat structure was described at each of the 40 trapping grids (five grids at each of the eight sites). Vegetation structure was described quantitatively at five points 10 m apart along a line through the long axis of each trapping grid. At each point, the vegetation density within a 5 m radius was estimated in five ver-tical strata (ground cover 0–1 m; low shrubs 1–2 m; shrubs 2–5 m, subcanopy, and canopy) on an eight point scale (0, absent; 1, present (;1%); 2,#5% cover; 3, 5–25%; 4, 25–50%; 5, 50–75%; 6, 75–95%; 7, 95– 100%). These measurements of vegetation density were used to derive estimates of vegetation complexity and heterogeneity. Complexity relates to the vertical de-velopment of vegetation strata, whereas heterogeneity or patchiness refers to the horizontal variability in structure (August 1983). One grid (G5) was removed from all analyses relating to vegetation structure be-cause the vegetation on the grid was burned before the vegetation measurements were taken. Three spatial scales were examined (Fig. 1). At thepoint scale, each
trapping grid was considered to be a point sample; at thelocal scale, a site was;1 km across and included five trapping grids; at the landscape scale, the sites
were distributed across the primary habitat gradient over a distance of;4 km, with the two transects (each
of four sites) ;5 km apart. The landscape thus con-sisted of;25 km2.
We used multidimensional scaling (MDS) to reduce the number of factors describing the structure of the vegetation and the species composition and relative abundances of the small-mammal assemblage at each trapping grid. MDS is strongly recommended as an ecological ordination technique because of its lack of assumptions about the distribution or type of data and because of its general robustness (Schiffman et al. 1981, Minchin 1987). The mean of the MDS scores from all five trapping grids in a site provided a measure of the mean assemblage structure (or vegetation struc-ture) of the site. Additionally, the standard deviation of the MDS scores provided a measure of the spatial variability in assemblage structure within the site, that is, an index ofbdiversity that incorporates both species presence and their relative abundance. The distance measure used in the MDS analyses was euclidean dis-tance, and variables were standardized between 0 and 1 (each value divided by the maximum value for that variable).
The trapping methods were designed to minimize bias due to variability in the relative ‘‘trappability’’ of each species. Each grid was treated as a point sample, thereby smoothing out some of the fine-scale stochastic variation that occurs when individual trap stations are used as the unit of analysis. Saturating the grid with traps (5-m trap spacing) meant that traps were always available for species that are rare or less trappable (the highest number of captures in a single night during the study was 11 animals in the 22 traps on a grid). Using the number of individuals over four nights of trapping reduced the extreme species bias on recapture estimates produced by the high degree of ‘‘trappability’’ of some species (e.g., Melomys cervinipes or Rattus fuscipes)
or highly unequal abundances.
Rattus fuscipes and R. leucopus, two sympatric rat
species in the study area, are difficult to distinguish without examining their skulls. Hair samples were tak-en from several hundred individuals in an attempt to identify these species. Analyses of hair suggested that
R. leucopus was rare in the study area (two records in
;300 samples). Because all individuals could not be positively identified, records of these two species were combined in the analyses, but the majority of the in-dividuals were probablyR. fuscipes.
RESULTS
Vegetation structure
Point scale.—Multidimensional scaling (MDS),
pos-FIG. 2. Multidimensional scaling (MDS) plot of the veg-etation (VegMDS axis 1 and axis 2) at 39 trapping grids based on the density of vegetation in five vertical strata at eight sites (A–H). Grid G5 was removed from analysis due to fire. The four habitat types are interior rain forest (IRF), dark shading; edge rain forest (ERF), light shading; wet sclerophyll (WS), crossed; and dry sclerophyll (DS), open symbols.
TABLE2. Correlations between each of the variables (strat-ified vegetation density) used in the multidimensional scal-ing (MDS) analysis describscal-ing vegetation structure at 39 trapping grids and the MDS scores for each axis shown in Fig. 3.
Variable
VegMDS 1
r P
VegMDS 2
r P
0–1 m 1–2 m 2–5 m Subcanopy Canopy
20.926
20.083 0.488 0.887 0.847
,0.001 0.609 0.001
,0.001
,0.001
20.158
20.850
20.782
20.164 0.177
0.330
,0.001
,0.001 0.312 0.275
itively with the density of tall shrubs, subcanopy, and canopy (Table 2). The position of a grid along this gradient is essentially a measure of where this grid lies on the main gradient from open forest to rain forest. A further 7% of the variance in vegetation structure was described by the second MDS axis (VegMDS 2), which was correlated with the density of the shrub strata between 1 and 5 m (Table 2).
Local scale.—Vegetation complexity, as indexed by
the mean of the first MDS axis scores of the five grids in each site, was lowest in the dry sclerophyll, in-creased in the wet sclerophyll, and was highest in the rain forest (Table 3). We did not find a consistent trend in complexity between edge rain forest and interior rain forest (Table 3). Three of the four rain forest sites had similar levels of complexity (A, B, F), whereas site E had considerably more complex vegetation. Vegetation structure was more heterogeneous (higher standard de-viation of first MDS axis scores) in the open forest sites than in the rain forest (Table 3). The second vegetation MDS axis separated the sites within open and closed forests primarily by the density of the shrub layer (Ta-ble 3), but there is no clear separation on this axis between interior and edge rain forest. Wet sclerophyll sites (C and G) had a more complex (mean VegMDS 2) and heterogeneous (standard deviation VegMDS 2) shrub layer than the other sites (Table 3).
Landscape scale.—Vegetation structure changed
dramatically across the gradient from rain forest to open forest, with canopy and subcanopy density sig-nificantly decreasing and ground cover sigsig-nificantly in-creasing (Fig. 3). There was no significant trend in low-shrub (1–2 m) density and low-shrub (2–5 m) density, al-though the density of low shrubs in the wet sclerophyll was higher than that in the other three habitats.
Mammal assemblage structure
Point scale.—Analysis of the small-mammal
assem-blage structure at each of the 40 trapping grids, using multidimensional scaling, showed that assemblage structure changed over relatively continuous gradients in vegetation structure (Fig. 4) rather than as discrete assemblages in each of the four habitats. The first MDS axis represented a gradient in assemblage structure across the main habitat gradient from rain forest to open forest and explained 69% of the variance in assemblage structure (Fig. 4). The abundances of all 11 species of small mammals were correlated with this gradient (Ta-ble 4), indicating that no species was equally abundant across the gradient. Species were primarily associated with either open forest or closed forest. Therefore, in-terpretation of the second MDS axis (16% of the var-iance) was difficult because the gradient of change along this axis was produced by different species in open and closed forest (Table 4, Fig. 4). To examine the two within-habitat gradients in assemblage struc-ture, we correlated only the abundances of species re-corded in each habitat with scores on the second MDS axis for the 20 grids in each habitat. The gradient of assemblage change within rain forest along the second MDS axis was produced by increases in the abundances of Antechinus godmani, A. stuartii, Melomys cervini-pes, Rattus fuscipes/leucopus, and Uromys caudima-culatus from edge rain forest to interior rain forest
(Ta-ble 4). In the open forest, the second MDS axis was primarily associated with decreases in the abundance of Aepyprymnus rufescens, Isoodon macrourus, and Rattus sordidus, and with increases in the abundances
ofAntechinus flavipes, Rattus lutreolus, and Melomys cervinipes from dry to wet sclerophyll (Table 4).
As-semblage structure was spatially more variable in the open forest than in the rain forest and the differences between the drier sclerophyll forest and the wet scler-ophyll were greater than those between interior and edge rain forest.
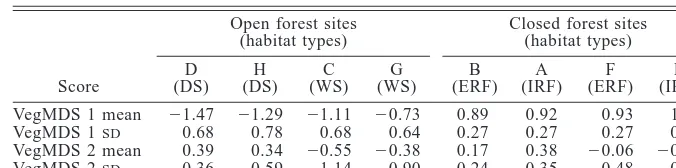
[image:5.612.67.281.77.241.2]TABLE3. Vegetation complexity and spatial heterogeneity of each site (in order of increasing scores on vegetation MDS axis 1, left to right).
Score
Open forest sites (habitat types) D
(DS) H (DS)
C (WS)
G (WS)
Closed forest sites (habitat types) B
(ERF) A (IRF)
F (ERF)
E (IRF) VegMDS 1 mean
VegMDS 1SD VegMDS 2 mean VegMDS 2SD
21.47 0.68 0.39 0.36
21.29 0.78 0.34 0.59
21.11 0.68
20.55 1.14
20.73 0.64
20.38 0.90
0.89 0.27 0.17 0.24
0.92 0.27 0.38 0.35
0.93 0.27
20.06 0.48
1.33 0.37
20.29 0.69
Notes: Scores were derived from the mean MDS axis scores and the standard deviation of
the MDS axis scores of each of the five grids within each site, respectively. Habitat types are interior rain forest (IRF), edge rain forest (ERF), wet sclerophyll (WS), and dry sclerophyll (DS). Negative scores in the second MDS axis correspond to increasing density of shrub layer 1–5 m because the second vegetation MDS axis is negatively correlated with shrub density.
FIG. 3. Changes in vegetation density across the habitat gradient. Habitats are interior rain forest (IRF), edge rain forest (ERF), wet sclerophyll (WS), and dry sclerophyll (DS). Values are the mean of 10 grids (five at each of two sites), except for wet sclerophyll, where only nine grids are included (one grid was removed due to fire), in each of the four habitat types. Error bars are 95% confidence intervals.
FIG. 4. Multidimensional scaling plot of the small-mam-mal assemblage structure (MammMDS axis 1 and axis 2) at each grid based on the abundance of 11 species of small mammals. Lines marked 1 and 2 highlight the within-habitat gradients referred to inResults: Mammal assemblage struc-ture. See Fig. 2 for an explanation of the eight sites (A–H)
and four habitat types.
individuals per grid increased into the rain forest, and the biomass index decreased (Table 4). The decrease in biomass was primarily due to a high biomass index in the dry sclerophyll, which was due to frequent cap-tures of the small macropod Aepyprymnus rufescens.
The trend in biomass is biased however, because a sim-ilar-sized macropod (Thylogale stigmatica) was
com-mon in the rain forest (S. E. Williams, personal ob-servation), but was rarely captured in traps.
In contrast, species richness, diversity, number of individuals, and biomass at a grid all increased from edge rain forest to interior rain forest along the second MDS axis (Table 4, Fig. 4). In the open forest, only biomass was significantly related to the second MDS axis, primarily through the influence ofAepyprymnus rufescens.
Local scale.—Total species richness of the five grids
combined at each site was negatively correlated with the mean mammal MDS axis 1 scores of the site; local-scale species richness was higher in the open-forest
sites (Table 5). Local species richness also was cor-related with the variability in assemblage structure along mammal MDS axis 1 (standard deviation of MDS 1 in Table 5). However, local species richness was most strongly correlated with the standard deviation of the second mammal MDS axis (MammMDS 2) scores. Stepwise multiple regression (backward removal when
P.0.1), using species richness as the dependent var-iable and the mean and standard deviation of the sites’ MDS scores for both axes as the four independent var-iables, removed all variables except the standard de-viation of MammMDS 2. Thus, nearly 93% of the var-iability in the species richness of a site can be explained by the spatial variability of the assemblage structure within the site, a form of b diversity (Fig. 5a). Total species richness of the site also was correlated with the mean of the total species richness of each grid within a site (adiversity) (Fig. 5b), but only 60% of the var-iance was explained usinga diversity only.
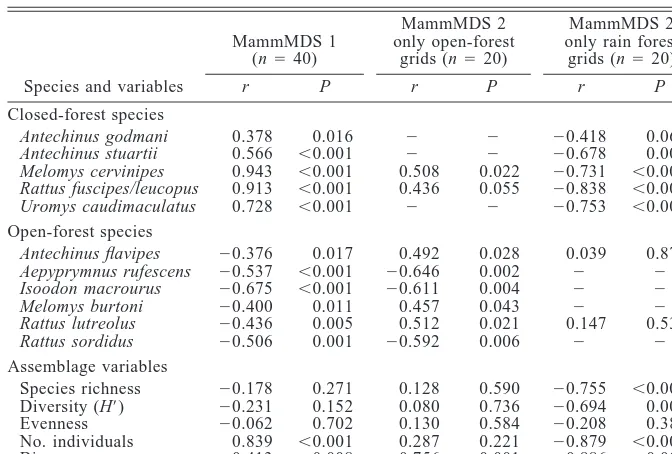
[image:6.612.119.457.103.187.2]TABLE4. Correlations between the MDS axes describing mammal assemblage structure at each trapping grid and the relative abundance of each species of small mammal and measures of assemblage diversity at each grid.
Species and variables
MammMDS 1 (n540)
r P
MammMDS 2 only open-forest
grids (n520)
r P
MammMDS 2 only rain forest
grids (n520)
r P Closed-forest species Antechinus godmani Antechinus stuartii Melomys cervinipes Rattus fuscipes/leucopus Uromys caudimaculatus 0.378 0.566 0.943 0.913 0.728 0.016 ,0.001 ,0.001 ,0.001 ,0.001 2 2 0.508 0.436 2 2 2 0.022 0.055 2 20.418 20.678 20.731 20.838 20.753 0.067 0.001 ,0.001 ,0.001 ,0.001 Open-forest species Antechinus flavipes Aepyprymnus rufescens Isoodon macrourus Melomys burtoni Rattus lutreolus Rattus sordidus 20.376 20.537 20.675 20.400 20.436 20.506 0.017 ,0.001 ,0.001 0.011 0.005 0.001 0.492 20.646 20.611 0.457 0.512 20.592 0.028 0.002 0.004 0.043 0.021 0.006 0.039 2 2 2 0.147 2 0.871 2 2 2 0.536 2 Assemblage variables Species richness Diversity (H9) Evenness No. individuals Biomass 20.178 20.231 20.062 0.839 20.413 0.271 0.152 0.702 ,0.001 0.008 0.128 0.080 0.130 0.287 20.756 0.590 0.736 0.584 0.221 ,0.001 20.755 20.694 20.208 20.879 20.886 ,0.001 0.001 0.380 ,0.001 ,0.001
Notes: Correlations with the second MDS axis only use within-habitat scores, namely, the
abundance of the species (or assemblage measure) in the 20 grids in each habitat. Species not recorded in that habitat are indicated by minus signs.
TABLE5. Correlations between position and variability along the gradient in mammal assemblage structure (mean and standard deviation of MDS axis scores describing mammal assemblage structure at each grid) and measures of mammal diversity at each site (n58).
Variable MammMDS 1 mean r P MammMDS 1 SD r P MammMDS 2 mean r P MammMDS 2 SD r P Species richness Diversity (H9) Evenness No. individuals Biomass 20.728 20.776 20.660 0.906 20.459 0.041 0.024 0.075 0.002 0.253 0.778 0.596 0.383 0.119 0.605 0.023 0.119 0.349 0.780 0.112 20.205 0.053 0.186 20.537 20.705 0.626 0.901 0.659 0.170 0.051 0.963 0.905 0.709 20.494 0.614 ,0.001 0.002 0.049 0.213 0.105
mammal assemblages across the gradient by pooling data from all censuses within each of the four habitats. The species richness of small mammals caught at a grid in a single census was significantly higher in in-terior rain forest than in any of the other three habitat types (Fig. 6a). However, when data were pooled over all five censuses, grids in edge rain forest had a sig-nificantly lower total species richness than did grids in the other habitats (Fig. 6b). Total species richness at each site (five grids per site pooled over all censuses) increased from rain forest to the dry sclerophyll (Fig. 6c). We did not analyze landscape-scale patterns based on the four habitat types further because analyses at finer spatial scales showed that the gradient between habitats was relatively continuous and ANOVA using the four a priori habitat types was not appropriate.
Relating mammal assemblage structure to vegetation structure
Point scale.—The structure of the vegetation and the
[image:7.612.122.458.110.337.2] [image:7.612.67.512.630.715.2]FIG. 5. Relationship between the total species richness of each site (A–H) and (a) spatial variability in assemblage struc-ture of the grids within a site, bdiversity (r50.963,P,
0.001) and (b) the mean grid species richness within each site,adiversity (r50.773,P50.024).
FIG. 6. Trends in the species richness of small mammals across the vegetation gradient from interior rain forest to dry sclerophyll. (a) Mean species richness per census within each habitat (two sites3five grids3five censuses per habitat;n 550). (b) Mean total species richness per grid (species rich-ness of each grid pooled over time; the value is the mean of the 10 grids per habitat;n510). (c) Total species richness recorded at each site, A–H (five grids3five censuses pooled per site). Error bars are 95% confidence intervals.
individuals was positively correlated with the vegeta-tion MDS axis 1 (Table 6). Species diversity was neg-atively correlated with the vegetation MDS axis 2 and biomass was positively correlated (Table 6).
Local scale.—The structure of the mammal
assem-blage at a site (mean of MDS axis 1 scores for each grid in the site) was strongly correlated with both the structure (mean VegMDS 1) and spatial variability (SD
VegMDS 1) of the vegetation (Table 7). The mean of the second mammal MDS axis scores for each site was not correlated with either vegetation structure or var-iability. However, the standard deviation of the second mammal MDS axis scores was most strongly correlated with the standard deviation of the first vegetation MDS axis scores (Table 7). Total species richness of a site was positively correlated with vegetation heterogeneity and negatively correlated with complexity, although more of the variance was explained by heterogeneity than complexity (r2 5 0.84 and 0.65, respectively). Similarly, diversity and evenness of the mammal as-semblage at a site were correlated with both complexity and heterogeneity of the vegetation. The number of individuals increased with increasing vegetation
FIG. 7. Relationship between the assemblage structure of small mammals at each grid and vegetation structure as ex-pressed by the first and second MDS axes describing mammal and vegetation structure (mammal MDS axes from Fig. 5 and vegetation MDS axes from Fig. 3; see Table 6 for relevant statistics). (a) Relationship between first MDS axes; (b) re-lationship between second MDS axes. Other combinations were not significant. Grid G5 was excluded (seeMethods).
Habitat types are indicated as follows: IRF, dark shading; ERF, light shading; WS, crossed; and DS, open symbols.
and vegetation complexity (VegMDS 1) and hetero-geneity (SDVegMDS 1) as the independent variables. Both analyses showed that complexity did not explain a significant amount of the variance in diversity beyond that already explained by heterogeneity.
DISCUSSION
Vegetation structure, spatial scale, and species diversity
Habitat use associated with vegetation structure was an important factor in the determination of the assem-blage structure of mammals both within and between habitats, and across all spatial scales examined. Most previous studies on the relationships between mammal assemblages and habitat structure also have found that
habitat structure is a good predictor of assemblage com-position (Rosenzweig and Winakur 1969, Fox 1981, August 1983, Kelt et al. 1994, Fox and Fox 2000). However, the effect of habitat structure on measures of diversity has been variable. Some studies have shown close relationships between mammal diversity and hab-itat structure (Rosenzweig and Winakur 1969, M’Closkey 1976, Fox and Fox 2000), whereas others have found no relationship (Brown 1973, Hockings 1981, August 1983), possibly due to the use of an in-appropriate spatial scale.
Although assemblage composition at a point was closely related to vegetation structure, the small-mam-mal species richness and diversity (H9) on a grid were only weakly explained by the mean vegetation com-plexity (,20% of the variance) and the spatial hetero-geneity within the grid (,15% of the variance). The spatial variability of vegetation structure over a dis-tance of 50 m did not have a large effect on the diversity of the mammal assemblage, probably because the with-in-habitat movements of individuals of most species would operate on a spatial scale larger than the grid. Demonstrating a relationship between habitat structure and the small-mammal diversity at a point has not al-ways been successful in forest environments (Hockings 1981, August 1983), although spatial heterogeneity and complexity have been found to be significant factors in simpler environments (Brown 1973, M’Closkey 1976).
In contrast, 93% of the variation in the local-scale species richness of small, predominantly ground-dwell-ing, mammals was explained by the spatial variation in assemblage structure between grids. This type of within-habitat variation in assemblage structure is re-ferred to as internalbdiversity (Whittaker 1977). Al-though local species richness also was correlated with the level of species richness at a point within the site (a diversity), more of the variance was explained by spatial variability in assemblage structure (bdiversity component). The species richness at a point did not explain a significant amount of the variance beyond that explained by spatial variability. Similarly, local species richness of small mammals was primarily as-sociated with the degree of spatial heterogeneity in vegetation structure, rather than vegetation complexity. Our results imply that local-scale habitat heterogeneity promotes local-scale species richness via the close eco-logical interaction between mammals and habitat struc-ture.
simi-TABLE6. Correlations between small-mammal assemblage structure and vegetation structure at each grid (n539).
Variable
Vegetation structure MDS1
[Canopy(1), subcanopy(1), ground cover (2)]
r P
MDS 2 [Shrubs (2)]
r P
Mammal assemblage structure (MDS 1) Mammal assemblage structure (MDS 2) Species richness
Diversity (H9) Evenness No. individuals Biomass
0.866
20.089
20.434
20.498
20.250 0.625
20.363
,0.001 0.594 0.007 0.001 0.130
,0.001 0.025
20.171
20.415
20.280
20.320
20.260
20.171 0.337
0.305 0.010 0.088 0.050 0.115 0.306 0.038
Notes: The MDS analysis of vegetation complexity at each grid used the mean density of
vegetation in each of five strata at five points within the grid. Strata that made the greatest contribution to each axis are listed in brackets with a2/1sign to indicate the direction of the correlation.
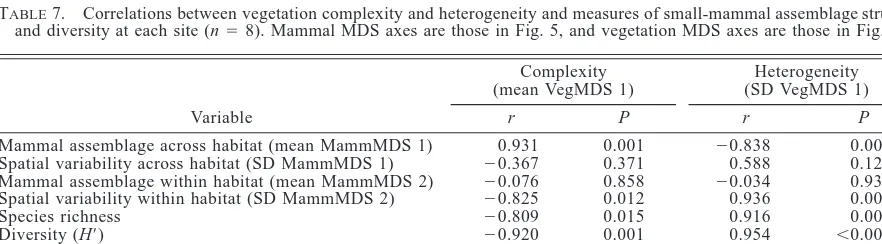
TABLE7. Correlations between vegetation complexity and heterogeneity and measures of small-mammal assemblage structure and diversity at each site (n58). Mammal MDS axes are those in Fig. 5, and vegetation MDS axes are those in Fig. 3.
Variable
Complexity (mean VegMDS 1)
r P
Heterogeneity (SD VegMDS 1)
r P
Mammal assemblage across habitat (mean MammMDS 1) Spatial variability across habitat (SD MammMDS 1) Mammal assemblage within habitat (mean MammMDS 2) Spatial variability within habitat (SD MammMDS 2) Species richness
Diversity (H9) Evenness No. individuals Biomass
0.931
20.367
20.076
20.825
20.809
20.920
20.841 0.732
20.562
0.001 0.371 0.858 0.012 0.015 0.001 0.009 0.039 0.147
20.838 0.588
20.034 0.936 0.916 0.954 0.825
20.562 0.649
0.009 0.125 0.936 0.001 0.001
,0.001 0.012 0.147 0.082
larities with ours, August (1983) did not find that small-mammal species richness was related to either com-plexity or heterogeneity. August (1983) used a single trapping grid in each of five habitat types. The use of a single, large grid with no within-habitat replication, and analysis at the trap scale, may have influenced his findings. August attributed the lack of an effect of het-erogeneity to sampling at a scale that was inappropriate to the grain size of the assemblage patchiness.
Vegetation complexity and spatial heterogeneity both contributed to patterns of species richness in our study, but the strength of the relationships varied with spatial scale. Vegetation complexity had a strong effect on the composition of the small-mammal assemblage present at a point, whereas vegetation heterogeneity best explained patterns of species richness. These re-lationships were weak at a scale smaller than the scale of movement of individual animals, but strong at the larger local scale. Williams (1997) previously showed that habitat heterogeneity at a regional scale also was closely related to the species richness of mammals. However, in the regional analysis, habitat heterogeneity was measured by the number of habitat types present in the landscape, a coarse measure compared to the fine-scale within-habitat heterogeneity discussed here.
The multiscale approach used in our study, with five grids in each of eight sites across a habitat gradient, allowed a higher resolution of patterns of spatial var-iability and supported the hypothesis that scale is crit-ical when examining habitat–fauna relationships. Fur-ther work is required to test the relationships between different landscape areas within a subregion, a scale not examined here or in the previous regional analysis (Williams 1997).
Mass effect.—Williams and Marsh (1998) suggested
[image:10.612.121.456.102.226.2] [image:10.612.70.511.593.715.2]with species richness. However, the study by Williams and Marsh was conducted on the western edge of the Paluma Range, an area of the Wet Tropics with a similar habitat gradient to our study, but a much lower species richness of mammals due to a different biogeographic history (Williams 1997). In both our study and that of Williams and Marsh (1998), the structure of the small-mammal assemblage was related to the spatial vari-ability in vegetation structure: in the less diverse as-semblage, this was manifest in spatial patterns of abun-dances (habitat heterogeneity promoted evenness), whereas in our study it was related to all measures of diversity (species richness, diversity, and evenness). Without detailed studies of the movement patterns of individuals, we cannot determine if the patterns we observed were influenced by a mass effect. However, several factors suggest that a mass effect was probably minimal in our study. First, we observed some rain forest species at a much greater distance (.1 km) from the rain forest than did Williams and Marsh (1998), where the maximum distance was 200 m. Second, sev-eral rain forest species successfully bred and marked juveniles grew into adults on non-rain forest sites. Third, the pervasiveness of a relationship between hab-itat heterogeneity and mammal diversity in areas with quite different levels of species richness suggests that habitat diversity had a real influence on the small-mam-mal assemblage.
Productivity.—Vegetation productivity was not
ex-plicitly examined in our study, but the gradient in veg-etation complexity from open forest to rain forest rep-resents a large change in the biomass of vegetation, and productivity is generally related to vegetation bio-mass (Southwood 1996). The relationship between di-versity and productivity has been intensively studied with quite variable results, and no universal rule has been found. However, considerable evidence supports a humped relationship between diversity and produc-tivity (Abramsky and Rosenzweig 1984, Rosenzweig and Abramsky 1993, Tilman and Pacala 1993, Tilman 1996, Tilman et al. 1996). Tilman and Pacala (1993) suggested that lower diversity at high levels of pro-ductivity is related to the tendency for high propro-ductivity to lead to high homogeneity and an uneven assemblage structure. This may be the case with the small mammals in our study, where the high productivity of the rain forest (compared with open forest) produced a homo-geneous and dense canopy that restricted vegetative growth in the lower levels of the forest. The resulting homogeneous vegetation was related to lower species richness and evenness of the small-mammal assem-blage and the higher number of individuals and biomass in the rain forest may be related to higher levels of productivity. Extending the sampling farther into the dry woodland where productivity is even lower would be likely to produce a humped diversity pattern, as small-mammal diversity is lower in the dry woodlands west of the study area (Williams et al. 1993).
Conclusions.—Processes that contribute to spatial
patterns of assemblage structure at the local/landscape spatial scale can be classified into three types: local ecological interactions, within-habitat dynamics, and the interaction between habitats (Schluter and Ricklefs 1993). Our study identified the effects of all three types of processes and showed them all to be significantly related to the spatial patterns of local mammal diver-sity. Different ecological interactions become apparent at different spatial scales, and even factors that were consistently related to diversity (e.g., habitat hetero-geneity) varied in their explanatory power at different spatial scales. Although regional-scale processes may determine the available species pool in a landscape (Williams 1997), our results demonstrate that local-scale processes are extremely important in structuring local mammal assemblages. Therefore, although local diversity is, by definition, a subset of regional diversity, patterns of local diversity are not a simple function of regional diversity. Southwood (1996) suggested that diversity is determined by habitat capacity, that is, the combination of productivity, architectural complexity, and heterogeneity. Our study provides support for the hypothesis that diversity does not linearly increase with productivity and that it is more likely to be a humped relationship. Additionally, we suggest that although the architectural complexity of a habitat may determine the species present in a given assemblage, it is the spatial heterogeneity that has the greatest influence on patterns of species diversity and that the strength of these re-lationships are strongly scale dependent.
ACKNOWLEDGMENTS
We would like to thank Richard Pearson, Chris Johnson, and two anonymous reviewers for comments on this manu-script. The research was supported by funding from the Aus-tralian Research Council, Wet Tropics Management Author-ity, Australian Geographic, the School of Tropical Biology, and the School of Tropical Environment Studies and Geog-raphy of James Cook University and the Cooperative Re-search Centre for Tropical Rain forest Ecology and Manage-ment. Field studies were carried out with the kind permission of the Queensland Parks and Wildlife Service.
LITERATURECITED
Abramsky, Z., and M. L. Rosenzweig. 1984. Tilman’s pre-dicted productivity–diversity relationship shown by desert rodents. Nature 309:150–151.
Angermeier, P. L., and M. R. Winston. 1998. Local vs. re-gional influences on local diversity in stream fish com-munities of Virginia. Ecology 79:911–927.
August, P. V. 1983. The role of habitat complexity and het-erogeneity in structuring tropical mammal communities. Ecology 64:1495–1507.
Bell, F. C., J. W. Winter, L. I. Pahl, and R. G. Atherton. 1987. Distribution, area and tenure of rain forest in northeastern Australia. Proceedings of the Royal Society of Queensland
98:27–39.
Blondel, J., and J.-D. Vigne. 1993. Space, time, and man as determinants of diversity of birds and mammals in the Med-iterranean region. Pages 52–65in R. E. Ricklefs and D.
Brown, J. H. 1973. Species diversity of seed-eating desert rodents in sand dune habitats. Ecology 54:775–787. Caley, M. J., and D. Schluter. 1997. The relationship between
local and regional diversity. Ecology 78:70–80.
Cornell, H. V., and J. H. Lawton. 1992. Species interactions, local and regional processes, and limits to the richness of ecological communities: a theoretical perspective. Journal of Animal Ecology 61:1–12.
Farnsworth, E. J., and A. M. Ellison. 1996. Scale-dependent spatial and temporal variability in biogeography of man-grove root epibiont communities. Ecological Monographs
66:45–66.
Fox, B. J. 1981. Niche parameters and species richness. Ecol-ogy 62:1415–1425.
Fox, B. J., and M. D. Fox. 2000. factors determining mammal species richness on habitat islands and isolates: habitat di-versity, disturbance, species interactions and guild assem-bly rules. Global Ecology and Biogeography 9:19–37. Gaston, K. 1996. Biodiversity: a biology of numbers and
difference. Blackwell Scientific, Carlton, Australia. Gaston, K. 2000. Global patterns in biodiversity. Nature 405:
220–227.
Griffiths, D. 1997. Local and regional species richness in North American lacustrine fish. Journal of Animal Ecology
66:49–56.
Hockings, M. 1981. Habitat distribution and species diversity of small mammals in south-east Queensland in relation to vegetation structure. Australian Wildlife Research 8:97– 108.
Hopkins, M. S., J. Ash, A. W. Graham, J. Head, and R. K. Hewett. 1993. Charcoal evidence of the spatial extent of the Eucalyptus woodland expansions and rain forest
con-tractions in north Queensland during the late pleistocene. Journal of Biogeography 20:357–372.
Hopkins, M. S., J. E. Ash, R. K. Hewett, and A. W. Graham. 1996. Evidence of a Holocene and continuing recent ex-pansion of lowland rain forest in humid, tropical North Queensland. Journal of Biogeography 23:737–745. Hughes, T., A. Baird, E. Dinsdale, N. Moltschaniwskyj, M.
Pratchett, J. Tanner, and B. Willis. 1999. Patterns of re-cruitment and abundance of corals along the Great Barrier reef. Nature 349:59–63.
Karlson, R. H., and L. E. Hurd. 1993. Disturbance, coral reef communities, and changing ecological paradigms. Coral Reefs 12:117–125.
Kelt, D. A., P. L. Meserve, and B. K. Lang. 1994. Quantitative habitat associations of small mammals in a temperate rain forest in southern Chile: empirical patterns and the im-portance of ecological scale. Journal of Mammalogy 75: 890–904.
Kohn, D. D., and D. M. Walsh. 1994. Plant species richness— the effect of island size and habitat diversity. Journal of Ecology 82:367–377.
Laurance, W. F. 1994. Rain forest fragmentation and the structure of small mammal communities in tropical Queens-land. Biological Conservation 69:23–32.
Lawton, J. H., T. M. Lewinsohn, and S. G. Compton. 1993. Patterns of diversity for the insect herbivores on bracken. Pages 178–184in R. E. Ricklefs and D. Schluter, editors.
Species diversity in ecological communities: historical and geographical perspectives. University of Chicago Press, Chicago, Illinois, USA.
Levin, S. A. 1992. The problem of pattern and scale in ecol-ogy. Ecology 73:1943–1967.
MacArthur, R. H., and J. W. MacArthur. 1961. On bird spe-cies diversity. Ecology 42:594–598.
Marquet, P. A. 1994. Diversity of small mammals in the Pacific coastal desert of Peru and Chile and in the adjacent Andean area: biogeography and community structure. Aus-tralian Journal of Zoology 42:527–542.
M’Closkey, R. T. 1976. Community structure in sympatric rodents. Ecology 57:728–739.
Minchin, P. R. 1987. An evaluation of the relative robustness of techniques for ecological ordination. Vegetatio 69:89– 107.
Morton, S. R. 1993. Determinants of diversity in animal com-munities of arid Australia. Pages 159–169in R. E. Ricklefs
and D. Schluter, editors. Species diversity in ecological communities: historical and geographical perspectives. University of Chicago Press, Chicago, Illinois, USA. Nix, H. A., and M. A. Switzer. 1991. Rainforest animals:
atlas of vertebrates endemic to the wet tropics. Australian National Parks and Wildlife Service, Canberra, Australia. Palmer, M. W., and P. S. White. 1994. Scale dependence and the species–area relationship. American Naturalist 144: 717–740.
Pearson, D. L., and S. A. Juliano. 1993. Evidence for the influence of historical processes in co-occurrence and di-versity of tiger beetle species. Pages 194–202 in R. E.
Ricklefs and D. Schluter, editors. Species diversity in eco-logical communities: historical and geographical perspec-tives. University of Chicago Press, Chicago, Illinois, USA. Poizat, G., and D. Pont. 1996. Multi-scale approach to spe-cies–habitat relationships: juvenile fish in a large river sec-tion. Freshwater Biology 36:611–622.
Ricklefs, R. E. 1987. Community diversity: relative roles of local and regional processes. Science 235:167–171. Ricklefs, R. E., and D. Schluter. 1993. Species diversity:
regional and historical influences. Pages 350–363in R. E.
Ricklefs and D. Schluter, editors. Species diversity in eco-logical communities: historical and geographical perspec-tives. University of Chicago Press, Chicago, Illinois, USA. Robinson, W. D., J. D. Brawn, and S. K. Robinson. 2000. Forest bird community structure in central Panama: influ-ence of spatial scale and biogeography. Ecological Mono-graphs 70:209–235.
Rosenzweig, M. L. 1995. Species diversity in space and time. Cambridge University Press, Cambridge, UK.
Rosenzweig, M. L., and Z. Abramsky. 1993. How are di-versity and productivity related? Pages 52–65in R. E.
Rick-lefs and D. Schluter, editors. Species diversity in ecological communities: historical and geographical perspectives. University of Chicago Press, Chicago, Illinois, USA. Rosenzweig, M. L., and J. Winakur. 1969. Population
ecol-ogy of desert rodent communities: habitats and environ-mental complexity. Ecology 50:558–572.
Schiffman, S. S., M. L. Reynolds, and F. W. Young. 1981. Introduction to multidimensional scaling. Academic Press, Sydney, Australia.
Schluter, D., and R. E. Ricklefs. 1993. Species diversity: an introduction to the problem. Pages 1–10in R. E. Ricklefs
and D. Schluter, editors. Species diversity in ecological communities: historical and geographical perspectives. University of Chicago Press, Chicago, Illinois, USA. Schneider, C. J., M. Cunningham, and C. Moritz. 1998.
Com-paritive phylogeography and the history of endemic ver-tebrates in the Wet Tropics rain forests of Australia. Mo-lecular Ecology 7:487–498.
Schodde, R., and J. H. Calaby. 1972. The biogeography of the Australo–Papua bird and mammal faunas in relation to Torres Strait. Pages 231–257in D. Walker, editor. Bridge
and barrier: the natural and cultural history of Torres Strait. Australian National University, Canberra, Australia. Shenbrot, G. I., K. A. Rogovin, and E. J. Heske. 1994.
Com-parison of niche-packing and community organisation in desert rodents in Asia and North America. Australian Jour-nal of Zoology 42:479–499.
and dynamics. Philosophical Transactions of the Royal So-ciety of London 351:1113–1129.
Stoms, D. M. 1994. Scale dependence of species richness maps. Professional Geographer 46:346–358.
Tilman, D. 1996. Biodiversity: population versus ecosystem stability. Ecology 77:350–363.
Tilman, D., and S. Pacala. 1993. The maintenance of species richness in plant communities. Pages 13–25in R. E.
Rick-lefs and D. Schluter, editors. Species diversity in ecological communities: historical and geographical perspectives. University of Chicago Press, Chicago, Illinois, USA. Tilman, D., D. Wedin, and J. Knops. 1996. Productivity and
sustainability influenced by biodiversity in grassland eco-systems. Nature 379:718–720.
Tracey, J. G., and L. J. Webb. 1975. Vegetation of the humid tropical region of north Queensland. Fifteen maps at a scale of 1:100 000 plus key and notes. CSIRO, Indooroopilly, Australia.
Webb, L. J., and J. G. Tracey. 1981. Australian rain forests: patterns and change. Pages 605–694in A. Keast, editor.
Ecological biogeography of Australia. Dr. W. Junk, The Hague, The Netherlands.
Westoby, M. 1998. The relationship between local and re-gional diversity: comment. Ecology 79:1825–1827. Whittaker, R. H. 1972. Evolution and measurement of species
diversity. Taxon 21:213–251.
Whittaker, R. H. 1977. Evolution of species diversity in land communities. Evolutionary Biology 10:1–67.
Wiens, J. A. 1989a. The ecology of bird communities:
foun-dations and patterns. Cambridge University Press, Sydney, Australia.
Wiens, J. A. 1989b. Spatial scaling in ecology. Functional
Ecology 3:385–397.
Williams, S. E. 1990. The interactive relationship between vegetation and the small mammal community of the rain forest ecotone in north Queensland. Honours Thesis. James Cook University, Townsville, Australia.
Williams, S. E. 1997. Patterns of mammalian species richness in the Australian tropical rain forests: are extinctions during historical contractions of the rain forest the primary de-terminant of current patterns in biodiversity? Wildlife Re-search 24:513–530.
Williams, S. E., S. Burnett, and R. G. Pearson. 1993. Survey of the vertebrate fauna of the Dotswood area, north Queens-land. Memoirs of Queensland Museum 33:361–378. Williams, S. E., and H. Marsh. 1998. Changes in small
mam-mal assemblage structure across a rain forest/open forest ecotone. Journal of Tropical Ecology 14:187–198. Williams, S. E., and R. G. Pearson. 1997. Rain forest shape
and endemism in Australia’s Wet Tropics. Proceedings of the Royal Society of London B 264:709–716.
Williams, S. E., R. G. Pearson, and P. J. Walsh. 1996. Dis-tributions and biodiversity of the terrestrial vertebrates of Australia’s Wet Tropics: a review of current knowledge. Pacific Conservation Biology 2:327–362.
Winter, J. W. 1988. Ecological specialization of mammals in Australian tropical and subtropical rain forest: refugial or ecological determinism. Pages 127–138in R. Kitching,
ed-itor. The ecology of Australia’s wet tropics. Surrey Beatty, Sydney, Australia.