University of Southern Queensland
Faculty of Engineering and Surveying
CLEAR ZONES I N URBAN ENVI RONMENTS
A dissertation submitted by
Mr Tony Gallagher
In fulfilment of the requirements of
Bachelor of Engineering (Civil)
(Course ENG4111)
ABSTRACT
Run off road accidents are global problems, with fatal and serious injuries
reported for speeds of 40 km/hour and above. Frequency and severity of these
injuries can be significantly impacted by providing a safe roadside environment.
This can be achieved by ensuring the area adjacent to the roadside is free of
obstacles, hazards and distractions and is designed to maximise drivers’
opportunity to regain control of an errant vehicle. A "clear zone" is the total
width from the traffic lane edge required to be clear of roadside hazards.
A variety of hazards may occur within the specified clear zone including point
and continuous hazards. There is still some conjecture about the diameter size
of trees and poles to be classified as hazards. A hierarchy of treatments exists
with six different methods recommended. Practicalities of treatments in urban
areas must be considered.
Questions arise about the classification of hazards and the inherent risks
associated with their presence, including the treatment of new infrastructure
versus current treatments of existing rigid objects and potential hazards in
specified clear zones
To meet legal requirements, road authorities must fulfil their duty of care to road
users. They must not create a foreseeable risk of harm and are obliged to take
reasonable steps to remedy an existing risk within a reasonable time. The court
recognises that resources are limited, including man power and funding. Road
authorities need methods in place to prioritise projects to address safety issues.
Quantitative and qualitative assessments are required to prioritise and assess
the engineering, environmental and social ramifications of safety concerns and
proposed treatments. Designers and engineers are reluctant to make subjective
decisions that may not be supported by standards. Practical treatment
solutions must be ‘fit for purpose’. The conclusion of this paper provides tools
University of Southern Queensland Faculty of Engineering and Surveying
Limitations of Use
The Council of the University of Southern Queensland, its Faculty of
Engineering and Surveying, and the staff of the University of Southern
Queensland, do not accept any responsibility for the truth, accuracy or
completeness of material contained within or associated with this dissertation.
Persons using all or any part of this material do so at their own risk, and not at
the risk of the Council of the University of Southern Queensland, its Faculty of
Engineering and Surveying or the staff of the University of Southern
Queensland.
This dissertation reports an educational exercise and has no purpose or validity
beyond this exercise. The sole purpose of the course "Project and Dissertation"
is to contribute to the overall education within the student’s chosen degree
programme. This document, the associated hardware, software, drawings, and
other material set out in the associated appendices should not be used for any
other purpose: if they are so used, it is entirely at the risk of the user.
Professor Frank Bullen
Dean
Faculty of Engineering and Surveying
CANDIDATE’S CERTIFICATION
I certify that the ideas, designs and experimental work, results, analysis and
conclusions set out in this dissertation are entirely my own efforts, except where
otherwise indicated and acknowledged.
I further certify that the work is original and has not been previously submitted
for assessment in any other course or institution, except where specifically
stated.
Tony Gallagher
Student Number: Q8042318
_________________________
Signature
_________________________
ACKNOWLEDGEMENTS
The author would like to thank Associate Professor Ron Ayers for his help and
TABLE OF CONTENTS
ABSTRACT ...ii
Limitations of Use ...iii
CANDIDATE’S CERTIFICATION ...iv
ACKNOWLEDGEMENTS...v
1. Introduction...1
1.1 Methodology ...6
2. Literature Review ...8
2.1 Hazard Identification ...8
2.2 Adopted Clear Zone Widths... 11
2.2.1. American Association of State Highway and Transportation Officials (AASHTO, 2002)... 11
2.2.2. The Queensland Department of Main Roads, Road Planning and Design Manual (2005)... 15
2.2.3. Roadside Infrastructure for Safer European Roads (RISER) (Dupre & Bisson, 2006)... 16
2.2.4. Transit New Zealand State Highway Geometric Design Manual (2002) 17 2.2.5. AustRoads Urban Road Design Manual (2003)... 20
2.2.6. British Columbia Ministry of Transportation and Highways (1996)22 2.2.7. The Australian Standard for Street Lighting (AS/NZS 1158.1.3:1997) 23 2.3 Dealing with Hazards within the Clear Zone ... 23
2.3.1. AASHTO (2002)... 23
2.3.2. Main Roads Western Australia (2006)... 24
2.3.3. The Queensland Department of Main Roads (2005) (Chapter 8)... 24
2.3.4. VicRoads Road Design Note on Roadside Utility Poles (VicRoads, 2007) 25 2.3.5. Department of Infrastructure Energy & Resources Tasmania (date unknown) 26 2.4 Summary ... 27
3. Legal Requirements... 28
3.1 Non-Feasance versus Mis-Feasance... 28
3.2 High Court Rulings on the Liability of Road Authorities ... 28
3.3 Liability of Road Authorities in Queensland... 32
3.3.1. Advice from Crown Law for Main Roads Queensland... 33
3.4 Net Reduction of Risk ... 36
4. Method of Treatment... 38
4.1 Remove the hazard... 38
4.2 Redesign the hazard... 38
4.3 Relocate the hazard... 39
4.4 Providing Breakaway Supports ... 40
4.5 Shielding hazard... 41
4.5.1. Wire Rope... 46
4.5.2. Steel Beam Guardrail... 48
4.5.3. Concrete Barriers... 49
4.5.4. End Treatments... 50
4.5.5. Barrier Kerb... 52
4.5.6. Delineating hazard... 52
5. Treatment Evaluation... 55
5.1 Quantitative Evaluation. ... 55
5.1.1. RISC... 56
5.1.3. Software Results... 64
5.1.4. Environmental considerations... 66
5.1.5. Engineering considerations... 66
6. Prioritisation Methods used in Queensland... 67
6.1 Road Safety Audits... 67
6.2 Federal Government... 68
6.3 State Government... 69
6.4 Local Authorities ... 70
6.5 Planning and Design Projects ... 71
7. Conclusion ... 72
8. Test Cases... 78
8.1 Existing Site ... 78
8.2 Proposed Treatment in Design Process... 81
Appendix A Project Specification
Appendix B RISC Output
Appendix C RSAP Output
Appendix D Clear Zone Hazard Considerations
LIST OF FIGURES
Figure 1-1 Clear Zone Definitions ………... 3
Figure 2-1 Clear Zone Distance Curves ……….……... 12
Figure 2-2 Clear Zone Adjustment Curves ……… 15
Figure 2-3 Figure 2-3 Adjustment for Road Alignment ……… 19
Figure 2-4 Austroads Clear Zone Distance Curve ……….. 20
Figure 2-5 Austroads Horizontal Curve Factor 21 Figure 4-1 Photo of sloping end wall on culvert ……… 39
Figure 4-2 Calculation of required guardrail length for adjacent lane … 43 Figure 4-3 Calculation of required guardrail length for opposing lane .. 43
Figure 4-4 Calculation of required guardrail length on horizontal curves ………... 45 Figure 4-5 Example of a wire rope installation ……….. 47
Figure 4-6 Typical steel beam guardrail installation ………. 48
Figure 4-7 Typical concrete barrier installation ………. 50
Figure 4-8 Example of delineation of power poles ………... 53
Figure 4-9 Example of audible line marking ……….. 54
Figure 5-1 Main Screen of RISC Program ……….……… 58
Figure 5-2 General Data Input for RISC ………. 58
Figure 5-3 Crash Cost Data Input for RISC ………... 59
Figure 5-4 Cost Data Input for RSAP ………. 61
Figure 5-5 Highway Data Input for RSAP ……….. 62
Figure 5-6 Features Data Input for RSAP ……….. 63
Figure 5-7 Features Segment Input for RSAP ……….. 64
Figure 7-1 Proposed Assessment and Prioritisation Procedure ……… 74
Figure 7-2 Clear Zone Hazard Treatment Considerations ……….. 75
Figure 7-3 Hazard Treatment Evaluation Score Card ………. 76
Figure 8-1 Existing Site – Photo 1 ………... 80
Figure 8-2 Existing Site – Photo 2 ………... 80
LIST OF TABLES
Table 2-1 AASHTO Clear Zone Widths ………... 13
Table 2-2 Curve Correction Factors ………. 14
Table 2-3 RISER Recommended Safety Zone Width (m) ……… 17
Table 2-4 Austroads Clear Zone widths for one-way approach AADT 21
Table 2-5 British Columbia Clear Zone Widths ……….. 22
Table 2-6 Recommended Widths in a Straight, 60km / hour zone ….. 28
Table 4-1 Suggested Run-Out Lengths for the Barrier Design ……… 44
Table 8-1 Evaluation Score Card for Existing Site ………. 79
GLOSSARY
AADT Annual Average Daily Traffic
AASHTO American Association of State Highway and
Transportation Officials
Benefit Cost Ratio
(BCR)
The ratio of the estimated benefits to be derived from a
specific course of action divided by the costs of
implementing that action.
Breakaway A device that allows an object such as a sign, or luminare,
to yield or separate upon impact
Carriageway The portion of the road formation, including lanes,
auxiliary lanes and shoulders that is set aside for the use
of vehicles, either moving or stationary.
Clear Zone The border area that begins at the edge of each travelled
lane and is available for emergency use by errant
vehicles that run off the road. This zone includes any
adjoining lane/s, road shoulder, verge and batter.
Distributed Objects
Known as ’continuous obstacles’. They are potential
hazards which extend along a length of roadside
End Treatment The designed modification at the end of a roadside or
median safety barrier
Frangible A type of structure that is readily or easily broken upon
impact.
Gating end treatment
A gating treatment will breakaway upon collision and
allow a vehicle to pass through the end treatment.
Lateral Offset The offset from a specified portion of the roadway. This is
usually the perpendicular distance from the edge of that
adjacent carriageway to the point being investigated
Length of Need The total length of longitudinal safety barrier needed to
shield an area of concern
conducted negligently.
Non-feasance Failing to do a task in relation to the condition of roads
and roadside footpaths
Non-gating end treatment
A non-gating treatment does not allow vehicles to pass
through the end treatment. The terminal re-directs the
vehicle away from the barrier or be arrested by the barrier
Non-recoverable Slope
A non-recoverable slope is one on which a vehicle is
likely to overturn and can be considered as a hazard in
itself. Embankment slopes steeper than 1 on 3 are
considered non-recoverable.
Operating Speed Is the 85th percentile speed. This is the speed at, which 85% of cars are observed to travel under free flowing
conditions past a nominated point
Point Objects Point Hazards are permanent hazards of fairly limited
length
Recoverable Slope
A slope on which a motorist will probably retain control of
a vehicle. Slopes 1 on 4 or flatter are generally
considered recoverable.
RISC Roadside Impact Severity Calculator program.
RSAP Roadside Safety Analysis Program
Travelled way The portion of the carriageway that is assigned to moving
"Could you have avoided this tragedy?"
"Are your actions or inactions responsible?"
1. Introduction
The problem of death and serious injury resulting from road accidents is a
global phenomenon. Authorities in virtually all countries are concerned about
the growth in the number of people killed and seriously injured on their roads,
and the resultant cost in both dollars and personal tragedy.
The relevance of single vehicle run-off-road accidents as a traffic safety issue
can be demonstrated as detailed in a review of European accident data. In
1998, 33.8% of all fatalities in the European Union were attributed to single
vehicle collisions (Dupre & Bisson, 2006).
Queensland Department of Main Roads reports that an unforgiving roadside
environment is a major contributor to the amount of people killed or seriously
injured on Queensland Roads. In the five-year period leading up to June 2005,
approximately one third of fatal crashes and about 16% of the total number of
people killed and seriously injured, involved vehicles which ran off the travelling
way or road, and hit an unforgiving object or hazard.
The Victorian State Roads Authority states that every year there are over 800
casualty crashes in Victoria involving utility poles. Of these crashes, 80% occur
at intersections. Accidents involving utility poles represent approximately 5% of
of all fatal crashes. In the metropolitan area, while utility pole crashes represent
5% of overall casualty crashes, they represent a staggering 14% of all fatal
casualty crashes (VicRoads, 2007).
The Roadside Infrastructure for Safer European Roads (RISER) accident
database states that the most severe accident configurations are collisions with
trees and poles. Fatal and serious injuries as a result of these collisions are
reported where impact speeds are 40 km/hr and above (Dupre & Bisson, 2006).
Any road traffic system has a degree of complexity and is potentially hazardous
to the health of travelling motorists. Elements of the overall system include the
motor vehicles, roads and road users, and their physical, social and economic
environments. To make the road system less hazardous, a "systems approach"
is required; understanding the system as a whole and identifying where there is
potential for intervention. In particular, it requires recognising and
understanding human nature as it is. Humans are prone to lapses of
concentration and making mistakes. The human body is also vulnerable to the
consequences of this human error – possibly injury or death. A safe road traffic
system is one that accommodates and compensates for human error and
vulnerability.
Regardless of the reason for a vehicle leaving the roadway, a roadside
environment free of fixed objects with stable, flattened slopes, enhances the
chances of eliminating serious crashes, or at least reducing crash severity. The
forgiving roadside concept provides a safer environment for errant vehicles
leaving the roadway. The key is a roadside design which reduces or eliminates
the likelihood of serious consequences for these incidents.
A safe roadside environment can be achieved by ensuring that an adequate
area is provided adjacent to the roadside that is free of obstacles, hazards and
distractions and designed in such a way that drivers have the opportunity to
regain control of an errant vehicle. A clear zone is therefore the total width
width is required to enable drivers to recover and regain control of their errant
vehicle in an emergency situation where the motorist has unexpectedly left the
roadway. Solid objects that are located within the clear zone can often convert
a loss of control situation that could otherwise have a harmless outcome, into a
serious or potentially fatal crash. The clear zone width depends on a number of
factors which will be investigated and documented in this paper. Factors
usually considered in the determination of clear zone widths include, but are not
restricted to, traffic speed, traffic volumes, batter slopes, extent and size of
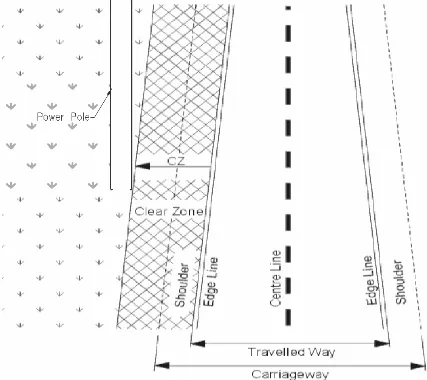
[image:14.612.131.558.259.639.2]hazards, visibility and roadside geometry.
Figure 1-1 Clear Zone Definitions
There are many reasons why a vehicle could leave the travelling way and
x driver fatigue or inattention;
x excessive speed;
x driving under the influence of drugs or alcohol;
x crash avoidance (with either another vehicle or an object on the travelling way);
x roadway conditions such as ice, snow or rain;
x vehicle component failure;
x poor visibility; and
x misunderstanding or misinterpreting the traffic guidance system.
The clear zone concept originated in the United States of America and has
been adopted with different approaches around the world. Approaches used
depend on land availability and design policy. The clear zone is usually a
compromise between 3 variable and independent parameters:
x the recovery area required for an errant vehicle;
x the cost of providing that area; and
x the probability of an errant vehicle encountering a hazard.
According to the Road Hazard Management Guide of Tasmania, the ideal
roadside environment would be completely free of any obstructions to the safe
passage of errant vehicles. Such a roadside would drastically reduce injuries in
run-off-road crashes; it would provide drivers enough capacity to recover and
regain control of their vehicles. They could either stop safely, without colliding
with any objects or over-turning the vehicle, or they could safely re-enter the
travelling way. However, it is rarely possible or practical to construct a roadside
environment completely free of hazards. There is usually a requirement for
roadside guidance signage, utility poles and other roadside furniture. Further,
the topography of the finished landscape often necessitates cut or fill
embankments. These factors all contribute to the overall makeup of the
roadside and the potential for a hazard free clear zone (Department of
Engineers and designers are continually faced with decisions regarding objects
that exist or are proposed in a clear zone. The placement of new rigid objects
such as street lighting poles, trees in landscaping, gantry posts and power poles
regularly causes confusion. Questions arise about whether they should be
classified as hazards and about the inherent risks associated with their
presence. Various flow-on effects are debated, such as the need to install
protective barriers, or alternatively, to provide slip base systems. The question
often asked, is why new infrastructure should be treated any differently to the
many existing rigid objects and potential hazards located within specified clear
zones. As a result of this confusion and variance in ideas and opinions, there
are increasing inconsistencies exist on our road networks. A certain post
situated at one location may be protected by guardrail while others in similar
situations are totally unprotected.
Usually, standards are not sufficiently clear in this regard, and often the wording
used is either obscure or open to misinterpretation. This leads to
implementation confusion and nervousness about legal liability issues.
Decisions are often governed by the degree of risk the designer is prepared to
accept. Some extracts from the various standards that could be used to justify
the presence of rigid objects close to roadside environments are:
"Criteria and procedures outlined in this section (chapter 8) are not a
substitute for, but can assist engineering judgement. The unique
circumstances of each location and the amount of funds available for
road improvement must be considered when treating roadside
hazards."
(Queensland Main Roads Roads, 2005, chapter 8).
"Clear zones are intended as a guide to by which practitioners can
assess sites, not a prescriptive value. Practitioners may provide a
greater or lesser width depending on the risk factors applying to a
(Department of Infrastructure Energy & Resources Tasmania, date unknown).
Although the above general statements exist in the standards, designers rarely
use or rely on them to justify or defend their design decisions. Designers are
more likely to be conscious and concerned about their obligations to discharge
their duty, usually resulting in appropriate use of the standards. Ultimately, this
produces a safe and defendable design that does not leave either the design or
the relevant authority open to vicarious liability for any negligent actions. So,
although the standards contain a high degree of subjectivity, human nature
tends to favour the conservative side, rather than relying strictly on the
standards to justify less than favourable assessments. Therefore, often
engineering judgement is not used and the most costly solution is implemented.
Decision makers are often unaware of how courts will react if an accident
occurs.
The Austroads Urban Road Design Manual (2003) states that while the concept
of clear zones is widely accepted as the most appropriate method for
determining width for various road conditions it is constantly debated amongst
practitioners. There needs to be further research into this area to confirm the
risk associated with the differences to the clear zone widths.
Therefore, the aim of this project is to provide engineers and designers with the
tools to quickly and confidently assess the risk of roadside hazards and to
determine an appropriate treatment that is fit for purpose.
1.1 Methodology
The methodology employed in the research includes the following.
1. Research the background information relating to the identification and
treatment of roadside hazards, and in particular the use of clear zones.
2. Research and evaluate available methods used for risk assessment of
3. Research the protective measures used for roadside hazards, particularly
those which are applicable in urban situations.
4. Determine the legal requirements and likely ramifications for a road
authority when a vehicle impacts a hazard that is within a specified clear
zone.
5. Determine and test a suitable procedure for the evaluation and treatment
2. Literature Review
2.1 Hazard Identification
Main Roads Western Australia, Assessment of Roadsides Hazards (2006)
The Main Roads Department in Western Australia classifies roadside hazards into
two categories; point hazards and continuous hazards.
Point Hazards are permanent hazards of fairly limited length. These types of hazards
include:
x trees over 100mm in diameter;
x bridge end posts and piers;
x large planters;
x hazardous mail boxes or landscape features;
x non-breakaway signs;
x inappropriate slip bases on signs;
x protruding footings (including those for breakaway signs);
x non-traversable driveway headwalls;
x non-traversable culvert headwalls;
x fixed objects in the drain line;
x utility poles;
x end treatments to guardrails;
x walls or corners of walls; and
x hydrant bases more than 100m high.
It should be noted that while trees less than 100mm in diameter within the clear zone
are not considered to be point hazards, they should still be removed from the clear
zone as they can grow to become potential hazardous in the future. Multiple trees
2.1m apart. This is relevant to existing vegetation and substantial shrubs that may
be planted as part of a landscaping treatment.
Continuous hazards differ from point hazards in that they are of considerable length
and therefore it is generally less practical to remove or relocate them. When located
within the clear zone they are considered to be hazards. However, they may also be
a significant hazard when situated beyond the clear zone. The length of the hazard
increases the likelihood that an errant vehicle may collide with it, and some hazards
(for example, cliffs) have a high crash severity regardless of the speed of the errant
vehicle. Examples of continuous hazards include:
x dense woods;
x rows of large trees;
x steep embankments (i.e. that have a critical slope or non-recoverable slope);
x rock outcrops or boulders intermixed with trees;
x rock cuttings;
x cliffs or precipitous drop-offs;
x bodies of water, including streams and channels over 0.6m deep;
x unshielded hazards such as cliffs or bodies of water that are beyond the desired minimum clear zone, but are likely to be reached by an errant vehicle;
x protective treatment such as guardrail;
x retaining walls;
x fences with rail that can spear vehicles.
Queensland Department of Main Roads, Road Planning and Design Manual
(2005)
The Queensland Department of Main Roads assigns weighted severity index to
roadside objects. This index is related to the vehicles speed at impact, impact angle,
size, deformability and fixity. Objects that are not considered in the high severity
category are:
x slip base pole;
x traffic signal pole;
x trees and shrubs with ultimate truck diameter less than 80mm in diameter;
x wooden objects less than 80mm diameter.
Roadside Infrastructure for Safer European Roads (RISER) (Dupre & Bisson,
2006)
The RISER statistical database holds nearly 265 000 single vehicle accident cases
derived from seven European countries (Austria, Finland, France, the Netherlands,
Spain, Sweden and the United Kingdom). In 67% of these cases, it was known that
the vehicle struck an object.
Tree Impacts Only
The narrowest tree diameter involved in a fatal collision was 0.3m (0.2m where no
seatbelt was worn) and the largest set-back distance from the edge of the road was
6.8m (10.8m where no seatbelt was worn). All fatal accidents involved impact
speeds of 70km/h or greater (where speed data was known). When serious
accidents were also included, impact speeds were 40km/h or greater.
Post/Pole Impacts Only
In accidents involving posts and poles, posts/poles as narrow as 0.2m were impacted
(0.11m where no seatbelt was worn), resulting in death or serious injury. Impact
speeds in serious and fatal accidents were 40km/h or above. Fatal accidents
involving posts/poles were more often side impacts than frontal impacts.
Posts and Poles
Posts and poles on the roadside of varying types were also considered as hazards in
a number of the countries. In Great Britain and Finland, traffic sign supports with a
Spain, trees and poles over 0.15m diameter are hazards depending on the distance
to the carriageway edge line
Point versus Distributed Objects
The objects identified in RISER databases as hazardous objects, are those which,
when impacted, can lead to serious occupant injuries. These objects are divided into
’point’ and ’distributed’ objects.
Point Objects are narrow items in the roadside that could be stuck in a collision.
Examples include trees, all types of bridge supports, lighting poles, utility poles, sign
posts and terminations of barriers.
Distributed Objects are a known as ’continuous obstacles’. They are potential
hazards which extend along a length of roadside. Examples include all types of
embankments, ditches, rock face cuttings, retaining walls, safety barriers not meeting
current standards, forest and closely spaced trees.
2.2 Adopted Clear Zone Widths
2.2.1. American Association of State Highway and Transportation Officials (AASHTO, 2002)
The Roadside Design Guide selection of a clear zone width is based on empirical
data using traffic volumes, speed & roadside geometry. Figure 2-1 provides the clear
zone distance curves developed through research by AASHTO used to determine the
clear zone width.
Figure 2-1 Clear Zone Distance Curves
(AASHTO, 2002)
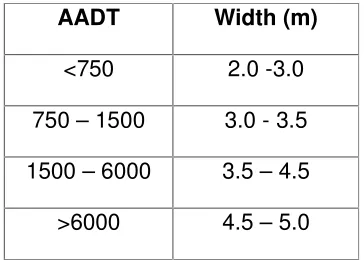
Based on these figures, for a 60km/hr zone with a flat roadside representing a
footpath, the required clear zones for various Average Annual Daily Traffic (AADTs)
[image:24.612.215.397.191.321.2]are shown in Table 2-1.
Table 2-1 AASHTO Clear Zone Widths
AADT Width (m)
<750 2.0 -3.0
750 – 1500 3.0 - 3.5
1500 – 6000 3.5 – 4.5
>6000 4.5 – 5.0
(AASHTO, 2002)
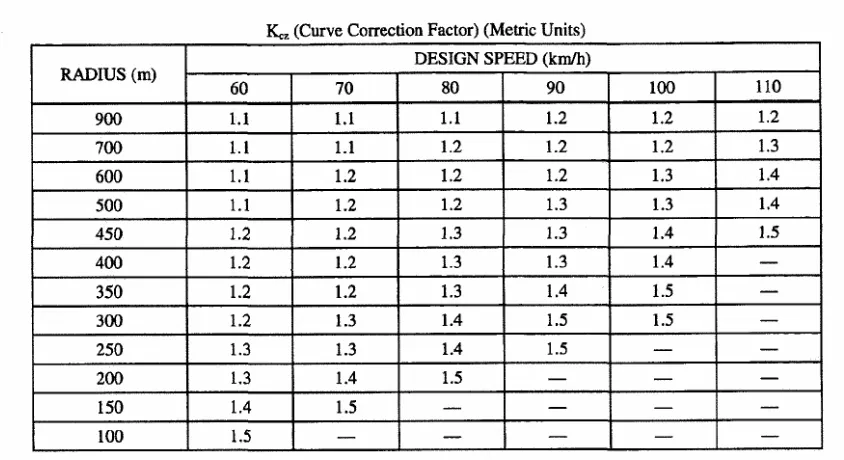
The Guide suggests that from distances obtained from the figure, only the
approximate centre of the range should be considered and not a precise distance to
be held as absolute. The width may be modified to take into account the horizontal
curvature. This modification is normally only considered when crash histories
indicate a need, or when a site investigation shows a definitive crash potential. Table
Table 2-2 Curve Correction Factors
(AASHTO, 2002)
Embankment slopes are defined as:
x “recoverable” if they are flatter than 1 on 4;
x “non–recoverable” for slopes between 1 on 3 and 1 on 4; and
x “critical” for slopes greater than 1 on 3.
For slopes classified as recoverable, no adjustment to the clear zone width is
required. If a slope is classified non-recoverable, vehicles will be unable to recover
and rejoin the carriageway. Generally, vehicles do not roll, but continue to traverse
the embankment until either coming to a stop, or reaching the toe of the
embankment. In this case, a clear runout area beyond the toe of the recoverable
batter slope is desired. The extent of the clear runout area is determined by
subtracting from the recommended clear zone distance, the available distance from
the edge of the travelled way to the start of the non-recoverable slope. The result is
the desirable clear runout that should be provided beyond the toe of the batter, if
2.2.2. The Queensland Department of Main Roads, Road Planning and
Design Manual (2005)
The RPDM has adopted the methodology outlined by AASHTO when determining the
clear zone widths. Main Roads also state that the designer may choose to adjust the
clear zone width for the effect of horizontal curvature by using an adjustment factor
obtained from Figure 2-2.
Figure 2-2 Clear Zone Adjustment Curves
(Queensland Department of Main Roads, 2005, Chapter 8)
An adjusted offset is recommended for rigid objects when positioned on
non-recoverable embankment slopes. The actual offset to a rigid object is adjusted to
reflect a new effective offset
Adjusted offset = (Es x offset) + (distance from edge line to hinge point)
Where:
Es is adjustment offset factor for slope – Es = 1 + s/f
s is slope (negative for fill slope), expressed as a ratio, eg. 1 on 4 = 0.25
2.2.3. Roadside Infrastructure for Safer European Roads (RISER) (Dupre & Bisson, 2006)
A review of several European countries in RISER provided seven main criteria used
to specify the dimensions for the safety zone. The main parameters of interest are:
1. Road Type – the class of road (motorway, national road, divided or non divided
traffic lanes, et cetera);
2. Traffic – the volume and mix of traffic observed on the road usually expressed
in Annual Average Daily Traffic (AADT) and percentage of heavy vehicles;
3. Speed – the design speed is usually the most common speed used for
designing the road, but redesign of existing roads should use observed speeds
unless they are less than the design speed;
4. Side Slope – the characteristics of the slopes adjacent to the roadway, typically
the gradient and height of the slope;
5. Horizontal alignment – separate criteria may be considered for straight and
curved sections;
6. Driving lane width – lateral width of the travel lane(s). Note that this is often
associated with road type;
7. Other – many modifications of the safety zone width may result from the
location of bodies of water, industrial areas, residential areas and railway lines
et cetera.
Table 2-3 below lists the recommended safety zone width for the following road,
speed and slope conditions.
x Coefficient Of Friction 0.3 (Wet Grass) [µ].
x Vehicles Decelerate On Roadside Without Manoeuvre. For a vehicle running off the road the worst case is a friction coefficient of 0.3 for wet grass resulting
in an available deceleration of 2.9 m/s2 [a].
x Impact Velocity 40 Km/hr after Crossing Safety Zone.
x Flat Conditions (Ideal Conditions).
Table 2-3 RISER Recommended Safety Zone Width (m)
Exit
Angle
Slope µ a
Exit Speed from Carriageway
(km/h)
(deg) (m/s²) 50 60 70
5 0 0.3 2.9 1 2 4
10 0 0.3 2.9 2 5 8
15 0 0.3 2.9 3 7 11
20 0 0.3 2.9 4 9 15
25 0 0.3 2.9 5 11 18
30 0 0.3 2.9 6 13 22
(Dupre & Bisson, 2006)
The angle that a vehicle leaves the road depends on road-tyre friction, travel speed,
lateral position of the vehicle to the carriageway, and geometrical road properties
(vertical and horizontal alignment). The theoretical safety zone calculation for 5
degrees is the recommended starting point for developing safety zone criteria.
2.2.4. Transit New Zealand State Highway Geometric Design Manual (2002)
Transit New Zealand has adopted the empirical data provided by AASHTO utilising
traffic volumes, speed & roadside geometry. This guideline specifies that the
AASHTO data represents straight level sections of roads only. Adjustments must be
made for horizontal curvature, gradient and side slope. The largest of the adjusted
[image:28.612.144.476.214.469.2]significantly affect roadside encroachment rates. American research has shown that
the Effective Traffic Volume (ETV) can be used to relate encroachment frequency
with road alignment. ETV is defined as the traffic volume on a straight flat section of
road that is equivalent to the traffic volume on a section of road with horizontal
curvature and/or grades and is calculated by the following formula.
EVT = K x AADT
Where:
AADT = AADT in Design View
K = Volume Adjustment Factor
K and M factor are obtained from Figure 2-3. The clear zone width for a straight level
road for AADT = ETV is obtained from AASHTO Clear Zone Distance Curves (see
Figure 2-3 Adjustment for Road Alignment
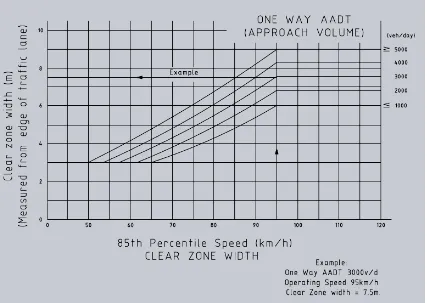
2.2.5. AustRoads Urban Road Design Manual (2003)
The Austroads clear zone method is dependent on speed, traffic volumes, batter
slopes and horizontal geometry. The figure below provides clear zone distance curve
produced through Austroads research. The manual states that in urban low speed
environments, it is difficult to achieve the specified clear zone. Existing hazards are
often within the clear zone and can be expensive or socially sensitive to relocate.
Aesthetic and urban road design considerations become more predominant and it is
the role of the designer to determine an appropriate compromise.
[image:31.612.94.521.246.549.2]
Figure 2-4 Austroads Clear Zone Distance Curve
(Austroads, 2003)
For a straight section of road and a speed of 60 km/hr, the clear zone widths for a
Table 2-4 Austroads Clear Zone widths for one-way approach AADT
AADT Width
(m)
<1000 3.0
2000 3.0
3000 3.25
4000 3.7
>5000 4.2
The clear zone widths specified in Table 2-4 increases where there is sub-standard
horizontal geometry or non-trafficable batter slopes present. The clear zone width on
the outside of curves increases by a factor depending on the operating speed and
radius which can be determined from Figure 2-5.
Figure 2-5 Austroads Horizontal Curve Factor
[image:32.612.95.534.362.619.2]An effective clear zone width is calculated depending on the grade of the batter slope
and whether the batter slope is considered trafficable for a typical vehicle. Batter
slopes classifications are shown below.
x Batter slopes steeper than 1 on 3.5 are considered “non-trafficable” and are not included in the calculation of the available clear zone.
x Batter slopes between 1on 3.5 and 1on 6 are considered “partially trafficable”.
An errant vehicle could be brought under control, however cannot rejoint the
carriageway. One half of the batter slope width can be included in the
calculation of the available clear zone.
x Batter slopes flatter than 1 on 6 are considered “trafficable” and an out of control vehicle is likely to recover. In this case, the full width of the batter slope
can be included in the clear zone.
2.2.6. British Columbia Ministry of Transportation and Highways (1996)
The Ministry had based the Clear Zone width based only on Design Speed and Road
Classification. The Ministry had determined that this approach does not provide the
optimum design. Standards have therefore been revised to reflect Design Speed
and Design Traffic Volume based on the AASHTO "Roadside Design Guide".
Therefore, Table 3 has been adopted as a guide to determine clear zone widths for
[image:33.612.217.393.531.663.2]60km/hr.
Table 2-5 British Colombia Clear Zone Widths
AADT Width (m)
<750 2.0
750 – 1500 3.0
1501 – 6000 4.0
>6000 5.0
The Clear Zone used for kerb and channel designs is 2.0m from the face of the kerb
or 0.5m behind the footpath, whichever is greater.
2.2.7. The Australian Standard for Street Lighting (AS/NZS 1158.1.3:1997)
This guideline is based on speed only. Rigid objects can be located no closer than
3m from the traffic lane, in speed zones less than 70km/hr. Frangible poles, for
example slip base poles, are permitted 1m from the traffic lane depending on the
level of pedestrian activity.
2.3 Dealing with Hazards within the Clear Zone
2.3.1. AASHTO (2002)
The recommended treatments for dealing with roadside hazards are shown below, in
order of preference.
1. Remove the obstacle to eliminate the hazard.
2. Redesign the obstacle so it can be traversed safely without likelihood of
impact.
3. Relocate the obstacle to a point where it is less likely to be impacted.
4. Reduce impact severity by using an appropriate breakaway device where
possible.
5. Shield the obstacle with traffic barrier or impact attenuator providing the barrier
is not deemed a greater hazard itself.
6. Delineate the obstacle to at least give motorists an awareness of the likely
2.3.2. Main Roads Western Australia (2006)
The Assessment of Roadside hazards recommend a Quantitative and Qualitative
evaluation to determine the most appropriate treatment to a roadside safety issue.
Qualitative evaluation utilises numerical values to assess the likelihood and
consequence of a crash. Consequences may be determined from modelling,
experimental studies or past data. Run-off the road type crashes involve the use of
encroachment factors and severity indices used with other information to quantify the
events.
The severity indices are related to crash costs which are used in a cost benefit
analysis. This analysis estimates the benefit derived from a proposed treatment
compared to the cost of implementing. If the estimated benefit exceeds the cost of
constructing and maintaining the treatment, the proposal maybe implemented.
Projects must compete for funding, therefore a benefit /cost ratio greater than one
may be enough to justify expenditure .The primary benefit obtained from selecting
one project over another is the expected reduction in future crash costs, involving
property damage, injury and fatality costs.
Qualitative evaluation involves accessing the suitability of a treatment considering
environmental and engineering factors. Environmental considerations include
recognition of unique vegetation, retention of water courses and visual pollution.
Engineering consideration include traffic growth, vehicle/pedestrian/cyclist mix, crash
history and social justice/equity.
2.3.3. The Queensland Department of Main Roads (2005) (Chapter 8)
The Road Planning and Design Manual states that the determination of an
appropriate treatment for a hazard should be carried out by evaluating alternatives,
using the Roadside Incident Severity Calculator (RISC) software to determine a
Benefit/Cost ratio (BCR) for each alternative. Engineering judgement is also
“black box” without understanding the sensitivity of input and output parameters. The
assessment process and parameters adopted by RISC are as follows:
x consider traffic volumes;
x consider horizontal and vertical geometry of the road;
x consider roadside object attributes, for example slope, hazards, size and length, distance from traffic lane;
x assess encroachment frequency calculation;
x perform object collision frequency calculation;
x determine treatment costs and ongoing maintenance requirements;
x determine severity index; and
x determine crash cost.
The Road Planning and Design Manual recommends that when a BCR greater than
1.5 for rural roads and 2.5 for urban roads is achieved, there is generally a good
basis for recommend the installation of a safety barrier or other alternative treatment.
Candidates for treatment should be prioritised depending on BCR, crash history,
available funding, politics and community expectations, combined with engineering
judgement.
2.3.4. VicRoads Road Design Note on Roadside Utility Poles (VicRoads,
2007)
Ideally, no roadside hazard should be located in the clear zone. In practice, due to
site constraints, it is sometimes difficult to satisfy clear zone requirements. A risk
analysis approach has been developed for utility poles. A pole risk score is based on
x Daily Traffic Volume
x Offset factor
x Road factor
x Curve factor
x Severity factor
Risk scores above 10 000 indicate a high risk score. The Design Note suggests that
a barrier system is likely to be the most cost effective solution for scores greater that
10 000. For scores greater than 50 000, underground power lines are suggested.
2.3.5. Department of Infrastructure Energy & Resources Tasmania (date unknown)
The Roadside Management Guide states that hazard reduction options are to be
ranked according to a benefit cost analysis and engineering judgement. The guide
recommends that computer software be utilised due to the complexity of the analysis.
Recommended software packages include:
x Roadside Incident Severity Calculator (RISC), developed by Main Roads
Queensland;
x Road Safety Risk Manager (RSRM) developed by ARRB Transport Research
in association with AustRoads; and
2.4 Summary
Authorities agree on what on what constitutes a hazard. However, variations occur
as some prefer to specify wooden objects less than 80mm diameter as a hazard,
compared to a 100mm diameter.
The determination of the Clear Zone widths varies between authorities, with the
various guidelines adopting different ranges. Table 2-6 shows a comparison of
recommended widths based on different AADTs, for 60 km/hr, on a straight section of
[image:38.612.101.513.273.595.2]roadway.
Table 2-6 Recommended widths in a straight, 60 km/hour zone
Clear Zone Widths
AADT
AASHTO Austroads AS/NZS
Standard
Motor
Cycle
Industry in
Europe
British
Columbia
RISER
1000 3.25 3.0 3.0 4.0 3.0 2
2000 4.0 3.0 3.0 4.0 4.0 2
3000 4.0 3.0 3.0 4.0 4.0 2
4000 4.0 3.0 3.0 4.0 4.0 2
5000 4.0 3.0 3.0 4.0 4.0 2
6000 4.0 3.25 3.0 4.0 5.0 2
8000 4.0 3.7 3.0 4.0 5.0 2
10000 4.0 4.2 3.0 4.0 5.0 2
AASHTO 2002, Austroads 2003, AS/NZS 1158.1.3:1997, The Motorcycle Industry in
Europe date unknown, British Columbia Ministry of Transportation & Highways 1996,
Notes:
x Austroads is the only guide that specified a one-way AADT. The assumption was made that equal traffic exists on both directions for the purpose of
comparison.
x RISER Values are for a five degree exit angle.
Design guides agree with the AASHTO recommended treatment hierarchy for
hazards, in order of preference. A quantitative and qualitative evaluation is
suggested by most guides to determine the most appropriate treatment. Computer
software is recommended for a quantitative evaluation to determine a Benefit/Cost
Ratio. The qualitative evaluation involves engineering judgement based on
environmental and engineering considerations.
3. Legal Requirements
3.1 Non-Feasance versus Mis-Feasance
In the consideration of the treatment of hazards in the clear zone, the area of law
relevant to our decision is the liability of road authorities in negligence.
The law relevant to negligence concerning road authorities was dominated in the
past by the "non-feasance principle”, otherwise knows as the "highway rule". This
rule of law meant road authorities would not be liable for mere non-feasance or the
failing to do a task in relation to the condition of roads and roadside footpaths.
However, road authorities would be liable for misfeasance, referring to work that was
conducted on a road surface, but conducted negligently.
3.2 High Court Rulings on the Liability of Road Authorities
This distinction between misfeasance and non-feasance was swept aside in Australia
by the decision of the High Court in Brodie versus Singleton Shire Council (201) 206
Mr Brodie drove a truck laden with pre-mix concrete weighing 22 tonnes across a 50
year old wooden bridge. The bridge collapsed and the truck fell into the creek bank
below. The bridge’s supporting wooden girders had been undermined by dry rot or
termites. The truck was damaged and Mr Brodie suffered injuries. He claimed that
the accident was caused by the negligence of the Shire Council.
The claim went before a trial judge where the collapse was found to have been
caused by the failure of a particular component – the supporting girders. Evidence
was provided that in recent years the council had replaced the planks on the bridge
but not the girders. At trial, Mr Brodie and the truck owner were successful. The
case was held to be one of misfeasance and that by only repairing the planking, the
Council had negligently repaired the roadway, leaving it in a condition which was
bound to deteriorate and cause a hidden danger to users of the highway.
In the first instance, the Court of Appeal reversed the decision. It was held that the
action the council took in replacing the defective planks on the bridge amounted to
mere superficial repairs to the surface and did not remove the case from the category
of non-feasance. The cause of the collapse was the failure to repair or replace the
defective girders. The Court of Appeal distinguished the issue of the replacement of
the planks from that of the defective girders. The trial judge, on the other hand, did
not sever what was done from what was left undone.
The High Court held 4:3 that road authorities should no longer be afforded an
immunity. The slim majority of the High Court decision held that the distinction
between misfeasance and non-feasance is illusory and ultimately unsustainable. In
essence, the road authority is open to a finding of misfeasance if it takes any positive
but inadequate action, even if they attempt to remove an existing danger. Failure to
undertake an action would be non-feasance and any claim would fail due to highway
immunity. The tortious liability of road authorities should be determined according to
the general principals of negligence. The High Court's decision considered the duty
of care with respect to both the design and construction. In effect, road authorities
could no longer rely on the non-feasance principle. The could no longer avoid liability
the road surface, or maintain it, or even to undertake necessary upgrade works.
Road authorities now have to take "reasonable care" that they do not create
foreseeable "risk of harm". Where a design on an existing road poses a risk, the
authority is obliged to take reasonable steps within a reasonable time to address that
potential risk.
Although the decision of the High Court in Brodie v Singleton Shire Council removed
the "misfeasance/non-feasance" distinction, they recognised that road authorities do
not have unlimited funding. In formulating new principles for the liability of road
authorities, the High Court stated that limited funding was a factor to be taken into
account when assessing the liability of any road authority for a particular incident. In
fact, this factor is a consistent theme the Brodie v Singleton Shire Council decision.
The overarching principle of liability for road authorities was stated by the High Court
to be as follows:
"[Road authorities are] obliged to take reasonable care that their exercise
or failure to exercise those powers does not create a foreseeable risk of
harm to a class of persons (road users) which includes the plaintiff.
Where the state of roadway, whether from design, construction works or
non-repair poses a risk to that class or persons, then, to discharge its duty
of care, an authority with power to remedy the risk is obliged to take
reasonable steps, by the exercise of its power within a reasonable time to
address the risk."
Importantly, the High Court accepts that the financial considerations and budgetary
imperatives are relevant when determining whether the road authority has discharged
its duty of care. However, it would seem that the High Court was wary about putting
too much weight on this factor. Lawyers from Crown Law state that:
"The public resources in question are … provided in part by government
grants; the prospect of irate ratepayers left to shoulder the apprehended
increased burden is conjectural. Further it is implicit in the submissions of
Attorney-General for Victoria submitted that it should not be assumed that road
authorities would be able to "transfer….the financial burden of increased
exposure to claims for compensation if their immunity for non-feasance is
removed. Nor should it be assumed that they will be unable to do so.”
(Sammon, 2007).
The Judgement of the High Court also makes no reference to the effect of nationally
accepted standards, such as those made by AustRoads. What the High Court did
say, consistent with the recognition of limited funds (at paragraph 155) is:
"Different roads will serve different purposes and need not be constructed
to the same standard. Thus, one would not expect all country roads to be
sealed. The cost and practicality of an alternative and safer design, if one
be available, may be weighed against the funds available to the
construction authority. This may involve striking a balance between
competing designs or methods of construction."
The High Court emphasised that the question of whether there is a duty of care is a
question separate from whether a breach of duty has been established. Authorities
with powers to design, construct and maintain roadways are obliged to take
reasonable care that their exercise or, now, failure to exercise those powers does not
create a foreseeable risk of harm to road users. In considering whether there has
been a breach of duty, the factors below are relevant.
1. The magnitude of the risk.
2. The degree of probability the risk will occur.
3. The expense, difficulty and inconvenience in taking the steps described to
alleviate the danger.
These considerations make it apparent that much will turn on the facts of each case.
The nature of the defect is more significant that the question of whether it arose by
action or neglect.
3.3 Liability of Road Authorities in Queensland
The effect of the Brodie v Singleton Shire Council decision has been partially
modified in Queensland by an Act of Parliament, namely the Civil Liability Act 2003
(QLD). This Act partially revives the "Highway Rule”. Under Section 37 of the Act, a
road authority is not liable for failure to repair a road, keep a road in repair, or to
inspect the road for the purposes of determining the need to repair a road or keep the
road in repair.
Section 37 of the Civil Liability Act 2003 (QLD) states:
Restriction on liability of public or other authorities with functions of
road authorities:
(1) A public or other authority is not liable in any legal proceeding for any
failure by the authority in relation to any function it has as a road authority-
a. To repair a road or to keep a road in repair; or
b. To inspect a road for the purpose of deciding the need to need
to repair the road or to keep the road in repair.
(2) Subsection (1) does not apply if at the time of the alleged failure the
authority had actual knowledge of the particular risk the materialisation of
which resulted in the harm.
(3) In this section-
"road" see the Transport Operations (Road Use Management) Act 1995,
schedule 4.
"road authority" means the entity responsible for carrying out any road
work.
As well as partially reinstating the old "Highway Rule", Parliament actually endorsed
(201) 206 CLR 512. In section 35 of the Civil Liability Act, the Act picks up the
recognition of limited funding by the High Court in Brodie v Singleton Shire Council
(201) 206 CLR 512, and applies this more broadly to "public authorities".
Section 35 of the Act reads as follows:
Principles concerning resources, responsibilities etc. of public or other
authorities.
The following principles apply to a proceeding in deciding whether a public or other
authority has a duty or has breached a duty-
(a) the functions required to be exercised by the authority are limited by the
financial and other resources that are reasonably available to the authority for the
purpose of exercising the functions;
(b) the general allocation of financial or other resources by the authority is
not open to challenge;
(c) the functions required to be exercised by the authority are to be decided
by reference to the broad range of its activities (and not merely by reference to the
matter to which the proceeding relates);
(d) the authority may rely on evidence of it compliance with its general
procedures and any applicable standards for the exercise of its functions as evidence
of the proper exercise of its functions in the matter to which the proceeding relates.
3.3.1. Advice from Crown Law for Main Roads Queensland
Main Roads Queensland has sought advice from Crown Law regarding the
application of legal principles to Road Safety Risk Management methodologies used
by the department. Advice from Gerard Sammon, Principal Lawyer for Crown
Solicitor is:
“In my opinion, there is a sense in which the methodology as you have
described it to me is consistent with section 35 of the Civil Liability Act,
especially if the methodology is adopted by Main Roads as a recognised
tool, as a matter of policy. For example, section 35(a) recognises the
limited funding available to road authorities and in particular, section 35(b)
This is consistent with the methodology, which analyses road projects in
terms of comparative cost/benefit outcomes.
In my opinion, therefore, the methodology and in particular, analysis
produced by it would be accepted by a court as a methodology under
which a road authority might properly allocate priority to competing
projects. In my opinion also, the products of the methodology may be
accepted as evidence by a court that the risk factors inherent in a
particular section of road have been improved on and overall basis when
compared to the previous position.
I should also add that I would expect that a court would not allow the
results of analysis produced by the methodology to definitively answer
whether a road authority is negligent, since this is the very function of the
court. In many cases, however, the result produced by the methodology
would be accepted as evidence by the court
I would also wish to sound a word of warning. Like any program or
methodology, the result is only as good as the information put into it. If
important information is left out, then the value of any assessment done by
the methodology will be therefore diminished.”
(Sammon, 2007).
Main Roads also sought advice from Crown Law on two matters related to clear
zones.
1. Installation of traffic signal posts within the Clear Zone.
2. Liability resulting from trees planted by the road authority in the Clear Zone.
Advice from Crown Law on these matters is:
1. Installation of traffic signals within the Clear Zone.
A plaintiff may collide with a traffic signal post and claim that the decision
risk by installing an immovable object such as a traffic signals pole in the
road reserve. However, the overall benefit of traffic signals, in regulating
and controlling traffic, clearly outweighs the slight raising of the level of risk
caused by the immovable pole. The methodology would help to
demonstrate this, although I would expect that the balancing of factors is
something that a court would accept intuitively.
2. Liability resulting from trees planted by the road authority in the Clear Zone.
Every traffic incident leading to litigation in court will be analysed on the
merits of the incident and its specific causation. In almost every case, the
fact that a vehicle collides with a tree will be due to negligence of someone
other than the road authority; for example, negligent driving of vehicles on
the road. Put another way, vehicles should not strike trees which are off
the trafficked road surface unless there has been negligence by someone
on the road (including, in some cases, the road authority where the road
surface is defective).
However, the fact that the vehicle strikes a tree does not mean that the
road authority responsible for planting the tree will never be liable in
negligence for at least some aspect of the vehicle striking the tree. A
claim could be made by an injured person in the vehicle that strikes the
tree, that if the tree had not been located so close to the trafficked surface,
then either the person would not have sustained injury or the injuries
would not have been as severe as they were. It is therefore possible for
there to be a claim in negligence against the road authority which plants
trees too close to the trafficked surface, on the basis that the placement of
the trees was negligent, even if the cause of the vehicle hitting the trees
was not the fault of the road authority.
A court will ask why trees were planted too close to the trafficked road
surface, when there is no discernable benefit to traffic safety from the
function of trees differently from that of a traffic signals pole. A court will
readily accept that traffic signals can improve road safety overall, even if
their introduction does introduce a measure of risk, due to the new
presence of an immovable object in the road reserve. The planting of
trees can make no such claim to some benefit to traffic safety. Main
Roads would not be able to rely upon any benefit from section 35(d) of the
Civil Liability Act set out above, because Main Roads will have failed to
follow its own standards.
An argument that the planting of trees adds to the aesthetics of the roads
surrounds will not impress a court, against the risk that they pose to road
safety with no discernable benefit to road safety. A court will ask, if
aesthetics was the goal, then was it not possible to plant soft shrubs,
which would not pose a threat to vehicles, and could in fact even cushion
the blow from a vehicle collision. A court will ask why it was necessary to
plant solid trunk trees which do pose a risk to vehicles which collide with
them.
3.4 Net Reduction of Risk
Road Authorities are charged with a duty of care to reduce risks and not to create
foreseeable risk of harm to road users. The allowance of some hazards in a clear
zone as a trade off with the removal of others does not meet duty of care
requirements. An example would be allowing trees to be planted in the centre
median, because the power poles which were located in the clear zone have been
removed or relocated. Duty of care does not work on a system of credits.
When a court comes to look at the liability of a road authority for placing
trees, in the opinion of the court, too close to the trafficked surface, in my
opinion a court is not likely to look at balancing the overall benefits of the
project which led to the planting of the trees. Instead, in my opinion, a
court will focus on the feature of the road landscape that is the subject of
the claim against the road authority. In other words, a court will focus on
why trees have been planted too close to the trafficked surface, (against
road safety, of the project that involved the planting of the trees.