TO STUDY THE PREVALANCE OF DIABETIC RETINOPATHY AND DRY EYE IN DIABETES MELLITUS AND COMPARING WITH
DURATION AND UREA ,CREATININE LEVEL
Dissertation submitted in Partial fulfilment of the regulations
required for the award of M.S. Degree in Ophthalmology
THE TAMIL NADU Dr M.G.R. MEDICAL UNIVERSITY
CHENNAI, TAMIL NADU
A Dissertation on
TO STUDY THE PREVALANCE OF DIABETIC RETINOPATHY AND DRY EYE IN DIABETES MELLITUS AND COMPARING WITH
DURATION AND UREA ,CREATININE LEVEL
Dissertation submitted in Partial fulfilment of the regulations
award of M.S. Degree in Ophthalmology
April 2015
THE TAMIL NADU Dr M.G.R. MEDICAL UNIVERSITY
CHENNAI, TAMIL NADU
TO STUDY THE PREVALANCE OF DIABETIC RETINOPATHY AND DRY EYE IN DIABETES MELLITUS AND COMPARING WITH
Dissertation submitted in Partial fulfilment of the regulations
award of M.S. Degree in Ophthalmology
DECLARATION
I hereby declare that this dissertation entitled“ To study the prevalence of diabetic retinopathy and dry eye in diabetes mellitus patients and comparing with duration and urea, creatinine level” is a bonafide and genuine research work carried out by me under the guidance of Dr. M.Hemanandini M.S.D.O, Head of the Department, Department of Ophthalmology, Coimbatore Medical College &Hospital, Coimbatore.
Date: Place:
CERTIFICATE
This is to certify that the dissertation entitled “ To study the prevalence of diabetic retinopathy and dry eye in diabetes mellitus patients and comparing with duration and urea, creatinine level” is a bonafide and genuine research work carried out by Dr. P MOHANA PRIYA in partial fulfilment of the requirement for the degree of Master of Surgery in Ophthalmology.
Guide
Department of Ophthalmology Date:
Place:
Dr.M.Hemanandini.,. MS.DO HOD, Department of Ophthalmology Coimbatore Medical College Hospital Coimbatore Date:
The Dean Coimbatore Medical College & Hospital
ACKNOWLEDGEMENT
I express my gratitude and sincere thanks to Dr S. Revwathy MD, DGO, Dean, Coimbatore medical college for permitting me to do the thesis work.
I would like to express my gratitude to my guide and teacher Dr. M. Hemanandini MS, DO, Associate professor and Head of heDepartmentof Ophtalmology for her valuable guidance and support to complete this dissertation work
I also thank Dr. G.Balaji MS DO, Associate professor of ophthalmology, Coimbatore MedicalCollege, Coimbatore for his guidance and supervision during the preparation of this dissertation.
It is my privilege to extend my regards and gratitude to my former professors Dr. A.Rajendraprasad MS DO and Dr. B Zaibunnisa MSDO for their valuable guidance.
I wish to extend my sincere gratitude to all my assistant professors Dr C JeevakalaMS DO, Dr P Sumathi MS, Dr J Saravanan MS, DrAnitha MS,
I am grateful to my parents, husband and children for giving me so much support and enlightening me throughout my life. I am grateful to all my colleagues, present and past, in the department of ophthalmology for being so friendly, helpful and co-operative, in preparing my dissertation. I would like to express my sincere thanks to all my patients for their kind co-operation.
Date:
ABBREVIATIONS DM : Diabetes mellitus
MODY : Maturity Onset Diabetes mellitus in Young individuals
GTT : Glucose Tolerance Test
SCH : Sub Conjunctival Haemorrhages DR : Diabetic Retinopathy
NPDR : Non Proliferative Diabetic Retinopathy PDR : Proliferative Diabetic Retinopathy VEGF : Vasclar Endothelial Growth Factor LASIK : Laser In Situ Keratomileusis
BMI : Body Mass Index
UAER : Urine Albumin Excretion Rate
UKPDS : United Kingdom Prospective Diabetic Survey ETDRS : Early Treatment Diabetic Retinopathy Study TBUT : Tear Film Breakup Time
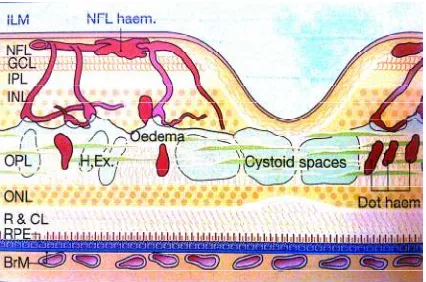
NFL : Nerve Fibre Layer OPL : Outer Plexiform Layer ILM : Internal Limiting Membrane
LIST OF PICTURES
S.No TITLE PAGE NO
1. Lacrimal apparatus 5
2. Layers of tear film 10
3. Mechanism of tear film breakup 14 4. Dynamic events during blinking 16 5. Mechanism of removal of lipid contaminated
mucus
16
6. Fluorescein strips 23
7. Tear film breakup time 24
8. Schirmer strips 26
9. Schirmer test 27
10. Micro aneurysms,pericyte dropout, and acellular capillaries
37 11. Locations of lesions in diabetic retinopathy 38 12. NPDR with blot haemorrhages, splinter
haemorrhages and cotton wool spots
38
13. Severe NPDR with IRMA and venous beading
39 14. Neovascularization of the disc 39 15. Neovascularization elsewhere 40 16. Clinically significant macular edema 41
17. DR with venous looping 42
LIST OF CHARTS
S.No TITLE PAGE NO
1. Sex Distribution 60
2. Duration of Disease 61
3. Prevalence of dry eye symptoms 62
4. Fasting Blood Sugar Range 63
5. Post Prandial Blood Sugar Range 64
6. Urea Range 65
7. Creatinine Range 66
8. Schirmer Test 67
9. Schirmer Test with dry eye symptoms 68 10. Schirmer Test and duration of DM 69 11. Urea Level and Schirmer Test 70
12. Tear film Breakup time 71
13. Urea level and TBUT 72
14. TBUT and duration of DM 73
15. TBUT with dry eye symptoms 74 16. FBS Range with dry eye symptoms 75 17. PPBS Range with dry eye symptoms 76 18. Urea Range with dry eye symptoms 77 19. Creatinine Range with dry eye symptoms 78 20. Duration of disease with dry eye symptoms 79
22. Urea Range with DR 81
23. Creatinine Range with DR 82
24. Schirmer Test with DR 83
25. TBUT with DR 84
26. FBS Range with DR 85
27. PPBS Range with DR 86
28. Sex Prediction with DR 87
LIST OF CONTENTS
S.No TITLE PAGE NO
1. Introduction 1
2. Review of Literature 43
3. Aim of the Study 56
4. Materials and Methods 57
5. Statistical Analysis 60
6. Discussion 89
7. Summary 96
8. Conclusion 98
9. Annexures
Bibliography 99
Thesis Proforma 108
Key to Master Chart 110
INTRODUCTION
Diabetes mellitus is a group of metabolic disorder characterized by chronic hyperglycemia associated with disturbances of carbohydrate, protein and fat metabolism due to absolute or relative deficiency in insulin action and or secretion . Diabetes mellitus causes long term damage , dysfunction and failure of organs expecially the eyes, kidneys, heart, nerves and blood vessels.
TYPES OF DIABETES MELLITUS Type 1
Beta cell destruction leading on to insulin deficiency 1. Auto immune
2. Idiopathic Type 2
1. Predominantly insulin resistance
2. Predominantly insulin secretory defects Other special types of diabetes melittus
1. Genetic defects of beta cell dysfunction,e.g.MODY 1 TO 6 2. Genetic defects in insulin action,.e.g.Type A insulin resistance 3. Diseases of exocrine pancreas, e.g Fibro Calculus pancreatopathy 4. Endocrinopathies,e.g. acromegaly, cushings
6. Infections, e.g., congenital rubella 7. Other genetic syndromes
8. Gestational diabetes mellitus
DIAGNOSTIC CRITERIA OF DIABETES MELITTUS
Diabetes is diagnosed if the fasting value is ≥ 126 mg or 2 hour plasma glucose is ≥ 200 mg
Impaired GTT is present when the two – hour value is in the range of 140 – 199 mg/dl
Impaired glucose tolerance is present when the fasting level is ≥ 100 and ≤ 125 and the 2 hour value is ≤ 140 mg /dl.
AETIOPATHOGENESIS OF TYPE 1 DM 1. Genetic factors
2. Immunological factors 3. Viruses / toxins
4. Dietary factors.
COMPLICATIONS OF DIABETES MELITTUS ACUTE COMPLICATIONS –Diabetic ketoacidosis
CHRONIC COMPLICATIONS- Microvascular and macrovascular
• Vasculopathy
• Retinopathy
• Neuropathy
• Nephropathy
OPHTHALMIC MANIFESTATIONS OF DIABETES MELITTUS
• Anterior segment manifestations
• Posterior segment manifestations ANTERIOR SEGMENT MANIFESTATIONS
• Lid and adnexa- hordeolum externum, hordeolum internum and chalazion
• Conjunctiva –recurrent SCH and dry eye or conjuctival xerosis
• Cornea – recurrent corneal erosions
• Anterior chamber and the angle – primary open angle glaucoma, neovascular glaucoma
• Iris -rubeosis iridis
• Pupil- smaller pupil
POSTERIOR SEGMENT MANIFESTATIONS
• Vitreous –asteroid hyalosis , vitreous haemorrhage
LACRIMAL APPARATUS
• ANATOMY
• PHYSIOLOGY
• DRY EYE
• EVALUATION
ANATOMY OF LACRIMA L APPARATUS
• Lacrimal gland
• Upper and lower puncta
• Canaliculi
• Lacrimal sac
• Naso lacrimal duct
LACRIMAL GLAND ANATOMY
UPPER AND LOWER PUNCTA
They are located 6 and 6.5 mm lateral to the medial canthus respectively. They are visible only on slight eversion of the eyelids.
CANALICULI
Canaliculi have vertical and horizontal parts. The proximal limb is about 2 mm and is vertically oriented. Canaliculi then turn medially and run horizontally for about 8 mm before opening into the common canaliculus and empty into the lacrimal sac. Valve of the Rosenmuller which prevents reflux entry of tears into the canaliculi.
LACRIMAL SAC
It is about 12 to 15 mm long and lies in the lacrimal fossa bounded by the posterior and anterior lacrimal crest. The lacrimal sac is bounded superiorly by the medial palpebral ligament. Lacrimal and frontal bone of maxilla separate the lacrimal apparatus from the middle meatus
THE NASOLACRIMAL DUCT
PHYSIOLOGY OF LACRIMAL SYSTEM TEAR SECRETION
The tear film composed of three layers. 1. Mucin layer
2. Aqueous layer 3. Lipid layer
Aqueous layer of the tear film is secreted by the lacrimal glands and the accessory lacrimal glands. The mucin layer is contributed by the goblet cells.. The lipid layer is secreted by the meibomian glands.
TEAR FILM FUNCTIONS
1. Tear film form an almost perfectly smooth optical surface on cornea by filling in and smoothening out small surface irregularities in the corneal epithelium.
2. It serves to keep the surface of the cornea and conjunctiva moist.
4. It transfers the oxygen from the ambient air to the cornea.
5. It prevents infection due to the presence of antibacterial substance such as lysosyme, betalysin, lactoferrin, immunoglobulins and other proteins.
6. It washes away debris and noxious irritants.
STRUCTURE OF TEAR FILM LIPID LAYER
This outermost superficial oily layer derived from the secretions of meibomian, zeiss, and moll glands. This layer consists of lipids having low polarity, such as wax and cholesterol esters. High polarity lipids present in less amounts. The lipid layer thickness is about 0.1 µm and depends on palpebral fissure width, it increases when lids are partially closed. The lipid layer prevents the overflow of tears and retards their evaporation.
AQUEOUS LAYER
MUCOUS LAYER
The deepest layer is the mucous coat. It plays vital role in the stability of the tear film. The thickness layer is 0.02 -0.05 µm. This mucus layer is secreted by the goblet cells of conjunctiva, crypts of henle and the manz glands. Clear corneal epithelium is hydrophobic surface. Mucin produced by goblet cells, mixed and spread by action of lids ,gets adsorbed on the cell membrane of the epithelial cells and anchored by their microvilli forming a new hydrophilic surface. It plays important role in tear film stability.
The mucin lubricates the ocular and palpebral surfaces. It also provides a slippery coating over foreign bodies, thus protecting the cornea against abrasion.
TEAR FILM DYNAMICS 1. Secretion of tears
2. Formation of tear film
3. Retention and redistribution of tear film 4. Displacement phenonmenon
SECRETION OF TEARS
Tears are secreted by main lacrimal gland and accessory glands. Reflex tear secretion occurs in respond to sensations from the cornea and conjunctiva probably produced by evaporation and breakup of tear film. Hyper secretions occurs due to irritative sensations from the cornea and conjunctiva. Afferent pathway for this secretion is formed by the fifth nerve and efferent by parasympathetic supply of lacrimal gland
The normal rate of tear production is about 1.2µl/min, tear volume in the eye at any time about 7 µl and turn over rate is 5 to 7 minutes FORMATION OF PREOCULAR TEAR FILM
Sequence of events in the formation of precorneal tear film 1. Lids surfacing the cornea with a thin layer of mucus 2. On this new surface the aqueous component of tears now
spread spontaneously
RETENTION AND REDISTRIBUTION OF TEAR FILM
Outermost layer of the corneal epithelium, along with mucopolysaccharides play an important role in retaining fluid layer on the corneal surface.
DISPLACEMENT PHENONMENON
It is due to thin mono molecular layer on the surface of cornea.
EVAPORATION FROM THE TEAR FILM
Wax esters and cholesterol esters in the lipid layer retard the evaporation of the water. Superficial lipid layer is important under conditions of low humidity and turbulent air flow.
STABILITY, DRYING AND RUPTURE OF THE TEAR FILM
The tear film can function properly only if the tear film covers entire corneal surface and it is re-established quickly and completely after a blink
Mechanism of tear film break up
1. Tear film thins uniformly by evaporation
2. Tear film is thinned out to some critical thickness, lipid molecules are attracted by the mucin layer. So the mucin becomes hydrophobic and the tear film ruptures
Figure 4 : Dynamic events during blinking
DYNAMIC EVENTS DURING BLINKING
Complex of events take place during blinking. When upper lid moves down. The superficial layer is compressed. Lipid contaminated with mucus dragged into the lower fornix. When eyes open ,lipid spread in the form of mono layer followed by spreading of excess lipid. The spreading liquid drags aqueous with it, which results in thickening.
ELIMINATION OF TEARS
By active lacrimal pump mechanism. The muscle involved is preseptal portion of orbicularis oculi, which arise from the the lacrimal fascia and posterior lacrimal crest. It operates with blinking movements.
Events occuring during eye closure
1. Contraction of pretarsal fibres of orbicularis oculi compresses the ampulla and shortenes canaliculi. This movement propels tear fluid towards the lacrimal sac.
2. Contraction of pre tarsal fibres of orbicularis pulls lacrimal fascia and lateral wall of lacrimal sac laterally. So tear from canaliculi draws into lacrimal sac.
Events occuring during eye open
1. Relaxation of pre tarsal fibres of orbicularis oculi allows the canaliculi to expand and reopen. This draws the fluid from the lacrimal lake.
2. Relaxation of Horner muscle allows lacrimal sac to collapse. This resulting in opening of naso lacrimal duct.
Drainage of lacrimal fluid into nasal cavity 1. Gravity helps in downward flow
2. Negative pressure in the naso lacrimal duct draws the tear into the nose.
3. Hasner valve opens until pressure in the nose is less than that of the naso lacrimal duct. When intra nasal pressure raises hasner valve closes.
TEAR FILM ABNORMALITIES
Dry eye is described as a state of abnormal tear film caused by alteration in its composition and conditions affecting their stability.
CLASSIFICATION OF TEAR FILM ABNORMALITY
2. Mucin deficiency occur in hypovitaminosis A, ocular pemphigoid, SJ syndrome, drug induced, and chemical burns 3. Lipid abnormality occur in chronic blepharitis
4. Lid function abnormality seen in exposure keratitis, symblepharon, lagophthalmos and pterygium
5. Epithelial dysfunction seen in anaesthetic cornea, corneal epithelial abnormality of any cause
KERATO CONJUCTIVITIS SICCA- ANY EYE WITH SOME DEGREE OF DRYNESS
CLASSIFICATION OF KERATO CONJUCTIVITIS SICCA 1. Aqueous layer deficiency
. sjogrens syndrome . non sjogrens 2. Evaporative
. meibomian gland disease . exposure
CAUSES OF NON SJOGRENS KERATO CONJUCTIVITIS SICCA 1. Primary - age related hypo secretion
2. Lacrimal gland destruction -tumours and inflammation
3. Absence or reduction of lacrimal gland tissue - surgical removal or rarely congenital
4. Conjunctival scarring and obstruction of lacrimal gland ductules - chemical burns, cicatricial pemphigoid, stevens Johnson syndrome , long standing trachoma
5. Neurological lesions with sensory or motor reflex loss 6. Vitamin A deficiency.
CAUSES OF EVAPORATIVE KERATO CONJUCTIVITIS SICCA 1. Meibomian gland dysfunction
. posterior blepharitis . rosacea
. atopic keratoconjunctivitis
. congenital meibomian gland absence 2. Lagophthalmos
. severe proptosis . facial nerve palsy . eye lid scarring
3. Miscellaneous
. cantact lens wear
. environmental factors such as air conditioning
CLINICAL MANIFESTATIONS OF DRY EYE OCULAR SYMPTOMS
1. Feeling of dryness 2. Grittiness
3. Burning
4. Stringy discharge
5. Transient blurring of vision 6. Redness
OCULAR SIGNS
1. Posterior blepharitis
2. Redness and mild keratinization of conjunctiva
3. Lipid contaminated mucin can accumulate as particles in tear film
4. Marginal tear meniscus is normally about 1 mm, it is less or absent in dry eye
5. Froth in tear film
6. Punctuate corneal erosions
8. Peripheral superficial corneal vascularisation, epithelial break down, melting, perforation, bacterial keratitis are due to dry eye complications
DRY EYE DIAGNOSIS BY
Tear production - schirmer test stability of the tear film - TBUT
TEAR FILM BREAKUP TIME
Tear film breakup time is abnormal in aqueous deficiency and meibomian gland disorders
2% fluorescein or an impregnated fluorescein strip soaked with saline is instilled into conjuctival lower fornix
Patient is asked to blink
Tear film is examined with slit lamp examination by using cobalt blue filter, formation of dry spots or lines on fluorescein areas indicates dry eye
Break up time is an interval between the last blink and the appearance of the dry spot. TBUT of less than 10 seconds is considered as abnormal.
SCHIRMER TEST
Assessing aqueous tear production
Measuring the amout of wetting of a special no 41 Whatman filter paper, it is 5 mm wide and 35 mm long
Schirmer test 1- with out an local anaesthetic. It measures both basal and reflex secretion
Schirmer test 2 - with an local anaesthetic. It measures only basal secretion
The filter paper is folded 5mm from one end and placed in the lower fornix at the junction of the middle one third and outer one third of the lower lid.
After 5 minutes the Schirmer strip is removed and the amout of wetting from the fold measured.
OTHER TESTS FOR DRY EYE
1. Ocular surface staining with rose Bengal and fluorescein 2. Fluorescein clearance test
DIABETIC RETINOPATHY
The classification of diabetic retinopathy is based on clinical features. it is divided into
1. NON PROLIFERATIVE DIABETIC RETINOPATHY 2. PROLIFERATIVE DIABETIC RETINOPATHY
NPDR refers to presence of intra retinal vascular changes with out the presence of extra retinal fibrovascular tissue. It is further subdivided into mild ,moderate and severe. NPDR is also referred as background diabetic retinopathy. Proliferative diabetic retinopathy refers to presence of extraretinal fibrovascular proliferative tissue. It is further subdivided into early, highrisk or advanced.
PATHOGENESIS OF DIABETIC RETINOPATHY
Cause of diabetic retinopathy is exactly not known. It is believed that exposure to hyperglycemia over an extended period results in biochemical and physiological changes that ultimately cause endothelial damage. Specific changes in retinal capillaries include loss of pericytes and thickening of the basement membrane resulting in occlusion of capillaries and nonperfusion of retina and decompensation in retinal barrier function .This leads to retinal leakage and retinal edema.
The following hematological and biochemical abnormality have been correlated with the prevalence and severity of retinopathy.
Increased platelet adhesiveness Increased erythrocyte aggregation Abnormal level of serum lipids Defective fibrinolysis
Abnormal level of growth hormone Increased level of VEGF
Abnormalities in serum and whole blood viscosity Local and systemic inflammation
RISK FACTORS FOR DIABETIC RETINOPATHY 1. Duration of diabetes
2. Poor glycemic control
3. Pregnancy - rapid progression of DR 4. Hypertension
5. Nephropathy 6. Hyperlipidemia 7. Cataract surgery 8. Obesity
CLASSIFICATION OF DIABETIC RETINOPATHY BY ETDRS CLASSICATION
1. Non proliferative Diabetic Retinopathy 2. Proliferative Diabetic Retinopathy NPDR CLASSIFIED INTO
1. No NPDR
2. Very Mild NPDR 3. Moderate NPDR 4. Severe NPDR 5. Very severe NPDR
PROLIFERATIVE DIABETIC RETINOPATHY [PDR] 1. Mild - moderate PDR
2. High risk PDR
3. Advanced diabetic eye disease DEFNITIONS
Very mild NPDR - micro aneurysms only
Mild NPDR - any or all of : microaneurysms, retinal haemorrhages, exudates, cotton wool spots, upto the level of moderate NPDR. No intra retinal micro angiopathy or significant beading.
Moderate NPDR - severe retinal haemorrhages in 1 or 3 quadrants, mild intra retinal microvascular abnormality, significant venous beading can be present in no more than 1 quadrant, cotton wool spots commonly present.
Severe NPDR - The 4-2-1 rule; one or more of Severe haemorrhages in all 4 quadrant
Significant venous beading in two or more quadrants
Moderate intra retinal micro vascular changes in 1 or more quadrants
Very severe - 2 or more of the severe NPDR criteria PDR
Mild to moderate PDR - NVD or NVE, but extent insufficient to meet high risk criteria
High risk PDR - new vessels on the disc about 1/3 of disc area, any NVD with vitreous or pre retinal haemorrhage, NVE greater than ½ disc area with vitreous and pre retinal haemorrhage.
Advanced diabetic eye disease includes
Tractional retinoschisis Rubeosis iridis
MICRO ANEURYSMS
Are localised saccular outpouching of the capillary wall, often caused by pericyte loss.
They are round intra retinal lesions of 30 - 120 µ in size and are located in inner nuclear layer of the retina
Signs of microaneurysms - tiny red dots , they are earliest sign of diabetic retinopathy. They may be indistinguishable from dot haemorrhages.
RETINAL HAEMORRHAGES
Retinal nerve fibre layer haemorrhages Intra retinal haemorrhages
Deeper dark round haemorrhages
Retinal nerve fibre layer haemorrhages - flame shaped, occurring at the nerve fibre layer, they follow the architecture of the nerve fibre layer. They arise from superficial precapillary arterioles.
Deeper retinal haemorrhages - haemorrhagic retinal infarcts located in middle layer of retina. They are significant marker of progression to retinal neovascularisation.
EXUDATES
They are hard exudates.
Exudates are chronic localized edema and appear at the junction of the normal and swollen retina.
They are composed of lipoproteins and lipid laden macrpophages and are located in the main outer plexiform layer of the retina.
Signs - yellow waxy lesions with distinct margins, arranged in rings or clumps in posterior pole, surrounding local aneurysms. They get absorbed over a period of time.
COTTON WOOL SPOTS
They are due to ischemic infarction of the NFL layer of retina. Due to interruption of axoplasmic stasis with in the axons
INTRA RETINAL MICROVASCULAR ABNORMALITY
They are arteriolar - venular shunts that run from the retinal arterioles to venules.
Signs - fine, red irregular, intra retinal lines that run from arterioles to venules without crossing major blood vessels
CAUSES OF DIMNISHED VISION IN DIABETIC RETINOPATHY 1. Macular edema
2. Macular ischemia 3. Vitreous haemorrhage
4. Tractional retinal detachment
5. Optic atrophy due to direct papillopathy or following extensive panretinal photocoagulation
CSME DEFINED AS
1. Thickening of retina at or with in 500 µ of the centre of the macula
2. Hard exudates at or with in 500 µ of the centre of the macula with adjacent retinal thickening
PROLIFERATIVE DIABETIC RETINOPATHY
One quarter of the retina must be non perfused before proliferative retinopathy develops.
NVD - neovascularisation on or within 1 disc DD of the optic nerve head
Figure 11 :Locations of lesions in diabetic retinopathy
[image:51.612.154.461.390.605.2]Figure 13 :Severe NPDR with IRMA and venous beading
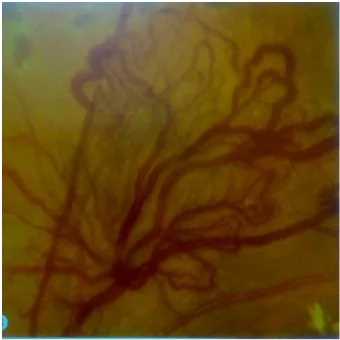
[image:52.612.152.462.326.580.2]Figure 17 :DR with venous looping
REVIEW OF LITERATURE
Dry eye was first described by French dermatologist Gougerot. He described dry eye was due to atrophy of the salivary and conjunctival gland in middle aged women. The Swedish ophthalmologist Henrik Sjogren in 1933 established the term kerato conjunctivitis sicca. He described a disease characterised by auto immune damage to lacrimal gland tissue, decreased tear secretion and ocular surface disease1.
Maintenance of normal tear film depends on normal ocular surface. Normal ocular surface means normal epithelial surface and normal mucous surface2. Mishima was the first to recognise the contribution of the aqueous humour to the aqueous component of the tear film.
The lacrimal gland is innervated by both parasympathetic and sympathetic nerves. Parasympathetic fibres travelling along the lacrimal nerve stimulate lacrimal gland secretion3. Beta 1 adrenergic agonists also stimulates lacrimal gand secretion. So parasympathetic blockers and beta 1 adrenergic blockers can diminish lacrimal gland secretion. Lacrimal secretory system has two parts.
Normal blink rate averages once every 5 seconds. Blinking is important for spreading the freshly secreted tears. Decreased corneal sensation in one eye does not diminish the blink rate. Diminished corneal sensation in both eye diminish the blink rate. So decrease in corneal sensation resulting in decreased tear secretion4. Meibomian gland dysfunction occur in meibomitis. This result in increased tear evaporation5.
Diabetes is the leading cause of blindness in twenty to seventy four year age group6. Dry eye is the most common problem encountered in patients with diabetes mellitus. Due to dry eye patients develop corneal complication which include SPK, trophic ulceration and corneal epithelial defect7. Dry eye has many causes. Old age is one of the cause for dry eye8. The exact mechanism for cause of dry eye is not known9. Autonomic dysfunction plays a role in causing dry eye. Aldose reductase enzyme which converts glucose to sorbitol also plays a role. Aldose reductase inhibitors improve tear dynamics.10
Diabetes is associated with ocular conditions such as diabetic retinopathy , changes in refraction, cataract, nerve dysfunction, macular edema and glaucoma. Dry eye is the most common complication12. More than half of the patients have dry eye and nearly 53% of the diabetes patients may experience dry eye symptoms13 .
Cousen et al studied production of tears and sensation of cornea in diabetes. most common dry symptoms encountered in diabetes are foreign body sensation and burning. In addition to dry eye the following are encountered in diabetes14,15. Tear film instability, metaplasia of conjunctiva, decreased goblet cells, decreased sensation of cornea and decreased tear film lipid layer14. There is a close association between the family history and dry eye symptoms15.
Both lid treatment and control of diabetes both are needed in evaporative dry eye
CAUSAL FACTORS FOR DIABETIC DRY EYE Most frequently cited associations
1. Autonomic neuropathy 2. Due to hyperglycemia 3. Insulin deficiency 4. Inflammation
Autonomic neuropathy and hyperglycemia
Benetis – Del -Castillo et al studied relation between innervation of cornea with confocal microscopy and corneal sensations using noncontact esthesiometry in dry eye patients20. Dry eye patients have decreased corneal sensitivity due to change in corneal nerve architecture and decrease in volume and density of nerve architecture..
Insulin deficiency
Insulin exerts important effects on the glands throughout the body. Insulin mediates lot of functions, such as influx of nutrients , storage of energy, expression of genes and synthesis of proteins. Metabolism of lacrimal gland and cornea, growth, proliferation and growth of epithelial cell are influenced by insulin
Inflammation
It is another frequent manifestation of diabetes. So hyperglycemia alters inflammatory reactions and reduces tear secretion.
Jin et al described type 2 diabetes mellitus patients develop dysfunction of tear film. Dry eye can lead to vision deficit, perforation and scarring of the cornea and bacterial infection. Diagnosis of dry eye made early and treated will protect the cornea from above complications21.
Whatman no 41 millimetre filter paper strip measuring 5× 30 mm placed in lower fornix and it is kept for a period of 5 minutes, values below 10 mm are pathological.
Lemp ma et al describes factors changing TBUT in normal individuals. Tear film break up time used to measure tear film stability. Less than 10 seconds considered to be abnormal22.
Dogru stated that diabetes mellitus patients with autonomic neuropathy and uncontrolled diabetes patients exhibit pathological schirmer and TBUT test23. Schirmer test is an useful screening test for diagnosing lacrimal hyposecretion. but not adequate for tear production thresthold. Its sensitivity is between 10% and 30%. In diabetic patients schirmer test exhibit lower than normal values24. 55% of patients with diabetes had dry eyes symptoms signs25. The beaver dam eye study suggested that twenty percent of diabetes mellitus patients aged between forty three and eighty six years diagnosed to have dry eyes26.
Boyed BF describes etiological factors for dry eye28 1. Increasing age decreases lacrimal gland secretion
2. Hormonal changes in women, menopausal women have reduced amout of androgens produced by ovaries.
3. Auto immune diseases
4. Pharmacological agents - anti depressants, anxiolytics, anti histamines, anti cholinergics, anti hypertensives, anti psychotics, anti parkinsonians, diuretics
5. Vitamin a deficiency - vitamin A is important for mucin production Mucin is important for the corneal surface wetting and its deficiency lead into instability of tear film.
6. Defective corneal sensation due to various etiologies, contact lens users and following LASIK
7. Deficient efferent innervations due to facial nerve palsy
8. Corneal defects such as corneal epitheliopathy, or corneal dystrophy and eyelid disorders such as ectropion and lagophthalmos causes failure of tears to spread over to ocular surface.
Moss and associates told that females had high incidence of dry eyes compared to males29
Nepp and associates stated that severity of dry eye correlates with diabetic retinopathy severity30. In diabetes goblet cell density reduced in patients with neuropathy31. Decrease in mucin layer results from involvement of conjunctival surface32.
Schultz et al reported forty seven to sixty four percentage of diabetic patients having corneal abnormalities such as epithelial defects, delayed healing of epithelium, corneal ulcer and kerato conjunctivitis sicca33. These manifestation are responsible for clinical corneal manifestation of diabetes
DM is an international health problem with prevalence ranging from 2 % to 11. 7 % in studied population around the world34.
Yun et al stated that endothelial dysfunction as an important independent predictors of increased DR prevalence in patients with type 2 diabetes mellitus. Pathogenesis of DR involves inflammation and endothelial dysfunction35.
Tomic et al revealed the relationship between inflammatory markers and anthropometric parameters and their relation with DR in patients with type 2 DM36. High levels of inflammatory markers found in diabetes patients.37,38
Diabetic patients with macular edema and PDR had increased levels of VEGF and cytokines in their vitreous than those without macular edema and PDR39.
Increased duration influence the occurrence of DR and its severity was due to prolonged exposure to hyperglycemia. Duration of diabetes is independant risk factor. Ten percent of the newly diagnosed diabetes shows DR, suggesting that these patients not diagnosed earlier.
Pradeep et al observed male gender to be associated with the presence of any DR. But not its severity43,44.
BMI
The inverse relation between body mass index and DR was noticed in Indian based population studies45,46. This was due to the catabolic effect of the lack of insulin over a longer duration of hyperglycemia. High BMI was observed in subjects with diabetes. But in asian population patients with diabetes mellitus are lean and low BMI47,48,49. Asian with type 2 DM show decreased insulin secretion , but increased insulin sensitivity, seen in asian diabetic patients.
Cataract surgery
Cataract surgery is risk factor for DR44. Microalbuminuria
Microalbuminuria is risk factor for the DR in patients with type 2 diabetes mellitus. The urine albumin excretion rate was assessed via 24 hour urine collection and measured by immunoturbidimetric assay. Normoalbuminuria was defined as UAER < 20 µg/ minute in 2 out of 3 consecutive test taken within 2 - 3 months.
Microalbuminuria is a marker of endothelial dysfunction may influence on alteration in the vasculature of retina and kidneys. Microalbuminuria is an independant risk factor for the incidence of DR in patients with type 1 DM50,51,52,53. In patients with type 2 DM microalbuminuria is independently associated with DR. Studies reported that DR might develop in patients with type 2 DM patients without microalbuminuria54,55,56.
Possible risk factor for diabetic retinopathy
1. Number of years since diagnosis of DM57,58 2. HbA1c levels
3. Coexistence of hypertension 4. Age
Duration
Important predictor of DR and its severity57,58,59. Hypertension
It is an important risk factor for the onset and progression of disease and it is an independant risk factor for DR60,61. The UK Prospective Diabetes Study demonstrated that blood pressure control is associated with a reduction in DR prevalence.
HbA1c levels
High HbA1c levels are closely associated with severe DR. Decrease in HbA1c concentrations by 1 % leads to an estimated reduction of 30 % in the risk of microvascular complications62,63.
Epidemiological studies in diabetic retinopathy
1. Wisconisin Epidemiologicaly Study on Diabetic Retinopathy 2. Diabetic Retinopathy Study
3. Diabetes Control and Complications Trial 4. Diabetic Retinopathy and Vitrectomy Study 5. UK Prospective Diabetic survey
These studies established the various risk factors and provided guidelines for the management of diabetic retinopathy.
The Diabetes Control and Complications Trial revealed that good control of metabolic status will reduce the risk of diabetic retinopathy and delays the onset of retinopathy in patients who do not have retinal changes at the time of presentation
United Kingdom Prospective Diabetic Study
Study confirmed that good glycemic control in type 2 non insulin dependant diabetes mellitus is also beneficial and delays the onset of retinopathy
Wisconsin Epidemiological Study of Diabetic Retinopathy
AIM OF THE STUDY
1. To correlate the dry eye and diabetic retinopathy with duration of diabetes and urea, creatinine level.
2. Evaluation of risk factors attributed to dry eye and diabetic retinopathy in diabetes mellitus patients
MATERIALS AND METHODS STUDY DESIGN
It is a hospital based cross sectional study STUDY PERIOD
This study was done between the periods from August 2013 to July 2014
STUDY POPULATION
The study was done on all diabetic patients attending ophthalmology outpatient clinic
Before commencing the study Ethics committee approval was obtained from the Coimbatore medical college and government hospital. Diabetic patients attending outpatient clinic were screened for dry eye and diabetic retinopathy after attaining consent.
Protocol
Informed oral consent obtained Detailed history taking
Name , age, sex, presenting symptoms, duration and associated systemic diseases were noted.
Regarding diabetes
Inclusion criteria
All patients of either sex in all age groups diagnosed to had diabetes mellitus of any duration.
Exclusion criteria
Known case of ocular surface disorder Patients who are using contact lenses History of ocular surgeries in past
Patients on local or systemic medications which cause dry eye.
QUESTIONNAIRE IN DRY EYE PATIENTS 1. History of discomfort, pain and duration 2. History of foreign body sensation
3. History of itching
4. History of foreign body sensation 5. History of blurred vision
6. History of redness of eyes 7. History of photophobia
8. History of difficulty in opening the eyes and history of watering of eyes
Ophthalmic examination
1. Both visual acuity and best corrected visual acuity assessed using snellen chart
2. Detailed anterior segment examination using slit lamp, condition of lid, meibomian gland and corneal surface were noted
3. Subjects are asked to answer the questionnaire
4. Tear film evaluation done by schirmer test and tear film break up time
5. Intra ocular tension measured by applanation tonometer
6. Detailed fundus examination under full mydriasis attained by 1 % tropicamide and 5 % phenylephrine with both direct and indirect ophalmoscope.
7. Diabetic retinopathy graded according to ETDRS criteria 8. All findings were noted and the final ophthalmic status noted 9. At the end of the study period the data were given to an
STATISTICAL ANALYSI
Total no patients included in the study
Gender Female
Male Total
Table 1 shows among 150 patients,100 patients are females and 50 patients are
33%
STATISTICAL ANALYSIS
Table-1 s included in the study : 150
Sex Distribution
Gender
No of
patients Percent
Female 100 66.7
Male 50 33.3
Total 150 100.0
Table 1 shows among 150 patients,100 patients are females and 50 patients are males
67% 33%
SEX Distribution
Female Male
Duration Less than 1 yr
1 to 5 yrs 6 to 10 yrs 11 to 20 yrs
Table 2 shows, less than 1 year duration 1 to 5 years duration - 61.3 %
6 to 10 years duration – 25.3% 11 to 20 years duration -9.3%
4.0 0.0 10.0 20.0 30.0 40.0 50.0 60.0 70.0
Less than 1 yr
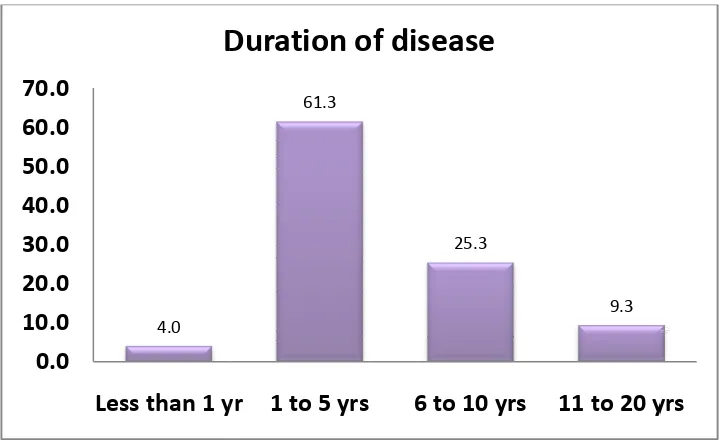
[image:74.612.126.486.371.591.2]Duration of disease
Table-2
DURATION RANGE
Duration Frequency Percent Less than 1 yr 6 4.0
1 to 5 yrs 92 61.3 6 to 10 yrs 38 25.3 11 to 20 yrs 14 9.3
less than 1 year duration -4 % 61.3 % 25.3% 9.3% 61.3 25.3 9.3
Less than 1 yr 1 to 5 yrs 6 to 10 yrs 11 to 20 yrs
Duration of disease
PREVALENCE OF DRY EYE SYMPTOMS
DE Symptoms
Absent Present Total
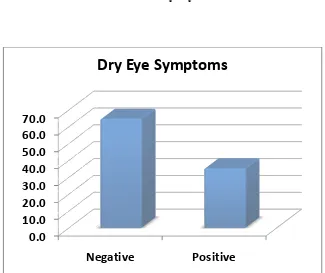
Table 3:shows 64.7% had dry eye symptoms. 35.3% had no dry eye symptoms
0.0 10.0 20.0 30.0 40.0 50.0 60.0 70.0 Negative
[image:75.612.143.468.356.629.2]Dry Eye Symptoms
Table -3
PREVALENCE OF DRY EYE SYMPTOMS
DE Symptoms
No of patients
Percent
Absent 97 64.7
resent 53 35.3
150 100.0
DE- Dry Eye
had dry eye symptoms. 35.3% had no dry eye symptoms
Negative Positive
Dry Eye Symptoms
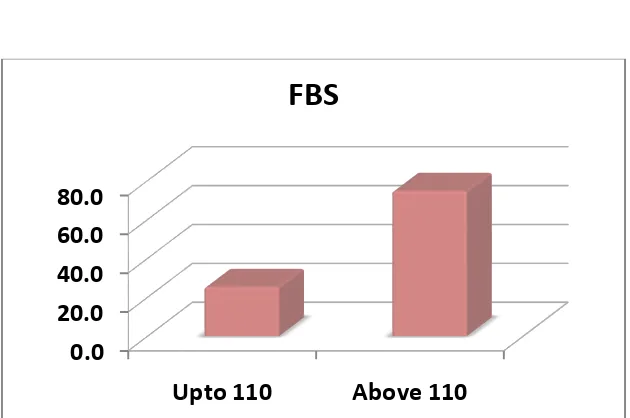
FASTING BLOOD SUGAR RANGE
Tabe 4 shows 25.3% of patients had FBS less than 110mg/dl. 74.7% had FBS
0.0 20.0 40.0 60.0 80.0
Upto 110
FBS Range FBS < 110
[image:76.612.149.464.341.550.2]FBS >110 Total
TABLE - 4
FASTING BLOOD SUGAR RANGE
Tabe 4 shows 25.3% of patients had FBS less than 110mg/dl. 74.7% had FBS more than 110mg/dl
Upto 110 Above 110
FBS
FBS Range Frequency Percent FBS < 110 38 25.3
FBS >110 112 74.7
Total 150 100.0
POST PRANDIAL BLOOD SUGAR RANGE
This table shows 37 patients had PPBS less than 160 mg/dl. 133 patients
0.0 10.0 20.0 30.0 40.0 50.0 60.0 70.0 80.0
Upto 160
PPBS Range
Upto 160 Above 160
Total
Table – 5
POST PRANDIAL BLOOD SUGAR RANGE
table shows 37 patients had PPBS less than 160 mg/dl. 133 patients more than 160 mg/dl
Upto 160 Above 160
PPBS
PPBS Range Frequency Percent
Upto 160 37 24.7
Above 160 113 75.3 150 100.0
Urea Range Upto 40 More than 40
Total
127 patients had urea level less than 40 mg /dl. 23 patients had urea level
0.0 20.0 40.0 60.0 80.0 100.0
[image:78.612.137.474.384.613.2]Upto 40
Table -6 UREA RANGE
Urea Range Frequency Percent
127 84.7
More than 40 23 15.3
150 100.0
urea level less than 40 mg /dl. 23 patients had urea level more than 40 mg/dl
Upto 40 Above 40
UREA
133 patients had Creatinine level less
Creatinine more than 1 mg/dl
0.0 20.0 40.0 60.0 80.0 100.0
Upto 1
Creatinine Range Upto 1 More than 1
Total
Table -7
Creatinine Range
133 patients had Creatinine level less than 1 mg/dl. 17 patients had Creatinine more than 1 mg/dl
Above 1
CREATININE
Creatinine
Frequency Percent
133 88.7
17 11.3
150 100.0
Schirmer Positive Negative
Total
Among 150 patients, 43 patients were Schirmer negative for Schirmer test
0.0 20.0 40.0 60.0 80.0
[image:80.612.139.473.331.563.2]Positive
Table -8 SCHIRMER TEST
Schirmer Frequency Percent Positive 43 28.7 Negative 107 71.3 Total 150 100.0
Among 150 patients, 43 patients were Schirmer test positive. 157 patients were negative for Schirmer test
Positive Negative
Schirmer Test
Schirmer test Positive Schirmer test
Negative
Among 53 symptom positive patients, 29 of them Schirmer test positive and 24 of
0 10 20 30 40 50 60 70 80 90 Asymptomatic Patients
Schirmer test with Dry Eye symptoms
Schirmer test Positive
Table -9 SCHIRMER TEST Asymptomatic patients Symptomatic patients Schirmer test
14 29
Schirmer test Negative
83 24
Among 53 symptom positive patients, 29 of them Schirmer test positive and 24 of them Schirmer test negative.
Asymptomatic Patients Symptomatic Patients
Schirmer test with Dry Eye symptoms
Schirmer test Positive Schirmer test Negative
SCHIRMER TEST AND DURATION OF DIABETES Schirmer test Less than 1 yr Positive negative
P value of above comparison was patients 10 patients had 1 to 5 years years of diabetes. 11 of them w
0 6 0 10 20 30 40 50 60 70 80 90
Less than 1 yr
[image:82.612.132.480.206.476.2]SCH & DURATION RANGE
Table -10
SCHIRMER TEST AND DURATION OF DIABETES Less than
1 yr 1 to 5 yrs
6 to 10 yrs
11 to 20 yrs
0 10 22 11
6 82 16 3
P value of above comparison was significant. Among 43 schirmer test positive nts had 1 to 5 years of diabetes. 22 of them were 6 to 10 of diabetes. 11 of them were 10 to 20 years of diabetes.
10 22 11 82 16 3
1 to 5 yrs 6 to 10 yrs 11 to 20 yrs
SCH & DURATION RANGE
Positive negative
SCHIRMER TEST AND DURATION OF DIABETES 11 to 20
UREA LEVEL AND SCHIRMER TEST
Among23 patients Schirmer test positive,14 patients had urea level more
29 0 20 40 60 80 100 120 Upto 40
SCH & UREA RANGE
[image:83.612.97.514.270.616.2]Schirmer test Positive Negative
Table -11
UREA LEVEL AND SCHIRMER TEST
Among23 patients Schirmer test positive,14 patients had urea level more than 40 mg/dl.
14 98
9
Above 40
SCH & UREA RANGE
Negative Positive
Schirmer test Upto 40 Above 40 Positive 29 14
Negative 98 9
TEAR FILM BREAKUP TIME
TBUT Positive Negative
Total
The p value of the above chart is < 0.01.
patients,only 29 of them are Schirmer test positive
0.0 10.0 20.0 30.0 40.0 50.0 60.0 70.0 80.0
[image:84.612.162.478.215.538.2]Tear film break up time
Table -12
TEAR FILM BREAKUP TIME
TBUT Frequency Percent Positive 36 24.0 Negative 114 76.0 Total 150 100.0
The p value of the above chart is < 0.01. Among 53 dry eye symptom positive patients,only 29 of them are Schirmer test positive
Positive Negative
Tear film break up time
UREA RANGE AND TBUT
TBUT UREA Upto 40 positive
negative
P value of the above correlation was significant. 36 of them TBUT test positive. Among 36 patients 23 of them urea level less than 40 mg/dl and 13 of them had urea level more than 40 mg/dl.
23 0 20 40 60 80 100 120 Upto 40
[image:85.612.133.481.296.526.2]TBUT & UREA RANGE
Table -13
UREA RANGE AND TBUT
UREA Upto 40 UREA Above 40
23 13
104 10
above correlation was significant. 36 of them TBUT test positive. Among 36 patients 23 of them urea level less than 40 mg/dl and 13 of them had urea level more than 40 mg/dl.
13 104
10
Upto 40 Above 40
TBUT & UREA RANGE
positive negative
TBUT AND DURATION OF DIABETES
P value of the test was significant. Among 36 TBUT test positive patients, 5 of them were in 1 to 5 years duration of diabetes,20 of
10 years duration and 11 of them were in 11 to 20 years duration of diabetes 0 6 0 20 40 60 80 100
Less than 1 yr
TBUT & DURATION RANGE
[image:86.612.127.484.254.495.2]Duration Less than 1 yr positive 0 negative 6
Table -14
TBUT AND DURATION OF DIABETES
P value of the test was significant. Among 36 TBUT test positive patients, 5 of them were in 1 to 5 years duration of diabetes,20 of the were in 6 to 10 years duration and 11 of them were in 11 to 20 years duration of
5 20 11 87 18 3
1 to 5 yrs 6 to 10 yrs 11 to 20 yrs
TBUT & DURATION RANGE
positive negative
Less than 1 yr 1 to 5 yrs 6 to 10 yrs 11 to 20 yrs
5 20 11
87 18 3
P value of the test was significant. Among 36 TBUT test positive patients, the were in 6 to 10 years duration and 11 of them were in 11 to 20 years duration of
11 to 20 yrs 11
TBUT WITH DRY EYE
TBUT
positive negative
The p value of the above chart is < 0.01.
symptomatic patients. 28 of them Schirmer test negative.
0 10 20 30 40 50 60 70 80 90 Asymptomatic Patients
[image:87.612.119.494.338.639.2]Tear flim break up time with Dry Eye
Table -15
TBUT WITH DRY EYE SYMPTOMS
Asymptomatic patients
Symptomatic patients
11 25
86 28
above chart is < 0.01. Only25 of them were TBUT positive symptomatic patients. 28 of them Schirmer test negative.
Asymptomatic Patients Symptomatic Patients
Tear flim break up time with Dry Eye
symptoms
TBUT Negative TBUT Positive
FBS RANGE AND DRY EYE
FBS Upto 110 Above 110
The p value of the above chart is 0.178, not significant
In symptomatic patients only 10 of them had FBS less than 110 mg/dl. 43 of them had FBS more than 110 mg/dl
0 10 20 30 40 50 60 70 Asymptomatic Patients
FBS with Dry Eye symptoms
[image:88.612.99.489.301.540.2]FBS upto 110
Table -16
FBS RANGE AND DRY EYE SYMPTOMS
Asymptomatic patients
Symptomatic patients
28 10
69 43
value of the above chart is 0.178, not significant.
In symptomatic patients only 10 of them had FBS less than 110 mg/dl. 43 of them had FBS more than 110 mg/dl
Asymptomatic Patients Symptomatic Patients
FBS with Dry Eye symptoms
FBS upto 110 FBS above 110
PPBS
Upto 160 Above 160
The p value of the above chart is < 0.05.
47 patients had PPBS more than 160 mg/dl and also had dry eye ssymptoms. Only 6 symptomatic patients had PPBS less than 160 mg/dl
0 10 20 30 40 50 60 70 Asymptomatic Patients
[image:89.612.136.477.136.527.2]PPBS with Dry Eye symptoms
Table -17
PPBS AND DRY EYE
Asymptomatic patients
Symptomatic patients
31 6
66 47
The p value of the above chart is < 0.05.
47 patients had PPBS more than 160 mg/dl and also had dry eye . Only 6 symptomatic patients had PPBS less than 160 mg/dl
Asymptomatic Patients Symptomatic Patients
PPBS with Dry Eye symptoms
PPBS upto 160 PPBS above 160
UREA
Urea
Upto 40 Above 40
The p value of the above chart is
symptom positive patients 42 of them had urea level less than 40 mg/dl
0 20 40 60 80 100
[image:90.612.138.479.143.524.2]Asymptomatic Patients
Table -18
UREA RANGE AND DRY EYE
Asymptomatic patients
Symptomatic patients
85 42
12 11
The p value of the above chart is 0.173, not significant. Among 53 dry eye symptom positive patients 42 of them had urea level less than 40 mg/dl
Asymptomatic Patients Symptomatic Patients
Urea with Dry Eye symptoms
Urea upto 40 Urea above 40
CREATININE RANGE AND DRY EYE
Creatinine
Upto 1
Above 1
The p value of the above chart is 0.106, not significant.
Among 53 dry eye symptomatic patients, 44 of them had normal Creatinine level, only 9 of them had more than 1mg/dl of creatinine
0 20 40 60 80 100 Asymptomatic Patients
Creatinine with Dry Eye symptoms
[image:91.612.134.478.152.500.2]Creatinine upto 1
Table -19
CREATININE RANGE AND DRY EYE
Creatinine
A symptomatic patients
Symptomatic patients
89 44
8 9
The p value of the above chart is 0.106, not significant.
Among 53 dry eye symptomatic patients, 44 of them had normal level, only 9 of them had more than 1mg/dl of creatinine
Asymptomatic Patients Symptomatic Patients
Creatinine with Dry Eye symptoms
Creatinine upto 1 Creatinine above 1
Among 53 dry eye symptomatic patients, 44 of them had normal level, only 9 of them had more than 1mg/dl of creatinine
DURATION RANGE AND DRY EYE
Duration
Less than 1 yr 1 to 5 yrs 6 to 10 yrs 11 to 20 yrs
The p value of the above chart is < 0.01. Highly significant.
symptom positive patients.2 of them in less than 1 year duration.16 of them in 1 to 5 years duration.28 of them in 5 to 10 years duration,7 of them in 10 to 20 years duration.
0 20 40 60 80
Less than 1 yr
Duration of Disease with Dry Eye
[image:92.612.138.478.77.564.2]Asymptomatic Patients
Table -20
DURATION RANGE AND DRY EYE Asymptomatic
patients
Symptomatic patients
Less than 1 yr 4 2
76 16
10 28
7 7
above chart is < 0.01. Highly significant.Among 53 dry eye symptom positive patients.2 of them in less than 1 year duration.16 of them
28 of them in 5 to 10 years duration,7 of them in 10
1 to 5 yrs 6 to 10 yrs 11 to 20 yrs
Duration of Disease with Dry Eye
symptoms
Asymptomatic Patients Symptomatic Patients
DURATION RANGE AND DR
Duration NF
Less than 1 yr 5 1 to 5 yrs 71 6 to 10 yrs 3 11 to 20 yrs 0
The p value of the above chart is significant.
duration. Among 92 patients,71 of them had normal fundus, 14 of them mild NPDR and 7 of them had moderate NPDR
0 20 40 60 80 NF
Less than 1 yr
Table -21
DURATION RANGE AND DR
MILD NPDR
MODERATE NPDR
SEVERE
NPDR PDR
1 0 0
14 7 0
6 15 6
1 2 5
The p value of the above chart is significant.92 patients were in 1 to 5 years duration. Among 92 patients,71 of them had normal fundus, 14 of them mild NPDR and 7 of them had moderate NPDR.
MILD MODERATE SEVERE PDR
Duration with DR
1 to 5 yrs 6 to 10 yrs 11 to 20 yrs
PDR 0 0 8 6
UREA RANGE AND DIABETIC RETINOPATHY
Urea NF
Upto 40 77
Above 40 2
The p value of the above chart is <0.01, significant.
urea more than 40 mg/dl. Among 18 patients 8 patients had PDR.
0 20 40 60 80 NF MILD
Urea upto 40
Table -22
UREA RANGE AND DIABETIC RETINOPATHY
MILD NPDR MODERATE NPDR SEVERE NPDR PDR
21 17 6
1 7 5
The p value of the above chart is <0.01, significant. 18 patients had urea more than 40 mg/dl. Among 18 patients 8 patients had PDR.
MILD MODERATE SEVERE PDR
Urea range with DR
Urea upto 40 Urea above 40
PDR
6
8
CREATININE RANGE AND DR
Creatinine NF
Upto 1 78
Above 1 1
The p value of the above chart is <0.01, significant.
level > 1 mg/dl. Among 17 patients 8 patients had PDR
0 10 20 30 40 50 60 70 80 NF MILD
Creatinine range with DR
Creatinine upto 1
Table -23
CREATININE RANGE AND DR
MILD NPDR MODERATE NPDR SEVERE NPDR PDR
22 22 5
0 2 6
The p value of the above chart is <0.01, significant.17 patients had Creatinine level > 1 mg/dl. Among 17 patients 8 patients had PDR
MILD MODERATE SEVERE PDR
Creatinine range with DR
Creatinine upto 1 Creatinine above 1
PDR
6
8
SCHIRMERS AND DR
Schirmer NF Positive 3
Negative 76
The p value of the above chart is <0.01, significant. test positive. Among 43 patients
of them moderate NPDR, 7 of them severe NPDR, 11 of them had PDR
0 20 40 60 80 NF MILD
Schirmer test with DR
[image:96.612.103.512.175.532.2]Schirmer test Positive
Table -24
SCHIRMERS AND DR
MILD MODERATE SEVERE PDR
8 14 7
14 10 4
The p value of the above chart is <0.01, significant.43 patients are Schirmer test positive. Among 43 patients 3 of them NF, 8 of them mild NPDR, 14
NPDR, 7 of them severe NPDR, 11 of them had PDR
MILD MODERATE SEVERE PDR
Schirmer test with DR
Schirmer test Positive Schirmer test Negative
PDR 11
3
TBUT NF Positive 0 Negative 79
The p value of the above chart is <0.01, significant.
positive. Among 36 patients 4 patients had mild NPDR, 12 patients had moderate NPDR, 7 patients had severe NPDR and 13 of them had PDR.
[image:97.612.100.511.274.487.2]0 20 40 60 80 NF MILD TBUT Positive Table -25 TBUT AND DR
MILD MODERATE SEVERE
4 12 7
18 12 4
The p value of the above chart is <0.01, significant.36 patients were TBUT Among 36 patients 4 patients had mild NPDR, 12 patients had moderate NPDR, 7 patients had severe NPDR and 13 of them had PDR.
MILD MODERATE SEVERE PDR
TBUT with DR
TBUT Positive TBUT Negative
PDR 13
1
FBS RANGE WITH DR
FBS NF
Upto 110 29 Above 110 50
The p value of the above chart is <0.01, significant.
more than 110 mg/dl. Among 112 patients 50 of them had normal fundus , 19 of them had mild NPDR, 20 of them had moderate NPDR, 11 of them had severe NPDR and 12 0f them had PDR
0 10 20 30 40 50 NF MILD
[image:98.612.104.508.149.518.2]FBS upto 110
Table -26
FBS RANGE WITH DR
MILD NPDR MODERATE NPDR SEVERE NPDR PDR
3 4 0
19 20 11
The p value of the above chart is <0.01, significant.112 patients had FBS more than 110 mg/dl. Among 112 patients 50 of them had normal fundus , 19 of them had mild NPDR, 20 of them had moderate NPDR, 11 of them had severe NPDR and 12 0f them had PDR
MILD MODERATE SEVERE PDR
FBS range with DR
FBS upto 110 FBS above 110