University of Southern Queensland
Faculty of Engineering and Surveying
The Effect of DC Current on Power
Transformers
A dissertation submitted by
Ashley Karl Zeimer
in fulfilment of the requirements of Courses ENG4111 and 4112 Research Project
towards the degree of
Abstract
Power transformers are an integral part of almost all electrical transmission and distribution networks. Their reliable service is of the utmost importance in modern society which is dependent on a constant electricity supply. There are a range of factors that can hinder the operation of a power transformer. This dissertation presents the results of investigations into one of these factors through an analysis of the effect that direct current has on the operational characteristics of a power transformer.
There are a host of adverse effects that can accompany the presence of a direct current in a transformer’s windings. The predominant effect that is witnessed is half cycle saturation. This leads to increased harmonic distortion, increased reactive power losses, overheating and elevated acoustic noise emissions.
University of Southern Queensland
Faculty of Engineering and Surveying
ENG4111 & ENG4112
Research Project
Limitations of Use
The Council of the University of Southern Queensland, its Faculty of Engineering and Surveying, and the staff of the University of Southern Queensland, do not accept any responsibility for the truth, accuracy or completeness of material contained within or associated with this dissertation.
Persons using all or any part of this material do so at their own risk, and not at the risk of the Council of the University of Southern Queensland, its Faculty of Engineering and Surveying or the staff of the University of Southern Queensland.
This dissertation reports an educational exercise and has no purpose or validity beyond this exercise. The sole purpose of the course pair entitled ‘Research Project’ is to contribute to the overall education within the student’s chosen degree program. This document, the associated hardware, software, drawings, and other material set out in the associated appendices should not be used for any other purpose: if they are so used, it is entirely at the risk of the user.
Prof G Baker Dean
Certification
I certify that the ideas, designs and experimental work, results, analyses and conclusions set out in this dissertation are entirely my own effort, except where otherwise indicated and acknowledged.
I further certify that the work is original and has not been previously submitted for assessment in any other course or institution, except where specifically stated.
Ashley Karl Zeimer
Student Number: 0019922370
Acknowledgements
I would like to thank the following people for their invaluable assistance and contributions which have aided the success of this project:
Mr. Ron Sharma (Supervisor) whose willing assistance and wealth of information could be relied upon throughout the entire project process.
Dr. Anthony Ahfock whose technical guidance was essential to the success of this project.
Contents
Abstract i
Acknowledgements iv
List of Figures xi
List of Tables xvii
Chapter 1 Introduction 1
1.1 Project Objectives……….. 2
1.2 Dissertation Layout……… 3
Chapter 2 Transformer Theory Background 5
2.1 Basic Operation……….. 5
2.2 Core Saturation………..……… 10
2.3 Hysteresis………... 10
Chapter 3 Transformer Operation with DC Bias 12 3.1 Theory of Affect... 12
3.2 Specific Affects...15
3.2.1 Saturation and Generation of Harmonics...15
3.2.2 Power Considerations... 16
3.2.3 Overheating... 16
3.2.4 Acoustic Noise Emissions...17
3.2.5 Corrosive Effects... 18
3.2.6 Residual Magnetism...18
3.2.7 External Considerations... 18
3.3 Sources of DC Bias... 18
3.3.1 Geomagnetically Induced Currents...19
3.3.2 Photovoltaic Systems... 19
3.3.3 AC and DC Drives... 20
3.4 Mitigation of the Effects of DC Injection... 20
3.4.1 Transformer Related Measures... 21
3.4.2 Equipment Related Measures... 22
Chapter 4 Methodology 23
4.2 Outline of Chapter Purpose and Methodology... 24
4.2.1 Chapter 5 – Sources of DC Bias... 24
4.2.2 Chapter 6 – Single Phase Analysis – Magnetising Characteristics... 25
4.2.3 Chapter 7 – Single Phase Analysis – Harmonic Characteristics... 26
4.2.4 Chapter 8 – Single Phase Analysis – Hysteresis Characteristics... 27
4.2.5 Chapter 9 – Three Phase Analysis – Magnetising Characteristics...27
Chapter 5 Sources of Direct Current 29
5.1 Overview... 29
5.2 Computers... 29
5.2.1 Test Theory and Method... 30
5.2.2 Test Results and Analysis... 30
5.3 AC and DC Drives... 32
5.3.1 Test Theory and Method... 32
5.3.2 Test Results and Analysis... 33
Chapter 6 Single Phase Analysis – Magnetising Characteristics 35 6.1 Zero AC Load Test... 35
6.1.2 Test Results and Analysis... 37
6.2 Magnetising Characteristics at Rated Load... 43
6.2.1 Test Theory and Method... 44
6.2.2 Test Results and Analysis... 45
Chapter 7 Single Phase Analysis – Harmonic Effects 49 7.1 Primary and Secondary Harmonic Distortion... 49
7.2 Harmonic Analysis – Half-Wave Rectified DC... 52
7.2.1 Test Theory and Method... 52
7.2.2 Test Results and Analysis... 53
7.3 Harmonic Analysis – Smoothed Half-Wave Rectified DC... 57
7.3.1 Test Theory and Method... 57
7.3.2 Test Results and Analysis... 58
Chapter 8 Flux and Magnetising Current Prediction 62 8.1 Theory Overview... 62
8.2 Practical Hysteresis Measurements... 65
8.2.1 Test Theory and Method... 65
8.2.2 Test Results and Analysis... 67
8.3 Software Simulation of Magnetising Characteristics... 70
8.3.1 Program Methodology, Assumptions and Limitations... 70
Chapter 9 Three Phase Analysis 77
9.1 Magnetising Characteristics – Phase to Neutral DC Injection... 78
9.1.1 Test Theory and Method... 78
9.1.2 Test Results and Analysis... 79
9.2 Magnetising Characteristics – Phase to Phase DC Injection... 82
9.2.1 Test Theory and Method... 82
9.2.2 Test Results and Analysis... 83
Chapter 10 Conclusions and Recommendations for Future Work 85
10.1 Achievement of Objectives... 85
10.2 Future Work... 87
10.2.1 Sources of DC... 87
10.2.2 Single Phase Analysis... 88
10.2.3 Three Phase Analysis... 89
References 91
Appendix A Project Specification 95
Appendix B Single Phase Analysis – Magnetising Characteristic Results 97
Appendix D Experimental Hysteresis Results 116
Appendix E MATLAB CODE –Magnetising_Current_Prediction.m 120
List of Figures
2.1 Two Winding, Core-Type Single Phase Transformer, Open Circuit
Secondary ... 6
2.2 Two Winding, Core-Type Single-Phase Transformer-Loaded Secondary... 8
2.3 Transformer Equivalent Circuit... 9
2.4 Simplified Equivalent Circuit Referred to the Primary... 10
2.5 The Hysteresis Loop... 11
3.1 Single Phase Transformer Operating Under Asymmetrical Load Current Conditions ... 12
3.2 Transformer Equivalent Circuit Showing Secondary DC Current Path... 13
3.3 Flux Waveform Offset Resulting from Biased Current Waveform... 14
3.4 (a) Horizontal Cross-Section for an Asymmetric Transformer... 21
6.2 Plot of Core Loss Current and Magnetising Current Against a
Secondary DC Bias... 38
6.3 Variation in Real, Reactive and Apparent Power with a Secondary DC Bias... 40
6.4 Variation in Displacement Power Factor with DC Bias... 40
6.5 Flux Paths Established due to the Secondary DC and Magnetising Current... 41
6.6 (a) No-Load Current Waveform for Zero DC Injection... 42
6.6 (b) No-Load Current Waveform for 80 mA DC Injection... 42
6.7 Circuit Used to Determine Transformer Magnetising Characteristics at Rated Load... 44
6.8 Plot of Core Loss Current and Magnetising Current against DC Bias... 46
6.9 Variation in Real, Reactive and Apparent Power with a Secondary DC Bias... 46
6.10 Variation in Displacement Power Factor with a Secondary DC Bias... 47
7.1 Circuit Configuration for DC Injection via Half-Wave Rectifier... 52
7.2 CRO Screen Shot of Half-Wave Rectified Direct Current... 53
7.3 Secondary Current Harmonic Distortion with a Secondary DC Current... 54
7.4 Secondary Voltage Harmonic Distortion with a Secondary DC Current... 55
7.6 Primary Voltage Harmonic Distortion with a Secondary DC Current... 56
7.7 Circuit Configuration for Capacitor Smoothed DC Injection via Half-Wave Rectifier... 57
7.8 CRO Screen Shot of Smoothed Rectified DC Current... 58
7.9 (a) Secondary Voltage Waveform for Zero DC Secondary Component ... 61
7.9 (b) Secondary Voltage Waveform for 300 mA DC Secondary Component... 61
8.1 Transformer Flux-Magnetising Current Hysteresis Characteristic... 63
8.2 Circuit Utilised to Conduct Hysteresis Experiment... 66
8.3 Hysteresis Characteristic with 240 V Supply and Open Circuit Secondary... 67
8.4 Hysteresis Characteristic with 270 V Supply and Open Circuit Secondary... 68
8.5 Hysteresis Characteristic with a 100 mA Secondary DC Component... 69
8.6 Hysteresis Plot with Piecewise Linearly Approximated Mid Point Locus... 71
8.7 Plot of Flux-Magnetising Current Relationship with Zero Flux Bias... 73
8.8 Plot of Biased Magnetising Current with Zero Flux Bias... 73
8.9 Plot of Primary Magnetising Current with Zero Flux Bias... 74
8.10 Plot of Flux-Magnetising Current Relationship with 20% Flux Bias... 75
8.11 Plot of Biased Magnetising Current with 20% Flux Bias... 75
9.1 Secondary Phase to Neutral DC Injection... 78 9.2 Plot of Primary Phase Currents with ‘A’ Phase to Neutral
DC Injection... 79 9.3 Plot of Primary Phase Currents with ‘B’ Phase to Neutral
DC Injection... 80 9.4 Plot of Primary Phase Currents with ‘C’ Phase to Neutral
DC Injection... 80 9.5 ‘A’ Phase Primary Current Waveform with Zero Secondary
DC Injection... 81 9.6 ‘A’ Phase Primary Current Waveform with 200 mA Secondary
DC Injection... 81 9.7 Secondary Phase to Phase DC Injection... 82 9.8 Plot of Primary Phase Currents with ‘A’ Phase to ‘B’ Phase
DC Injection... 83 9.9 Plot of Primary Phase Currents with ‘C’ Phase to ‘B’ Phase
DC Injection... 84 9.10 Plot of Primary Phase Currents with ‘C’ Phase to ‘A’ Phase
DC Injection... 84
B.1 Primary Current Waveform with Zero AC Load and Zero
Secondary DC Current... 100 B.2 Primary Current Waveform with Zero AC Load and 10 mA
B.3 Primary Current Waveform with Zero AC Load and 20 mA
Secondary DC Current... 101 B.4 Primary Current Waveform with Zero AC Load and 30 mA
Secondary DC Current... 101 B.5 Primary Current Waveform with Zero AC Load and 40 mA
Secondary DC Current... 102 B.6 Primary Current Waveform with Zero AC Load and 50 mA
Secondary DC Current... 102 B.7 Primary Current Waveform with Zero AC Load and 60 mA
Secondary DC Current... 103 B.8 Primary Current Waveform with Zero AC Load and 70 mA
Secondary DC Current... 103 B.9 Primary Current Waveform with Zero AC Load and 80 mA
Secondary DC Current... 104 B.10 Primary Current Waveform with Zero AC Load and 90 mA
Secondary DC Current... 104 B.11 Primary Current Waveform with Zero AC Load and 100 mA
Secondary DC Current... 105 B.12 Primary Current Waveform with Zero AC Load and 200 mA
Secondary DC Current... 105 B.13 Primary Current Waveform with Zero AC Load and 300 mA
C.1 Variation in Primary Voltage Harmonic Distortion for
Secondary Smoothed Half-Wave Rectified Current... 112 C.2 Variation in Primary Current Harmonic Distortion for
Secondary Smoothed Half-Wave Rectified Current... 113 C.3 Variation in Secondary Voltage Harmonic Distortion for
Secondary Smoothed Half-Wave Rectified Current... 114 C.4 Variation in Secondary Current Harmonic Distortion for
Secondary Smoothed Half-Wave Rectified Current... 115
D.1 Hysteresis Characteristic with 240 V Supply and Open Circuit
Secondary... 117 D.2 Hysteresis Characteristic with 270 V Supply and Open Circuit
Secondary... 117 D.3 Hysteresis Characteristic with 240 V Supply and 25 mA Secondary
DC Component... 118 D.4 Hysteresis Characteristic with 240 V Supply and 50 mA
Secondary DC Component... 118 D.5 Hysteresis Characteristic with 240 V Supply and 75 mA
Secondary DC Component... 119 D.6 Hysteresis Characteristic with 240 V Supply and 100 mA
List of Tables
5.1 Results for Measurement of DC Load Current Component for
Computers... 31 5.2 Results for Measurement of DC Load Current Component for
AC Drives... 33 5.3 Results for Measurement of DC Load Current Component for
DC Drives... 33
7.1 Current Distortion Limits for General Distribution Limits as
Defined by Standard IEEE 519 – 1992... 50 7.2 Low-Voltage System Classification and Distortion Limits as
Defined by Standard IEEE 519 – 1992... 51
B.1 Results of Zero AC Load DC Injection Tests... 98 B.2 Results of Rated AC Load DC Injection Tests... 99
C.1 Primary Side Harmonic Effects with Half-Wave Rectified
C.2 Secondary Side Harmonic Effects with Half-Wave Rectified
Secondary DC Component... 109
C.3 Primary Side Harmonic Effects with Smoothed Half-Wave Rectified Secondary DC Component... 110
C.4 Secondary Side Harmonic Effects with Smoothed Half-Wave Rectified Secondary DC Component... 111
F.1 Results of ‘A’ Phase to Neutral DC Injection... 125
F.2 Results of ‘B’ Phase to Neutral DC Injection... 126
F.3 Results of ‘C’ Phase to Neutral DC Injection... 127
F.4 Results of DC Injection between ‘A’ and ‘B’ Phases... 128
F.5 Results of DC Injection between ‘C’ and ‘B’ Phases... 129
Chapter 1
Introduction
Power transformers are an integral part of almost all electrical transmission and distribution networks. Their reliable service is of the utmost importance in modern society which is dependent on a constant electricity supply. There are a range of factors that can hinder the operation of a power transformer. This project aims to investigate one of these factors through an analysis of the effect that direct current has on the operational characteristics of a power transformer.
Direct current can be found in a transformer’s windings as a result of imperfections in connected equipment and also due to magnetic disturbances of the earth’s field. There are a host of adverse effects that can potentially accompany the presence of a direct current in a transformer’s windings. These include increased harmonic distortion, increased reactive power losses, overheating, elevated acoustic noise emissions and corrosion.
1.1 Project Objectives
Provided in the following list is an outline of the project objectives which are primarily as defined by the project specifications. It should be noted that a number of additions have been made to these objectives to cater for broadening of the project scope which occurred midway through the research process.
1. Research existing theory pertaining to the affect of DC current on power transformers as well as review transformer theory.
2. Investigate saturation with respect to transformers and detail how DC injection induces this phenomenon.
3. Analyse the variation in transformer magnetising characteristics which occurs as a result of biased load currents.
4. Determine the harmonic distortion that can be attributed to the presence of asymmetrical currents in a transformer’s secondary winding.
5. Explore potential sources of DC biasing and look into the severity of these sources.
6. Examine factors that exacerbate and potentially accelerate the adverse affects of DC injection.
7. Investigate the variation in affect due to DC biasing across the variety of transformer construction styles that exist and conduct tests to simulate this. 8. Examine variation in affects for DC injection common across all three phases
and localized to one or two of the three phases.
9. Research methods for the alleviation or elimination of the adverse effects of DC biasing.
10. Investigate the creation of software that could model this phenomenon.
1.2 Dissertation Layout
In compiling the research material for this project the objectives as defined in section 1.1 served as the primary source of direction. The following chapters are arranged such that each objective is addressed in a logical format. This section provides a brief overview of the content covered by each chapter and how this content strives to fulfil the project goals.
Provided in Chapter 2 is a brief overview of what a transformer is and how it is intended to operate in the ideal sense. Chapter 3 presents a summary of literature pertaining to the affect that direct current has on power transformers. This includes details of how a transformer’s operational characteristics are altered through the presence of a DC bias. Also, an outline is provided of potential sources of DC and methods that can be employed to mitigate the adverse effects of direct current. Chapters 2 and 3 address each of the first five objectives and also the 9th objective.
Chapter 4 details the methodology employed throughout this project. This includes what each chapter aims to achieve and why these goals are important and necessary. It provides a description of how the goals will be met and in some instances a prediction of what results are expected.
Chapter 5 looks into sources of direct current bias, a requirement of objective 5. This is achieved through investigating two potential sources in the form of computers and AC and DC motor drives. Computers are prevalent in domestic and commercial installations whilst motor drives primarily exist in industrial applications. This chapter aims to asses the significance of any potential contribution.
Chapter 7 provides the results of tests undertaken to determine harmonic distortion characteristics when a secondary direct current component is introduced into a transformer operating at rated load. The level of distortion witnessed is compared to relevant standards to determine whether it is within limit. This series of testing is in accordance with objective 4.
Presented in Chapter 8 is a comprehensive analysis of hysteresis characteristics in a single phase transformer. Included in this chapter is a software simulation that can be utilised to predict magnetising currents for a transformer exhibiting biased core flux behaviour. This addresses the objectives 2, 3, 6 and 10.
Chapter 9 presents the results of preliminary tests conducted to determine the magnetising characteristics of a three phase transformer exposed to load bias. The content contained in this chapter fulfils the 5th and 6th specifications. Chapter 10
Chapter 2
Transformer Theory Background
2.1 Basic Operation
The transformer is a static machine that utilises the principle of electromagnetic mutual induction to alter voltage and current levels in an AC circuit without affecting frequency. It is comprised of two or more coils situated in such a manner that they will be linked by the same magnetic flux when an alternating supply is connected to one of the coils. Often these coils are referred to as the primary and secondary windings. Several coils may be connected in series or parallel to form a winding.
Figure 2.1: Two Winding, Core-Type Single Phase Transformer, Open Circuit Secondary
Figure 2.1 illustrates the ideal transformer condition. That is the core is considered to have infinite permeability which in turn results in zero leakage flux. If this assumption is upheld and core losses and winding resistance are considered negligible, then it can be seen that the terminal voltages VP and VS will be equal to the voltages EP and ES which are induced by the changing flux. Then, through application of Faraday’s Law (Grainger & Stevenson 1994) the following relationships are found to exist:
dt d N E
VP = P = P φ (2.1)
dt d N E
VS = S = S φ ` (2.2)
P
N and NS represent the number of turns on the primary and secondary coils whilst
φ represents the instantaneous value of flux. If a sinusoidal supply is assumed then the flux will also vary in a sinusoidal manner. Division of the two equations above will yield the following ratios:
S P S P S P N N E E V
V = =
2.1.1 No-Load Operation
The transformer shown in Figure 2.1 is operating under no-load conditions. In this state, a small current defined as the no-load current (IO) flows. This current is comprised of two components and is represented by Equation 2.4 as follows:
c m o I I
I = + (2.4)
When operating under no-load conditions current Iolags the supply voltage by an angleΦo. Component Im lags VP by 90° and represents the magnetisation current
that creates the magnetic field within the iron core. Component Icis in phase with
P
V and represents the hysteresis and eddy current losses (Jenneson 1999). The two no-load components can be represented as follows:
o o
m I sin
I = Φ (2.5)
o o
c I cos
I = Φ (2.6)
2.1.2 Loaded Operation
When a load is applied to the secondary of a transformer a secondary current (IS) will flow. This is shown in Figure 2.2. As a result of Is the secondary winding will
Figure 2.2: Two Winding, Core-Type Single-Phase Transformer-Loaded Secondary
Assuming ideal conditions with a symmetric load current, the ratio of primary current to secondary current is inversely proportional to the corresponding voltage and turns ratios. This relationship is shown in Equation 2.7.
P S S P S P I I N N V V = = (2.7)
Transformer impedances can be referred to either the primary or the secondary. The supply side impedance is:
P P in
I V
Z = (2.8)
The load side impedance is:
S S L
I V
Z = (2.9)
It can then be seen that the supply side impedance is related to the load side impedance in terms of the turn’s ratio (a =
S P N N
L in a Z
Z = 2 (2.10)
The transformer configuration depicted in Figure 2.2 can be represented by an equivalent circuit as shown in Figure 2.3. This equivalent circuit includes the ideal transformer. In the diagram below RPand XP represent the resistance and reactance of the primary winding while RSand XS represent the resistance and reactance of the secondary winding.
Figure 2.3: Transformer Equivalent Circuit
Further simplification can be achieved through referring impedances to the primary or secondary and collecting like terms. Figure 2.4 illustrates this with the impedances referred to the primary side. In this circuit the effect of the shunt impedance has been neglected and the resistance and reactance have been represented as follows:
S P
ep R a R
R = + 2 (2.11)
S P
ep X a X
X = + 2 (2.12)
The primary current is:
a I I
I S
S '
Figure 2.4: Simplified Equivalent Circuit Referred to the Primary
2.2 Core Saturation
Core saturation is one of the primary factors limiting the performance of a transformer. The transformer core cannot support an infinite magnetic flux density and exhibits the tendency of saturation at a certain level of magnetomotive force. Increases in magnetomotive force beyond this level do not yield a proportional increase in magnetic field flux. The level at which a transformer will enter saturation is generally dependent upon the material that has been utilised in the core as well as core construction and dimensions. Some potential causes of core saturation are over voltage on the primary winding, operation below rated frequency and/or an offset load current (Kuphaldt 2003).
2.3 Hysteresis
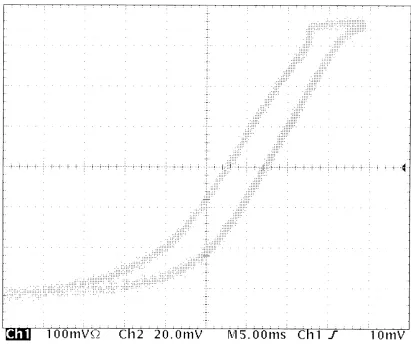
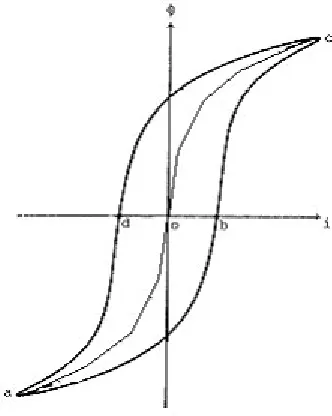
alternating magnetic field is applied to a magnetic material such as a transformer core then the magnetisation will trace out a path known as the hysteresis loop. This phenomenon is illustrated in Figure 2.5 (Nave 2000).
Figure 2.5: The Hysteresis Loop (Nave 2000)
Chapter 3
Transformer Operation with DC Bias
3.1 Theory of Effect
When a transformer supplies a secondary current containing a DC component, a unipolar flux is established in the core. This flux accompanies the bipolar flux that is created as a result of the alternating component of current. This is illustrated below in Figure 3.1. The direction of this DC flux is dependent on the sign of the DC offset.
Figure 3.1: Single Phase Transformer Operating Under Asymmetrical Load Current Conditions
current. Hence the mutual flux remains relatively unchanged. It can be shown that the flux created in the secondary as a result of the DC current component will not be reflected to the primary.
Through analysis of the equivalent circuit for a transformer shown in Figure 3.2 it can be seen that the DC current in the secondary will not be reflected to the primary as a result of the magnetising reactance. The magnetising reactance will appear as a dead short to the DC component of current due to the fact that DC has a frequency equal to zero. The inductive reactance can be modelled using Equation 3.1.
FL
XL =2Π (3.1)
With DC current F =0∴XL =0
Figure 3.2: Transformer Equivalent Circuit Showing Secondary DC Current Path
0 2 4 6 8 10 12 -400
-300 -200 -100 0 100 200 300 400
Plot of Voltage and Offset Flux Waveform
volts flux
Flux Center Line Saturation Limit
Saturation Limit
Figure 3.3: Flux Waveform Offset Resulting from Biased Current Waveform
Often the supply to a transformer can be considered as an infinite bus and thus the following relationship exists:
φ
∝
V (3.2)
Thus it can be assumed that the flux remains constant.
The relationship between flux, magnetising reactance and magnetising current can be defined as follows:
m mI
X
∝
If the transformer enters saturation as a result of the presence of DC current in the secondary then an increase in magnetising current must occur to maintain the constant flux. Hence if magnetising current increases a corresponding decrease in magnetising reactance will occur in accordance with the relationship described above. Another point that must be noted is that Equation 2.7 will not hold since the extra secondary DC component of current will not be reflected to the primary.
3.2 Specific Affects
The presence of a DC current component in the load current of a power transformer can result in a range of adverse affects. Studies conducted, have shown that there is a variation in these affects across the range of transformer construction styles (Fujiwara et al. 1994). Following is an overview of the effects, however no differentiation is made between varying construction styles.
3.2.1 Saturation and Generation of Harmonics
It has been established that one of the major effects on a transformer operating under a biased load current is the tendency towards half cycle saturation (Bolduc et al. 1997). During the saturated half cycle interval an increase in magnetising current will be experienced. This will result in a non-linear current waveform containing an assortment of odd and even harmonics (Price 2002). This is a particularly undesirable condition, one which is recognised in the standard ANSI/IEEE C57.12.00-1987, IEEE Standard General Requirements for Liquid Immersed Distribution, Power and Regulating Transformers, which states that power transformers should not be expected to carry load currents with a harmonic factor greater than 5 percent of rating (Baranowski et al. 1996).
through degradation of the power quality experienced by other equipment connected to the affected transformer.
3.2.2 Power Considerations
An effect which can also stem from core saturation is increased VAR absorption (Price 2002). This can be explained by realising that core saturation results in an increase in magnetising current which is basically an inductive current. Increases in this inductive current will result in greater reactive power loss across the magnetising reactance (Ahfock, A 2004, pers. comm., 18 August). Thus if the existing load current through the transformer is inductive rather than capacitive (which is often the case) then the overall reactive power (VAR absorption) will increase as a result of the increased magnetising current. If saturation is severe the VAR absorption will become noticeable, along with an associated decrease in displacement power factor. This is a particularly undesirable feature is it indicates increased losses.
3.2.3 Overheating
Another effect that can be attributed to biased transformer load currents is overheating. Overheating can initially be seen to be manifested in the windings of a transformer as a result of the increased harmonic distortion and the skin effect.
When a transformer enters the saturated region of operation as a result of DC bias extra harmonics are generated. These harmonics at there elevated frequency levels encounter greater resistance as a result of the skin affect. This in turn exacerbates heating affects through increased I2R losses (Sharma, R 2004, pers. comm., 25 August).
surmised that this effect occurs due to the variation in magnitude and direction of leakage flux during the half cycle saturation interval. This is said to cause an increased component of flux perpendicular to the major dimension of the winding strands (Fujiwara et al. 1994).
When a transformer enters saturation the flux is forced to seek paths exterior to the core (De La Ree, Liu & Lu 1993). This often has the affect of overheating of components within the transformer such as brackets and bolts and even the transformer tank itself (Jewell & Warner 1999). Studies have shown that the tie plate within a transformer is particularly susceptible to DC induced saturation, experiencing rapid temperature rise as a result (Bolduc et al 1997).
For oil immersed transformers DC saturation induced overheating also has the effect of increasing levels of CO and CO² gases (Fujiwara et al. 1994). Accumulation of these gases can cause operation of Buckholtz protection, thus removing the transformer from service (Cardoso et al. 1998).
3.2.4 Acoustic Noise Emissions
A transformer driven into the saturated operating region as the result of DC bias will produce greater levels of acoustical noise. Studies have shown that relatively small levels of DC voltage on a transformer’s lines can cause the device to emit greater levels of noise.
There are a number of mechanisms that produce this noise. Firstly the Lorentz Force Acoustic Signal (LFAS) causes mechanical forces between core laminations hence inducing rattling and thus noise. This particular form of noise production is largely dependent on construction style.
magnetostriction becomes large and movement is experienced within core laminations (De Leon et al. 2000).
3.2.5 Corrosive Effects
A particularly adverse impact arising from biased transformer load currents is that corrosive affects are accelerated. The injection of DC can create ground currents which can rapidly corrode equipment (Ledwich & Masoud 1999).
3.2.6 Residual Magnetism
The magnetic history of a transformer operating under asymmetric load conditions cannot be discounted. With a DC bias present transformers can exhibit residual magnetism. This is particularly evident in those which have a tank. If the gap between the tank and the transformer core is small, any residual magnetism is likely to impact significantly upon the magnetising currents and hysteresis characteristic (Fuchs, Roesler & You 1999).
3.2.7 External Considerations
The effect of asymmetric currents on power transformers will be dependent on a number of external factors. If a transformer is operating at or above rated voltage the effects of DC offset are likely to be accelerated. Ambient temperatures will govern the severity of heating effects as well as transformer loading.
3.3 Sources of DC Bias
• Geomagnetically induced currents (GIC)
• Photovoltaic (PV) systems grid connected without mains frequency transformers
• AC and DC drives
3.3.1 Geomagnetically Induced Currents
Geomagnetically induced currents flow on the surface of the earth as a result of solar magnetic disturbances (Al-Haj & El-Amin 2000). An example of such a disturbance occurred on March 13, 1989 in the form of an intense magnetic storm which impacted upon the Northern Hemisphere. This storm was attributed with the general failure of the Hydro-Quebec power system (Dutil et al. 1992). These currents can flow in power system transmission lines and transformers through entering and exiting the earthed neutrals of star connected equipment.
This form of DC bias is characterised by very low frequencies of the range 0.01-0.001 Hz and as such is often referred to as quasi DC. GIC magnitudes of the order of several hundred amperes in neutrals have been observed in Finland and Sweden. More typical values of 10-15A were reported in the National Grid Company transmission system in England and Wales (Price 2002).
3.3.2 Photovoltaic Systems
• Imbalance in on state impedances of switches
• Different switching times for switches
• Imperfection in implementing timing of drivers
It must be noted that the Australian Standard AS4777.2-2002 (Grid connection of energy systems via inverters) does impose strict limits on the level of direct current injection. The standard states that the level of DC output current of an inverter shall not exceed 0.5% of rated output current or 5 mA, whichever is greater. This however is not a worldwide standard. If a large number of inverter interfaced systems are grid connect the DC effect may be cumulative.
3.3.3 AC and DC Drives
AC and DC drives are a significant source of DC injection in industry. Studies have shown variable frequency drives to have asymmetrical input current waveforms when operated at maximum output (Swamy & Rossiter 1998). The severity of this DC injection will be dependent upon the type of conduction devices utilised (e.g. diodes and thyristors) and the quality of device matching.
With respect to DC drives there a number of drive topologies that can inject significant components of DC. The half-wave rectifier is notorious for injection of DC however it’s practical use is limited. The three phase half controlled rectifier can also be a source of DC injection (Swamy & Rossiter 1998).
3.4 Mitigation of the Effects of DC Injection
3.4.1 Transformer Related Measures
From a transformer construction viewpoint there are a range of measures that can be implemented. At the initial design phase allowance can be built into core parameters to cater for any DC injection. Where it is known that a load is likely to contain a large DC component, use of a Zig-Zag transformer may be advantageous. The main benefit of the zigzag connection is that the currents in the two halves of the windings on each leg of the transformer flow in opposite directions. Thus any DC component is cancelled. The drawback of this method is that it is generally more expensive to construct (Sankaran 2000).
Another method that has been proposed to negate the effects of DC bias is to utilize a symmetric transformer construction style. Shown below in Figures 3.4 (a) and (b) are the horizontal cross sections of the asymmetric and symmetric models.
(a) (b)
Figure 3.4: (a) Horizontal Section for an Asymmetric Transformer; (b) Horizontal Cross-Section for a Symmetric Transformer (Fuchs, Roesler & You 1999)
GIC currents find their way into power systems by way of the directly earthed neutrals of certain three phase equipment. A method proposed to eliminate the effects of this form of DC bias is the installation of a Neutral Blocking Device (NBD). An NBD (usually a capacitor) is inserted between the earth point and the neutral star point of the effected equipment. The capacitor does not allow the path of DC current thus negating the effects of GIC currents (Dutil et al. 1992).
The residual magnetism of a transformer’s core and tank can impact significantly upon magnetising current characteristics (Fuchs, Roesler & You 1999). Certain studies have shown that non-magnetic steel plate utilised in transformer construction does not experience significant temperature rise as a result of DC bias (Bolduc et al 1997). Hence use of non-magnetic materials during transformer construction can be beneficial in not only reducing residual magnetism but also in alleviating heating effects.
3.4.2 Equipment Related Measures
The most successful measure that can be implemented to combat the adverse effects of DC injection from an equipment perspective is the creation of standards to govern the allowable level of DC injection. There has been some progress along this path with standards such as the Australian Standard AS4777.2-2002 (Grid connection of energy systems via inverters) stipulating maximum levels of DC injection (Khouzam 1999). This standard states that the level of DC output current of an inverter shall not exceed 0.5% of rated output current or 5 mA, whichever is greater. Also the IEEE 519 standard proposes limits for voltage and current harmonic distortion as will be seen in Chapter 7.
Chapter 4
Methodology
4.1 Overview
Chapter 2 presented a brief overview of transformer operation based on ideal conditions. Chapter 3 provides the results of a literature review which outlines the theoretical variation in transformer operation when exposed to a biased secondary current. The ideal model for a transformer is shown to be invalidated through the presence of a secondary bias current. Specific adverse effects are presented and potential sources of DC bias are established. Methods for the mitigation of the adverse effects of offset transformer load currents are also explored.
4.2 Outline of Chapter Purpose and Methodology
This section provides an overview of the purpose and methodology employed in each of the proceeding chapters.
4.2.1 Chapter 5 – Sources of DC Bias
Section 3.3 listed a number of potential sources of DC bias. That there exists a realistic source of DC bias is critical to the relevance of this project. Without a credible source of direct current there is little point in pursuing investigations into the adverse effects that DC current can have on power transformers. Chapter 3 established Geomagnetically Induced Currents as a significant source of direct current. There have been numerous studies conducted into this phenomenon. As such further investigations are unlikely to yield any new contributions. Also equipment and time limitations present themselves as considerable obstacles to further analysis of the GIC problem. Hence alternate sources of bias will be researched.
Chapter 5 investigates sources of DC that are likely to occur in domestic, commercial and industrial applications. Namely the direct current contributions of personal computers (PC’s) and AC and DC drives are analysed.
The personal computer can be found in great numbers in commercial establishments such as libraries and office buildings and many domestic dwellings have a PC. In general, PC’s interface to the 230 V mains via a switch mode power supply. It is hypothesised that this interface could potentially act as a source of DC bias.
The analysis of the DC bias created by AC and DC drives will entail recording a minimum and maximum value for DC injection across each unit’s three line side phases. Measurement will be achieved through use of a DC current clamp utilising hall-effect technology. A range of drives will be tested including both AC and DC topologies with a variety of different manufacturers and ratings. The aim is to gain a representative cross section of the drives that are in use in industry today. The results obtained will be evaluated to determine whether the direct current component present (if any) follows a consistent pattern across the test sample. This will provide an indication as to whether the combined DC currents of a number of units exhibit a cumulative or cancelling affect.
The analysis of the DC offset created by personal computers will be achieved through use of an ammeter connected in series with the line side of the PC supply. This is possible due to the single phase nature of computers and their relatively low current requirements. With the meter in circuit measurement of the direct current average, minimum and maximum will be possible. An analysis of the results achieved once again will aim to identify whether or not a consistent injection pattern exists. That is, is there always a positive offset or does the sign of the offset vary from one unit to the next? This will assist in determining whether the effects of multiple computers DC injection are cumulative or whether cancellation occurs.
4.2.2 Chapter 6 – Single Phase Analysis – Magnetising Characteristics
To begin this analysis, tests will be conducted on a 1.2 kVA single phase transformer operating under zero AC load conditions. The only load connected to the unit secondary will be via a diode thus creating a half-wave rectifier. The secondary load will be variable thus allowing for a variable secondary direct current. For each level of secondary bias a number of primary parameters will be recorded. This will allow calculation of the magnitude of core loss current and magnetising current.
Existing literature indicates that a biased transformer load current will lead to an increase in magnetising current, increased VAR absorption and decreased power factor. An evaluation of the test results will be aimed at determining whether the effects outlined above actually occur in practice and to what extent.
With the zero AC load magnetising characteristics determined a new series of tests will be undertaken where by the magnetising currents will be monitored when the transformer is supplying rated AC load in parallel with the half-wave rectified DC component. The purpose of this procedure is to ascertain whether there are any variations in the transformer magnetising characteristics when operating at full load when compared with the zero AC load case. The difficulty with this procedure will lie in extracting the magnetising current component from the primary current.
4.2.3 Chapter 7 – Single Phase Analysis – Harmonic Characteristics
Two series of tests will be conducted to determine the harmonic performance of a 1.2 kVA single phase transformer. Firstly the primary and secondary voltage and current harmonic characteristics will be noted, (up to the 9th harmonic and including THD) when the transformer is loaded with rated AC current in parallel with a variable half-wave rectified current. The relevant trends will be plotted and adherence to standards determined.
The next test undertaken is almost identical in arrangement to the first test. The only difference is that a capacitor will be placed across the variable DC load. This capacitor will serve to smooth the rectified DC voltage. The purpose of this test is to determine whether variation will occur in harmonic distortion when the direct current waveform shape is altered. Once again the magnitude of the distortion levels will be compared to relevant standards to assess compliance.
4.2.4 Chapter 8 – Single Phase Analysis – Hysteresis Characteristics
Chapter 8 will firstly present plots for the 1.2 kVA single phase transformer hysteresis curve for a number of secondary DC levels. The hysteresis curve provides a suitable method for the graphical depiction of transformer saturation. This chapter will also provide the results of a MATLAB program which given a transformer’s B-H characteristic and value of flux bias will be able to predict the magnetising current waveform and RMS value. The B-H characteristic will be obtained from the experimental hysteresis plot that was obtained.
4.2.5 Chapter 9 – Three Phase Analysis – Magnetising Characteristics
Chapter 5
Sources of Direct Current
5.1 Overview
There are numerous potential sources of direct current which can bias a transformer’s load current. Section 3.3 outlines three significant sources of DC bias, namely Geomagnetically Induced Currents, Photovoltaic systems and AC and DC Drives. There are however numerous other sources of DC bias. One other potentially serious source of direct current stems from non-linear loads such as computers. This chapter aims to investigate the level of DC injection caused by computers and AC and DC Drives. The results of tests undertaken will be presented.
5.2 Computers
the voltages as required by the PC through use of a “chopper”. Switch mode power supplies are not only restricted to computers as they can also be found in Television, Video and Audio equipment.
The ideal switch mode power supply draws a symmetrical current with zero DC offset. However, imperfections in conduction devices can lead to asymmetry and hence the creation of a DC bias. This section aims to determine the level of DC bias (if any) that computers are responsible for.
5.2.1 Test Theory and Method
A total of ten desktop computers were tested to determine if a measurable line side DC component actually existed. The aim was to gain a representative sample of the PC’s that are in use today. As such the sample tested consisted of a range of different manufacturers, ratings and styles (laptop/Desktop). The sample also contained a wide range of different aged PC’s. One of the PC’s tested had an INTEL 486 processor.
The test was conducted with a multimeter set to the DC milliamp range inserted in series with the line side active supply. The meter utilised, had the capability of monitoring the minimum, maximum and average signal values. To gain an accurate picture of these time varying quantities the test was conducted over a ten minute period after which the necessary values were recorded. Whist the test was conducted a Windows Media application was run on each PC to simulate normal operating conditions.
5.2.2 Test Results and Analysis
DC offset in its line side current. In fact for the ten units tested an average DC component of 11.3 mA was recorded.
DC Injection Tests for Computers
Style and Power Supply Size Minimum Value (mA) Maximum Value (mA) Average Value (mA)
Desktop (400 W) -57 56 17
Desktop (250 W) -44 43 12
Desktop (200 W) -38 30 6
Desktop (350 W) -44 43 11
Desktop (350 W) -41 51 13
Desktop (250 W) -44 44 13
Desktop (300 W) -33 34 10
Desktop (350 W) -42 49 11
Desktop (400 W) -57 74 16
Laptop (90 W) -15 26 4
Average Minimum Value = -41.5 mA Average Maximum Value = 45 mA
PC Average = 11.3 mA
Table 5.1: Results for Measurement of DC Load Current Component for Computers
There are a number of implications that accompany these findings. Firstly, a computer does represent a source of DC bias even though the level is relatively small. Secondly, if there are a number of computers connected to a common bus there may be a cumulative effect in which the DC bias of each unit is of the same sign and hence adds. One must however be cautious in stating this second implication. The sample size utilised was only ten. To confidently state that there is a consistent cumulative effect would require a test be conducted with a much larger sample size with supporting results. Also, increasing the test duration would allow greater confidence to be attributed to findings.
computers will be connected to a common bus and hence a common transformer. If a cumulative DC effect does occur the resulting DC bias could be of a considerable magnitude.
5.3 AC and DC Drives
AC and DC drives are one of the most serious potential sources of DC bias in industry. Drives are used in applications where it is necessary to control the speed of a motor. This form of control is prevalent throughout industry. There are a variety of conduction topologies that can be utilised to achieve either an AC or DC adjustable speed drive arrangement. Some of these arrangements are more likely to create DC offset than others. This section will present the results of experimental work conducted on a range of drives with the aim of quantifying the level of DC that can potentially be created.
5.3.1 Test Theory and Method
A range of AC and DC drives were chosen for the test sample at Tully Sugar Mill in Far North Queensland. The drives chosen covered a broad range of ratings with a number of different manufacturers. Also the applications they were utilised in varied considerably from a simple conveyor belt to a mud pump drive.
5.3.2 Test Results and Analysis
The results of the tests conducted are presented in Table 5.2 and Table 5.3. The level of DC figure displayed represents the minimum and maximum value that was recorded for all three phases.
AC Drives
Manufacturer Model Rating (kW) Level of DC( mA)
Allen-Bradley Powerflex 70 7.5 2-20 Control Techniques Unidrive VTC
Commander CDV Commander CDE Unidrive VTC Unidrive VTC Unidrive VTC Unidrive VTC 5.5 7.5 22 22 30 55 160 8-14 10-30 13-55 400-1100 -500-2300 500-1900 600-1600 Toshiba VF-A3
VF-A3 Tosvert-130G2 3.7 7.5 4 -10-30 30-200 10-50
Zener Zener 11 6-10
Table 5.2: Results for Measurement of DC Load Current Component for AC Drives
DC Drives
Manufacturer Model Rating Level of DC (A)
Control Techniques (Slat Conveyor)
Mentor II 75 kW 2.3-4.8
Control Techniques (Rubber Belt)
Mentor II 75 kW 0.2-1.6
Control Techniques (Bosco Fugal)
Mentor II 75 kW 0.3-1.2
Control Techniques (High Grade Fugal)
Mentor II 410 A 0.6-1.7
The results displayed in the Tables on the previous page indicate that in some instances the level of DC injected by a unit can be considerable however a large amount of variation is also noted. The level of bias does seem to have a loose relationship with the size of the drive.
Over the entire sample the sign of the direct current was most often positive; however there were isolated cases where the variation in bias extended into the negative region. The measurement equipment utilised did not have the capability of recording an average value as with the PC test case. As such caution is once again taken regarding whether a cumulative effect is likely to occur. Further tests need to be conducted with a larger sample size and with equipment that provides an average value for direct current.
Chapter 6
Single Phase Analysis – Magnetising Characteristics
The initial step in understanding the effect of DC current on power transformers is to gain a solid understanding of the effects of direct current on single phase transformers. This chapter will present the results and analysis of experimental procedures conducted on a single phase transformer under a variety of DC bias conditions. To begin with the zero AC load case is analysed. That is, the magnetising characteristics for a single phase transformer are analysed when the secondary current is purely DC. Next the magnetising characteristics are again analysed however this time the secondary is loaded such that rated secondary current flows as well as a DC component.
6.1 Zero AC Load Test
6.1.1 Test Theory and Method
The test circuit utilised to complete this phase of testing is illustrated below in Figure 6.1. This circuit illustrates two identical 1.2 kVA single phase transformers connected in such a manner that their secondary voltages oppose and as such cancel. This technique is utilised so as to ensure that there is no secondary AC current present and hence no secondary alternating flux.
The secondary DC component is injected through use of a 12 volt battery and a variable resistive load. Diode D1 is in place to ensure that any small amount of alternating current is half wave rectified. The presence of a small alternating secondary component could potentially occur due to small output voltage mismatches between transformers 1 and 2.
Figure 6.1: Voltage Cancellation Circuit Utilised for No-Load Test
6.1.2 Test Results and Analysis
The results of the zero AC load tests are provided in Table B.1 of Appendix B. In order to be able to determine the transformer magnetising characteristics under zero AC load conditions the magnetising current had to be extracted from the no-load current. To solve this problem an expression had to be derived for the primary side power loss.
Prior to formulating this expression it must be realised that the secondary circuit will have negligible effect on primary power loss as there is no secondary AC component (due to dual transformer voltage cancelling) and the secondary DC component will not reflect to the primary side. However it should also be mentioned that it is the secondary DC component that leads to half cycle saturation and thus increased magnetising current. The factors contributing to the primary side power loss will be the loss associated with the primary winding resistance and the loss associated with the core loss current. Hence an expression for the primary side power loss is as follows:
S C W RMSR I V
I
P = 2 + (6.1)
where,
P = Primary Side Power Loss
RMS
I = Primary RMS current
W
R = Primary Winding Resistance
C
I = Core Loss Current
S
V = Supply Voltage
V R I P
I RMS W
C
2 −
= (6.2)
With the core loss current calculated the transformer magnetising current can now be found. To do this the assumption is made that the primary RMS current is comprised totally of the core loss current and the magnetising current. This is true provided there is no alternating component present in the secondary. The magnetising current can be found using:
2 2
C RMS
M I I
I = − (6.3)
Figure 6.2 illustrates the effect that a secondary DC bias has on core loss current and magnetising current.
Core Loss Current and Magnetising Current Variations with DC Bias
0 200 400 600 800 1000 1200 1400 1600
0 100 200 300 400
Secondary DC Current (mA)
C u rr en t (m A ) Icore (mA) Imag (mA)
Figure 6.2: Plot of Core Loss Current and Magnetising Current against a Secondary DC Bias
approximately 30 mA of direct current is injected. That is equivalent to approximately 23 % of the transformers magnetising current.
The increases in magnetising current are indicative of the effects explained in section 3.1. That is, the transformer is entering half cycle saturation as a result of the secondary DC component. The excess flux in the secondary is not cancelled by a corresponding component in the primary and thus to maintain a constant flux the magnetising current increases.
An analysis of the Figure 6.2 indicates that there is very little variation in the core loss current. The core loss current is comprised of two primary components; the hysteresis losses and the eddy current losses. These losses are functions of frequency and maximum flux density, neither of which has changed during this test. Hence it is expected that there will be very little variation in the core loss current. The small rise that does occur can be attributed to a slight mismatch between the secondary voltages of the two transformers connected in an opposing manner.
Shown in Figure 6.3 is a plot of real, reactive and apparent power for an increasing secondary direct current. This plot verifies the claim that a transformer operating under biased load current conditions will exhibit increased levels of VAR absorption. The volt amp reactive trend can be seen to resemble the same behaviour as the magnetising current from Figure 6.2. This is in line with expectations as the magnetising current is a purely inductive current and hence accounts for all reactive losses (assuming negligible primary winding leakage reactance).
Variation in Real, Reactive and Apparent Power with a Secondary DC Bias
0 50 100 150 200 250 300 350 400
0 100 200 300 400
Secondary DC Current (mA)
W VA VAR
Figure 6.3: Variation in Real, Reactive and Apparent Power with a Secondary DC Bias
Figure 6.4 depicts the relationship between displacement power factor and secondary DC current. With the large increase in reactive power illustrated in Figure 6.3 it is no surprise that the displacement power factor exhibits a downward trend. Once again it is evident that there is little variation in the displacement power factor for the first 30 mA. An interesting observation that can be made is that the gradient of the displacement power factor plot reduces towards the end of the scale tested.
Variation in Displacement Power Factor with DC Bias 0 0.05 0.1 0.15 0.2 0.25 0.3
0 50 100 150 200 250 300 350 400
Secondary DC Current (mA)
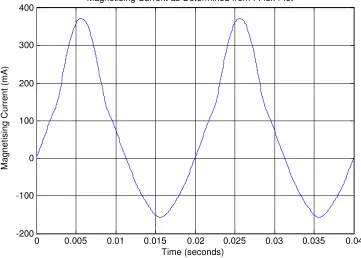
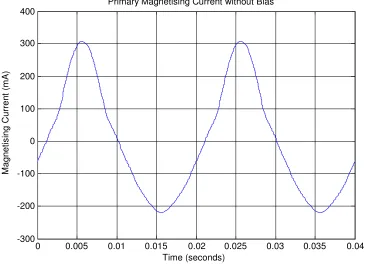
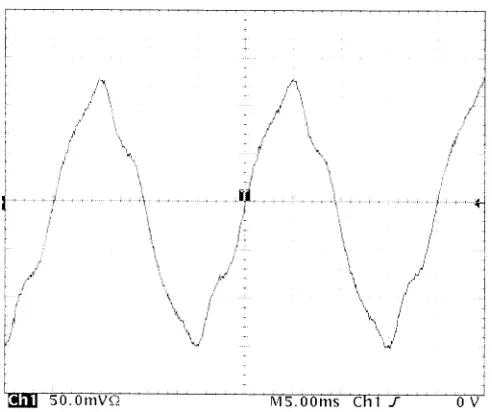
The next step in the analysis of the results is to inspect the plots of the no-load current waveforms. Before completing this however a better understanding should be obtained of the flux paths in the transformer core when the arrangement depicted in Figure 6.1 is utilised. The direction of the flux created by the secondary DC component can be found through simple application of the right hand thumb rule for a solenoid. The direction of the flux in the positive and negative cycles as created by the transformer magnetising current can be defined in a similar manner. The flux paths are illustrated below in Figure 6.5. On analysis of these paths it is evident that the flux established by the secondary DC current will reinforce the flux created during the positive cycle of the transformer magnetising current. The secondary DC flux will have the opposite effect on the flux created during the negative cycle of magnetising current. Hence a flux offset will occur as depicted in Figure 3.3.
Figure 6.5: Flux Paths Established due to the Secondary DC and Magnetising Current
manifested in the other no-load current plots in Appendix B. For 400 mA DC the negative cycle duration has further decreased to 4 milliseconds.
(a)
(b)
Figure 6.6: (a) No-Load Current Waveform for Zero DC Injection; (b) No-Load Current Waveform for 80 mA DC Injection
reinforced. The result is that the net core flux becomes increasingly positive biased. This bias reduces the duration of the negative cycle for the flux waveform and as a result the duration of the no-load current negative cycle is diminished.
Another very interesting point that is noticed in Figure 6.6 (b) is the relatively large magnitude of the negative peak of the no-load current when 80 ma of direct current is injected. An analysis of the no-load current waveforms for larger levels of DC injection (provided in Appendix B) shows that the value of this peak becomes progressively larger.
Prior to explaining this it must be remembered that the secondary DC component is not reflected to the primary. This can be verified by placing a DC ammeter in series in the primary circuit. Even when a very large DC component is injected in the secondary there will be zero direct current present in the primary. Thus no-load current remains symmetrical.
When a positive bias exists in a transformer’s secondary load current the flux waveform itself becomes biased. As a result of this the duration of the negative cycle of magnetising current is reduced. The waveform of this current must however maintain symmetry or in other words the area encompassed by the positive half cycle must equal the area encompassed by the negative half cycle. Hence to maintain symmetry the peak value of the negative cycle progressively increases to compensate for a reduction in negative cycle duration. The converse occurs when a negative flux bias is induced.
6.2 Magnetising Characteristics at Rated Load
6.2.1 Test Theory and Method
The primary difficulty that was encountered in this test was extracting the no-load current from the load current. A means had to be found from which the effect of the load current could be cancelled out. This was achieved through utilisation of the circuit depicted in Figure 6.7. To cancel out the effects of the resistive load current the primary and secondary load current components had to appear equal but opposite to the Power Quality Analyser (PQA) current clamp. To achieve this, the leads to the transformer primary and secondary positive inputs must be coiled in such a manner that they reflect the transformer voltage ratio (TVR) which is:
578 0 415 240: . V
: V
TVR = P S = = (6.4)
The optimum combination to achieve the ratio shown Equation 6.4 is to create a coil of 7 turns on the primary input and 12 turns on the secondary input. This yielded the following measurement ratio (MR):
583 0 12
7 : .
MR= TURNS TURNS = (6.5)
This results in ratio which is approximately 0.87% greater than the ideal ratio.
With the primary and secondary measurement coils created the PQA current clamp is clamped over both coils. The two coils have to be arranged such that the flux created by each in the current clamp flows in opposite directions hence cancelling out. With this method utilised the resistive current due to the AC load cancels out and the PQA only measures the no-load current. The DC current in the secondary is not a problem as the current clamp cannot measure DC. There will be a slight error in the current measured due to the slight mismatch between the ideal ratio and measurement ratio.
6.2.2 Test Results and Analysis
The results of this series of tests are provided in Table B.2 of Appendix B. The method used to calculate the core loss current and magnetising current differs to that which was used in Section 6.2. The method employed in Section 6.2 takes into account the contribution to primary power loss made by the primary winding resistance losses. This is not necessary using the technique shown in Figure 6.7 as these losses have been cancelled. Thus the core loss current can be calculated as follows:
DPF I
IC = 1RMS× (6.6)
The values for I1RMS and DPF were measured and are provided in Table X of Appendix X. With the core loss current calculated the magnetising current can be computed as follows:
2 2
C RMS
M I I
I = − (6.7)
characteristics and the presence of a secondary DC component causes a large increase in magnetising current which can potentially lead to half cycle saturation.
Core Loss Current and Magnetising Current Variations with DC Bias
0 200 400 600 800 1000 1200 1400 1600
0 100 200 300 400
Secondary DC Current (mA)
C ur re nt (m A) Icore (mA) Imag (mA)
Figure 6.8: Plot of Core Loss Current and Magnetising Current against DC Bias
It is noted that the core loss current shown in Figure 6.8 is slightly enlarged on the results shown in Figure 6.2. This is attributed to ratio mismatch.
Variation in Real, Reactive and Apparent Power with a Secondary DC Bias
0 50 100 150 200 250 300 350 400
0 100 200 300 400
Secondary DC Current (mA)
W VA VAR
Shown in Figure 6.9 is the plot of real, reactive and apparent power with a secondary DC Bias. This plot emulates the results shown in Figure 6.3. The absorption of volt amperes reactive with a secondary DC bias present and rated AC load can be seen to rise in a fashion almost identical to that which occurre