The Impact of Parental Income and Education on the Schooling of
Children
*Arnaud Chevalier (Royal Holloway - University of London and IZA)
Colm Harmon (University of Sydney and IZA)
Vincent O’Sullivan (TILDA, Trinity College Dublin and ESRI)
Ian Walker (Lancaster University Management School and IZA)
Abstract
: We investigate the relationship between early school-leaving and parental
education and paternal income using UK Labour Force Survey data. OLS estimation reveals
modest effects of income, stronger effects of maternal education relative to paternal, and
stronger effects on sons. Using IV methods to simultaneously model the endogeneity of
parental education and income, we find no effect of maternal education. Under certain
assumptions, paternal education remains significant (for daughters only). Similarly there
are modest effects of paternal income for sons. Thus policies that alleviate income
constraints to alter schooling decisions may not be as effective as policies which increase
permanent income.
Keywords:Early school leaving, intergenerational transmission
Corresponding Author: viosulli@tcd.ie
*Financial support from the HM Treasury Evidence Based Policy programme, the Nuffield Foundation Small
Grant Scheme and the award of a Nuffield Foundation New Career Development Fellowship to Harmon is also gratefully acknowledged. Chevalier is also a Research Fellow at the University College Dublin Geary Institute. We are grateful to Pedro Carneiro, Kevin Denny, Robert Haverman, Lisa Farrell, Robin Naylor, Bobbi Wolfe and seminar participants at ANU Canberra, CEMFI in Madrid, RAND in Santa Monica, the University of Glasgow, School of Public Health at Harvard University, the Melbourne Institute, RMIT, University of Warwick and the Tinbergen Institute for comments. The data used in this paper was made available by the UK Data Archive at the University of Essex.
ESRI working papers represent un-refereed work-in-progress by researchers who are solely responsible for the content and any views expressed therein. Any comments on these papers will be welcome and should be sent to the author(s) by email. Papers may be downloaded for personal use only.
The Impact of Parental Income and Education on the Schooling of Children
1. Introduction
A considerable literature has focused on the effects of parental background on outcomes for their children such as cognitive skills, education, health and subsequent income (for a review see Black and Devereux (2011)). There is little doubt that economic status is positively correlated across generations. Parents might affect the behavior and decisions taken by their children through genetic transmission, preferences, or/and environment. Indeed, the view that more educated and richer parents can provide a “better” environment for their children has been the basis of many interventions.
The nature of the policy interventions that are suggested depends critically on the nature of the intergenerational transmission mechanism and the extent to which the relationship is causal. In particular, it has proven difficult to determine whether the transmission mechanism works through inherited genetic factors or environmental factors and, to the extent that it is the latter, what is the relative importance of parental education and income? Moreover, the link between the schooling of parents and their children could be due to unobserved inherited characteristics rather than a
causal effect of parental education or income per se in household production. This issue is
explored in detail in the review by Björklund and Salvanes (2011).
An example of the importance of maternal education on child’s outcome is provided in Currie and Moretti (2003) who found a positive relationship between maternal education and their child’s birth weight, which is a strong predictor of child health. The existence of such effects provides an important argument for subsidizing education, especially in households with low income and/or low educated parents. Indeed there may be multiplier effects since policy interventions that increase educational attainment for one generation may create spillovers to later generations. The literature is not entirely consistent but it is widely believed that, while raising the education of mothers and fathers has broadly similar effects on household income, the external effects on children associated with parental education are larger for maternal education than for paternal because mothers tend to be the main provider of care within the household.
Understanding the mechanisms by which parental education may affect children’s outcomes is more difficult than establishing that there is an effect. Firstly, parental education may be a direct input into the production function that generates the quality of the endowments that children have in various domains (health, ability etc.). Secondly, it may also affect the choice of other inputs. Thirdly, it may indirectly facilitate a higher quantity and/or quality of other inputs through its effect on household income. The use of policy instruments such as income transfers to attempt to break the cycle of disadvantage presumes this latter route is important. Moreover, once one controls for education (as a long-run determinant of the level of permanent income), current income is likely to pick up the effect of income shocks that would matter only in the presence of credit market constraints.
simultaneously tried to account for the endogeneity of both parental education and parental income. The distinction between education and income is important since differences in policy approaches hang on their relative effects. Using a series of British cross-section datasets, we begin by confirming the usual finding using least squares - that parental education levels and paternal
income are positively associated with good child outcomes: in particular, with later school leaving.1
This outcome measure is important because recent UK governments have targeted a reduction in the proportion of pupils leaving at 16 and committed to a phased increase in the minimum age at which youths can leave education and training. We go on to use instrumental variable methods to
take account of the endogeneity of both parental income and education. We exploit a variety of
ideas for identification that have been used in other research, including: changes in the minimum school leaving age for the parents; month of birth of the parents which captures early school tracking that affected the parental cohorts and parental union status and its interactions with occupation that affected paternal income.
2. Previous Literature
It is widely thought that children brought up in less favorable conditions obtain less education despite the large financial returns to schooling (Heckman and Masterov (2005). Indeed there is a large correlation between the education level of parents and their children (Björklund and Salvanes (2011)). However the transmission mechanism behind such intergenerational correlations has never been made clear. Krueger (2004) reviewed various contributions supporting the view that financial constraints significantly impact on educational attainment. However, Carneiro and
Heckman (2004) suggest that current parental income does not explain child educational choices,
but that family fixed effects that contribute to permanent income, such as parental education
levels, have a much more positive role. This is the central conclusion of Cameron and Heckman (1998) using US data, and Chevalier and Lanot (2002) using the UK National Child Development Study data.
In the literature to date, researchers have attempted to identify the exogenous effect of either parental education or of parental income, but not both effects simultaneously. The literature on estimating the causal effect of parental education on the child’s educational attainment has relied on three identification strategies: instrumental variables, adopted children, and twins.
The first identification strategy uses instrumental variables methods based on ‘natural’ experiments or policy reforms that change the educational distribution of the parents without directly affecting children. Black et al. (2005) exploit Norwegian educational reforms which raised
1 We also investigate the relative effects of parental education levels and household income on educational
the minimum number of years of compulsory schooling over a period of time and at differential rates between regions of the country. Their IV estimates show little evidence of causal effects except for evidence of maternal education on son’s education. However, Oreopoulos et al. (2006) using the same approach, but using US Census data from 1960, 1970 and 1980, report that an increase in parental education by one year decreases the probability of a child repeating a schooling year (or grade) by between two and seven percentage points. Investigating some possible mechanisms for this education transmission, Dixon et al. (2013) confirms the causal effect of paternal education on literacy and numeracy skills from as early as age four and estimates that by age sixteen, the children of parents affected by a British school leaving age reform gained an additional 0.1 of a standard deviation over other children. Lundborg et al. (2011) report a positive effect on cognitive, non-cognitive skills and health for Swedish children whose parents were affected by a similar reform. Other instruments, such as the 1968 rioting of French students (Maurin and McNally 2008), or exogenous changes in the cost of education (Carneiro et al. (2007)), or the G.I. Bill (Page 2006) all tend to support a positive causal effect of parental education on the human capital of children. Of course, the minimum school leaving age is likely to affect the bottom of the schooling distribution more than the top so there is a clear case for thinking, in a heterogeneous effects model, that such estimates will provide only LATE estimates that are not strictly comparable to OLS. However, to the extent that policymakers are particularly concerned about early school leavers, such estimates are still of interest.
Alternative strategies to account for genetic effects is to compare adopted and natural children (Sacerdote (2004) or Plug (2004) or the children of twins (Behrman and Rosenzweig (2002). Bjorklund et al. (2006) uses a register of Swedish adoptees, which allows controls for both natural and adoptive parents’ education. After correcting for the potential bias caused by non-randomness in this population, they find that genetics account for about 50% of the correlation in education between generations but also that the causal effect of adoptive parents’ education remains highly significant.
Holmlund et al. (2008) investigate whether the disparities in results are due to differences in the sample used or to the identification strategies. Using Swedish Population Register data, they implemented all three methods, i.e. twins, adoptees and IV. Their results are consistent with the weight of the existing literature. In twin studies, the maternal effect is small and about half of the paternal education effect. This conclusion is reversed when using adoptee samples. When relying on IV to estimate the causal effect of parental education, the paternal effect is never significant but the maternal effect is quite large. They also find that there are non-linearities in the effect of education with the effect of parental education being larger at higher levels of education. Pronzato (2012) notes that the estimates for maternal education are sensitive to size and selection, in a way that can reconcile the results from different studies.
The literature on the causal effects of parental earnings or incomes on educational outcomes is not
moving to more affluent areas. MTO programs are associated with noticeable improvements in child behavior and test scores, but whether these are caused by the financial gain, changes in the
physical environment, school effects and/or peer-group changes remains unclear.2 Other US work
uses welfare-to-work reforms but again the income changes are accompanied by other behavioral changes – for example such reforms are aimed at increasing parental labor supply, which may also
affect child attainment.3
Sibling-based studies exploit differential outcomes and intertemporal variation in incomes but it is far from clear that parents do not take compensatory actions in the face of differential financial resources associated with each sibling. If they do, then sibling studies estimate the effects net of those actions. Other studies look at value added in the form of changes in outcomes associated with changes in income over time to difference out unobserved heterogeneity. Similar studies use early measures of outcomes as controls for unobserved heterogeneity. However, estimation of such lagged dependent variable models are, in general, inconsistent in the presence of fixed child or family effects. Nor are they really very satisfactory ways of dealing with endogeneity because income may, itself, respond to lagged outcomes – for example, a failing child may stimulate a parent to work harder, to provide more financial resources to allow the child to improve.
In the absence of convincing experimental evidence and because of doubts over the validity of sibling-based studies, instrumental variables have been used to identify the effect of parental income effects on child outcomes. Shea (2000) uses union status (and occupation) as an instrument for parental income. The identifying assumption is that unionized fathers are not more ‘able’ parents than nonunionized fathers with similar observable skills. Mayer (1997) uses variation in family income caused by state welfare rules, income sources and income before and after the education period of the child, as well as changes in income inequality. While strong identification assumptions are used in both these studies, they both find that changes in parental long-run
income have only modest and sometimes negligible effects on the human capital of the children.4
Finally, Jenkins and Schluter (2002) is notable for being one of the few studies to control for both income, at various ages and education. They study the type of school attended (vocational or academic), using a small German dataset. They find that later income is more important than early income, but that income effects are small relative to education effects. However, the analysis assumes exogenous income and parental education.
2 Work on MTO by Sanbonmatsu et al. (2006) suggests that MTO-driven neighbourhood effects on academic
achievement were not significant.
3 In the UK, the pilots of Educational Maintenance Allowances (EMA’s) provided a sizeable means tested cash benefit
conditional on participation in education and paid, depending on pilot scheme, either to the parents or directly to the child (Dearden et al. 2009). Enrollments increased by up to 6% in families eligible for full subsidies. However, this transfer was conditional on staying in school and so this reform is not directly informative about the effects of unconditional variations in income.
4 Acemoglu and Pischke (2001) use similar arguments to Mayer (1997) and exploit changes in the family income
3. Data, Sample Selection and Sources of Exogenous Variation
Our analysis is based on the Labour Force Survey (LFS) - a quarterly survey of households in the U.K. In each quarter there are roughly 120,000-160,000 respondents (more in earlier surveys) from the approximately 50,000-65,000 households surveyed. Households are surveyed for five consecutive
quarters. We pool the data from households in the fifth quarter over the period 1993-2012.5
Children aged 16 to 18 living at home are interviewed in the LFS so parental information can be matched to the child’s record. Our sub-sample consists of those children observed in LFS at ages 16 to 18 inclusive (and therefore have made their decision with respect to post compulsory education participation) which is approximately 56,000 observations, or 4% of all LFS respondents (which corresponds closely to the population census data).
The age range we consider is limited because we need to observe respondents while they are still living at home in order to observe parental background (respondents are not asked directly about their parents). An examination of British Household Panel Survey data suggests that only 6% of children aged 16-18 have already left home. However, this censoring in the LFS data becomes more severe with older teenagers - whilst 98% of 16-year-old children are observed living with both
parents, this proportion in down to 88% for those aged 18 years old.6 We therefore drop 2,581
teenagers who do not live with their parents and a further 12,995 who live with only one of their parents, since we need to observe both paternal and maternal education.
Due to these age restrictions, the key outcome of interest in this paper is the decision to participate in post-compulsory schooling, defined as a dummy equal to one if the 16 to 18 year old child is either in post compulsory education at present or was in education between 16 and 18 but had left
school by the time of interview.7 Only 16 year olds who are surveyed between September and
December are included to ensure information on their decision to leave or remain in education is available.
To arrive at our final sample we also drop observations from Scotland and Northern Ireland. Although these regions changed their minimum school leaving ages at different times than England and Wales they also have quite distinct education systems. This drops 5342 observations.
Moreover, for our instruments to be available we impose the following additional restrictions on the data: we select teenagers where the father is working and reporting his income, where both parents were born after 1933 (and so were not affected by the earlier raising of the school leaving from 14 to 15 and whose school leaving is unlikely to have been directly affected by World War II), where both parents were born in the United Kingdom and are currently resident in England or
Wales. Thus, our estimates need to be viewed as conditional on these selections.8 We also drop
5 Prior to 1993 there was no earnings data in LFS. Between 1993 and 1998, earnings data is available only for fifth wave
respondents; from 1998 the earnings data is collected in the first and in the final wave.
6 Re-estimating without the 18 year olds showed no economically or statistically significant differences in results. 7 We may thus underestimate participation if individuals postpone attending post-compulsory education until they are
over 18. We believe this is a rather rare event.
8 Whilst this may create some selection bias it would be difficult to overcome this in our data. Since parental
any observations where there is missing data on the variables of interest. The details of the original LFS data and the impact of the selection criteria on the variables of interest can be seen in Table 1. The final sample contains 15,798 observations. In the final two columns of Table 1 we can see that the final set of restrictions does not alter the mean age and educational attainment of those 16-18 year-olds living with both parents.
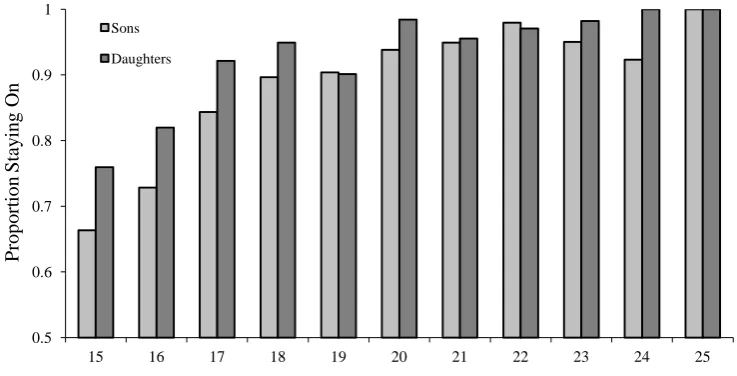
Figures 1 and 2 show the participation rate in post-compulsory schooling in our final sample broken down by paternal and maternal education. The education of the children appears closely correlated with the education of their parents, particularly up to a school leaving age of 18. Having parents with more education than this level does not substantially affect the staying-on probability
of children, which is then almost 100%.9 The fraction of sons with post compulsory schooling is 30
points higher for father with a degree (leaving age of 21) compared to those who left school at 15. There are some sizable gaps between the participation of girls and boys from lower educated parents. Among this group sons are more than 10 percentage points less likely to participate than daughters However these gender gaps in educational attainment narrow with parental education. Table 2 shows some selected statistics for the sample used in our analysis. The post-compulsory
schooling participation rate is 73% for boys and 83% for girls.10 There are large differences in the
parental education and household income levels between those that remain in school compared to those that leave: more than one year extra of parental education on average and more than 20% higher paternal earnings. Additionally, youth who did not attend post-compulsory education have slightly older parents.
Parental income is potentially endogenous either because it is correlated with unobservable characteristics which are correlated with the child’s educational attainment, or because the parental education effect is transmitted through income. Indeed, Shea (2000) estimates the impact of parental income using variation in income associated with union membership, industry and job loss and finds a negligible impact on human capital for most children (although parental income did seem to matter for children whose father had low education). Following Shea (2000) we assume that union membership status creates an exogenous change in income, which is independent of parenting ability and the child’s educational choice. Indeed the raw data, presented in Table 2, shows that children who stayed on were just as likely to have unionized fathers as children who do not stay on in education. Later, the estimates that we highlight are those that rely on only paternal occupation-union interactions as exclusion restrictions.
is also likely to be negatively correlated with parental education and income we might expect to underestimate the effect of income and education on the dependent variables. We also examined the effects of living with a stepparent but found that, while there was a negative stepparent effects, the interaction between this and education or income proved insignificant. Results are available on request.
9 Note that due to institutional characteristics there are only a few parents with school leaving age of 17, 19, 20 and
above 23.
10 Official statistics from the Department for Children, Schools and Families show 67% of boys and 75% of girls
Lewis (1986) and much subsequent work, demonstrates that wages vary substantially with union status, even after controlling for observable skills. This is also the case in our data. Figure 3 shows the kernel densities of the earnings of union member fathers and non-union fathers. The raw union/non-union earnings gap for fathers in our selected sample is 8%. If union wage premia reflect rents rather than unobserved ability differences it seems plausible to make the (stronger) identifying assumption, used in this paper; that union status, controlling for occupation, is uncorrelated directly with the parental influence on educational outcomes of the children. Support
for the view that unionization picks up differences in labor market productivity is mixed. Murphy
and Topel (1990) find that individuals who switch union status experience wage changes that are small relative to the corresponding cross-section wage differences, suggesting that union premia are primarily due to differences in unobserved ability. However Freeman (1994) counters this view, arguing that union switches in panel data are largely spurious so that measurement error biases the union coefficient towards zero in the panel. In any event, we are assuming, as in Shea (2000), that unionized fathers (and their spouses) are not more ‘productive’ as parents than non-union fathers with similar observable skills. Using data from the British Cohort Study (BCS) we find little
evidence to suggest that parenting behavior different across union status of fathers.11
Parental education is likely to be endogenous. Here we rely on two sources of exogenous variation. Reforms to the minimum school leaving age have frequently been used as a source of exogenous
variation.12 In this paper we identify the effect of parental education on children’s education using
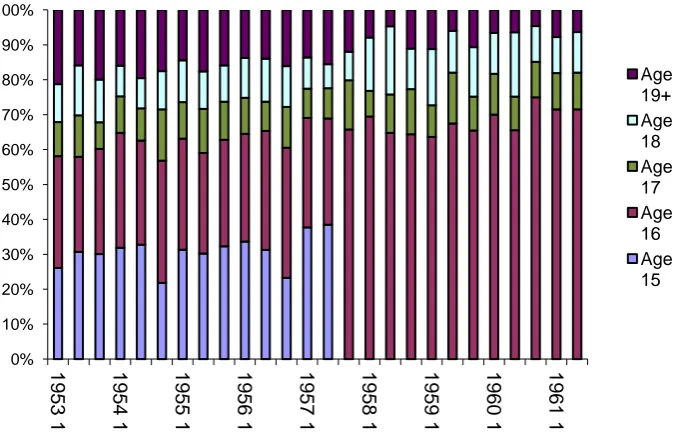
the exogenous variation in schooling caused by the raising of the minimum school leaving age (abbreviated as RoSLA: Raising of the School Leaving Age). Specifically, individuals born before September 1957 could leave school at 15 while those born after this date had to stay for an extra year of schooling. This policy change creates a discontinuity in the years of education attained by the parents. Figures 4A and 4B illustrate this by showing mean years of schooling by birth cohort (in 4 month intervals) around the reform date. That is, we take a narrow window of birth cohorts around the reform (+/- four years) to minimize the influence of any long-term trends across birth cohorts. There is a marked jump in the graph for parents born after September 1957 which coincides with the introduction of the new higher school leaving age. Note that, pre-reform, between 30% and 40% of the parents used in this paper had left school at the minimum. So the reform did bite and changed the behavior of a substantial fraction of individuals in the affected
11 The British Cohort Study (BCS) data, of all children born in England and Wales in a particular week in 1970, records, in
considerable detail, the attitudes and behaviours of fathers towards their children. This data suggests rather small differences in attitudes and behaviours across union status. For example, 23% on unionised fathers disagreed with the statement that “The needs of children are more important than one’s own”, compared to 18% of the non-unionised; 60% (62%) of children with unionised (non-unionised) fathers watched TV less than 2 hours per day on a typical weekend day; 83% (88%) of unionised (non-unionised) fathers read stories more than once per week; 57% (52%) of unionised (non-unionised) fathers always (as opposed to often/sometimes/never) talked to his child even when busy; 79% (79%) of unionised (non-unionised) fathers showed the child physical affection at least once per day and 36% (37%) praised the child at least once per day; 94% (95%) of unionised (non-unionised) fathers has helped young children learn numbers, etc; and 79% (80%) of unionised (non-unionised) fathers aspired for the child to continue in full-time education at age 16. The children also reported behaviour that might well reflect parenting styles. For example, 56% (54%) of the children of unionised (non-unionised) fathers made their own bed and 49% (52%) cleaned their own room.
12 See, for example, Harmon and Walker (1995) for the UK; Black et al. (2005) for Norway; and Oreopoulos et al. (2006)
cohorts. Individuals affected by the new school leaving age had, on average, completed half a year more schooling than those born just before the reform. Chevalier et al. (2004) showed that the effect of this reform was almost entirely confined to the probability of leaving at 15 relative to 16 – there was little effect on educational attainment higher up the years of education distribution. Hence, this reform only identifies a LATE for individuals with low levels of education. Table 2 shows that the proportion of fathers who were born before the RoSLA reform is higher than for mothers, reflecting their slightly greater age and the table also shows that early leavers typically have slightly younger parents.
A second source of variation in parental schooling that we exploit derives from parental month of birth (as in Crawford et al. (2007)). There are several ways in which month of birth can affect the parents’ education levels: through entry timing, leaving timing (Easter leaving rule, whereby children born between September and January, inclusive, could leave school at Easter), whole group teaching, developmental differences and through peer effects. The academic year starts in September but the traditional admissions policy that reigned in the 1950’s and 1960’s, when most of the parents in our data were young, allowed entry at the start of the term that the child turned 5 so that there were three points of entry each year: September, January and April/May. Thus the August born would start in April/May and have two fewer terms in primary school than their classmates. In the 1950’s and 60’s whole class teaching was the dominant teaching method and developmental differences associated with month of birth might imply that the youngest and the oldest might fare worse than the average. The year group moves as a single unit through the academic system so that they sit examinations at same time and would be at different development ages when facing the same examination. Finally, peer effects might also arise because the youngest might be dominated or intimidated by the oldest
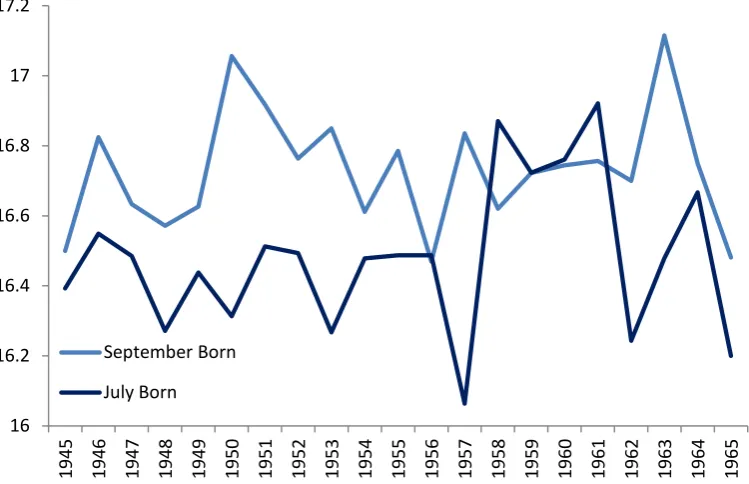
This developmental effect is particularly important since most of the parents in the data would have faced a selective schooling system where children were segregated into academic or vocational schools at the age of 11 based on a single test conducted on the same day across the whole country - known as the 11+ exam. Based on the results of this test, children were educated either in vocational or academic tracks. Children in the vocational track were much more likely to leave school at the minimum compulsory age, while those for in the academic track could go on to higher secondary school and university see Harmon and Walker (1995). These two different types of schools placed quite different expectations on the children and there was very little movement between school types after the age of 11. Figure 5 shows, by year of birth, the average age at which the parents in our data left full-time education for those who were September born, the eldest in
their class cohort, compared to those who were July born, the youngest.13 The typical difference in
years of schooling between the September and July born was around ¼ of a year for these cohorts born in the 50’s and 60’s. Notice that the gap closed completely for cohorts born in the early 1960’s when the 11+ examination was abandoned in most areas. Thus, the month of birth effect in
13 We use July rather than August for this comparison since there is likely to be some ambiguity with August-born
educational achievement seems to be mostly driven by the early tracking faced by the earlier cohorts.
4. Estimates
Our basic model of the impact of parental background on the post-compulsory schooling participation of their children is:
(1) PCc = β0 + β1Sm + β 2Sf+ β 3Yf + X'hΛ + f(DBm, DBf, DBc) + ωc
where the c, m and f subscripts refer to the child, mother’s and father’s characteristics within a
particular household h14. The dependent variable PC
cis a dummy variable defining participation in
post compulsory education. Equation 1 is estimated as a linear probability model to subsequently
facilitate the use of instrumental variables15. The effect of parental education levels, as measured in
years of schooling of both the mother and father (Sm , Sf), is included in the model linearly. In
Figure 1 and Figure 2 there is clearly a diminishing effect of parental education, however a linear specification more easily facilitates instrumental variable estimation in later estimates. Log parental
income Yh measured by father’s real log gross weekly earnings from employment. DB refers to date
of birth (year and month) so that f(.) controls for cohort trends in paternal, maternal and child education. With respect to child’s date of birth, we use a set of dummy variables for each year. With respect to parental date of birth (both year and month for both parents), we convert the date
to a continuous number and then enters the model as in cubic for each parent. Xh contains
characteristics common to all three members of the family - year of survey dummies as well as region of residence at time of survey.
In later extensions to our basic model, we additionally condition on paternal occupation, so that the difference in unionization between occupations does not identify the IV model. We categorize paternal occupation into blue-collar/manual versus white-collar/non-manual. We can repeat the entire analysis using seven different occupation categories – unskilled, semi-skilled, etc but the results are essentially the same. In other extensions to our basic model we add paternal union status, so that the identification in the IV model only comes from the interaction terms between union status and occupation. This then captures any differences in parenting behavior that unionized fathers may have.
Table 3 summarizes our OLS estimates of paternal income and parental education levels on the
probability of post-compulsory schooling of the child.16 Specification (1) only controls for parental
14 Standard errors are clustered at the household level throughout the analysis. Only about 13% of the sample are
siblings. The analysis is repeated separately for sons and daughters. Only about 7% of the sample are same-sex siblings and hence used to estimate the same equations.
15 The marginal effects from probit estimation are very close to the linear probability model coefficient estimates and
are available on request.
16 We control for smooth cohort trends by including a cubic function of parents months/years of birth. Full results are
years of schooling and suggests positive, if modest, paternal and maternal education effects on the schooling choice of both sexes. The impact of a year of maternal education is to increase the probability of post-16 participation by about 2.9 percentage points for boys and 2.4 percentage points for girls. The impact of paternal education is somewhat lower especially for daughters. Specification (2) examines the impact of paternal income but excludes the parental education controls. These estimates suggest modest but significant income elasticities with the effect being 11.8% boys and for 8.8% for girls. Finally specification (3) includes both education and income controls. The direct effects of maternal education estimated in Specification (1) are reduced very slightly in (3), but the paternal education and income effects are reduced by a factor of approximately one third to one half compared to (1) and (2) respectively, highlighting the correlation between paternal education and income.
The second set of estimates (4, 5 and 6) in Table 3 adds the paternal occupation status (blue collar dummy variable). This is potentially an endogenous variable, but since unionization rate differs by occupation, not controlling for occupation the union instrument might partially capture occupational choice which would invalidate its use. As expected, since parental occupation can be viewed as a proxy for permanent income, the estimates on education are almost identical to those obtained when controlling for paternal income. Thus, in specifications (5) and (6) income is best interpreted as deviation from permanent income. As such, the income effects are reduced by about 30% for boys and about 50% for girls. Note, however, that when controlling for occupation, adding paternal income only marginally reduces the effect of paternal education on the educational attainment of children. Thus indicating that the correlation between paternal education and income mostly captures the permanent component of income, rather than income shocks.
The final set of estimates in Table 3 shows the effects of parental education and paternal earnings when controlling for the effects (not interacted) of paternal union membership and paternal blue collar dummy (specifications (7), (8) and (9)). The effects of parental education are virtually unchanged compared to the estimates presented in columns (4) to (6); supporting the view that paternal union membership has no direct effect on the education decision of his children. For girls, the effect of paternal income also remains unchanged compared to specifications (5) and (6) while for boys it decreases by less than two percentage points.
To summarize these results: the effect of parental education on the decision to remain in school past compulsory age appears to be quite small - around 2-2.5 percentage points for maternal education (larger effects of paternal education on boys) and 2.5 to under 1 percentage point for paternal education (larger effects of paternal education on boys). The gap between the effect of maternal and paternal education increases when measures of, or proxies for, income are introduced since the maternal education effect remains largely unaffected while the paternal education effect drops by almost a half. Note also that the current income effects are greatly reduced when a measure of permanent income (the father occupation variable) is controlled for.
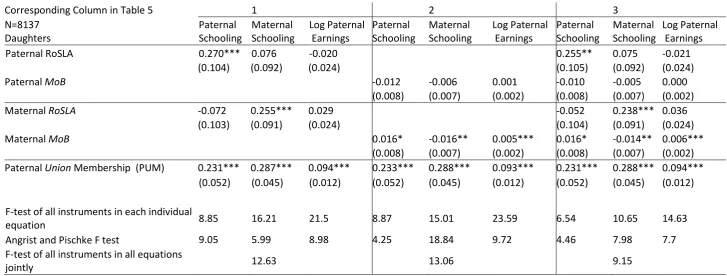
To control for the potential endogeneity of paternal income and parental schooling we specify a set of first stage equations. In Tables 4a-4d and Table 5 we show first stage and second stage results of IV estimation using different sets of instruments. The three first stage equations for maternal education, paternal education and the log of paternal earnings are:
(2) Sm= g(DBm, DBf, DBc) + X'hΓ + Z'f,mΔ+ ψm
(3) Sf = h(DBm, DBf, DBc) + X'hΠ + Z'f, mΗ+ χf
(4) Yf = k(DBm, DBf, DBc) + X'hΩ+ Z'f,mΘ+ ϕf
The functions f(.), g(.), h(.), k(.) are polynomials of order three in parental dates of birth and include
a set of dummy variables in child year of birth. ωc, ψm, χf, ϕf are idiosyncratic errors terms. Z
contains the instrumental variables. In some specifications we define a dummy variable RoSLA,
which takes the value one for parents born after September 1957. Given that we control for
smooth trends in parental date of birth, the RoSLA variable acts as a regression discontinuity and
picks up the effects of the reform alone. In some other specifications we include a linear month of
birth effect17 by including a month of birth indicator, MoB (which takes the value of one for
September born through to twelve for August born). Finally, paternal union membership (PUM)
and in some specifications, its interaction with the blue collar (i.e. manual worker) dummy variable, are incorporated into our first stage model as instruments. All instruments appear in all first stage equations.
We estimated a wide variety of first stages and corresponding second stage equations to examine the sensitivity of the second stage estimates to the set of exclusion restrictions used to define the instrumental variables. Our IV estimates have the property, which is also a feature of the OLS estimates, that the addition of income to a model containing just parental education levels makes little difference to the parental education estimates. Thus, we refrain from presenting specifications that contain just parental income or just parental education levels.
The estimates of the first stage equations for sons are shown in Table 4a and Table 4b and the estimates for daughters are shown in Tables 4c and 4d. Within each of these tables, each panel refers to a different set of estimated equations using different combinations of instruments and each column within each panel refers to an individual equation; the paternal schooling equation, the maternal schooling equation and the paternal log earnings equation. All of the instruments are used in each of the first stage equations. There are some cases where an instrument having a significant effect in an equation that a priori it would not be expected to have an effect. For example, paternal union membership has a significant effect in the maternal schooling equation. This is probably a byproduct of correlation caused by assortative mating.
In general, being affected by the raising of the school leaving age increased respective parental education by between 0.21 and 0.28 of a year, the effects being almost identical for both parents. The month of birth effect is also statistically significant and negative for both males and females in
some specifications but not in others. However in general, an August born child, on average, left school one fifth of a year earlier than a September born child. Comparing across the schooling
equations, the inclusion of MoB makes little difference to the size and significance of the RoSLA
effects. The two instruments identify the effects of exogenous shocks to parental education through different mechanisms - so that in models where both sets of instruments are included the estimates are almost identical to the ones obtained when the instruments are included individually. So while both instruments identify a population of marginal students, these are not identical populations.
The paternal earnings equation shows a significant positive union membership wage premium of slightly over 9% in Table 4a and 4c, which are consistent with existing UK evidence. In specifications in Table 4b and 4d the interactions of union membership and occupation show that the union premium is driven by blue-collar workers. Union membership has no effect on white collars earnings but increase blue collar earnings by up to 20%.
Table 5 shows the second stage estimates and estimate the probability of staying on separately for sons and daughters. Each column reports the IV estimates for different specifications of the first stage when both parental education and paternal income are instrumented. The effect of maternal education is always imprecisely estimated when controlling for paternal education and paternal earnings regardless of which set of instruments is used and never statistically significant. The estimate itself varies widely from specification to specification.
Similarly the effect of paternal education on sons is never significant and varies widely depending on the specification used. The effect of paternal education on daughters is between about 0.059
and 0.078 depending on the instruments used, but only significant in a few cases. The IV point
estimate of 0.07 is ten times the size of the OLS estimate of 0.007.
The effect of paternal earnings varies with the instruments used. There is never a statistically significant effect of paternal earnings on girls and the coefficients vary widely depending on the
specification. Although the estimated effect of paternal earnings on sons does vary between
specifications, In columns 5, 6 and 8, the effect of paternal income on sons is stable when paternal union status and the interaction between blue-collar father and paternal union status are used as
instruments and produces results that are significant at either the 5% or 1% level. When paternal
union membership and interactions of paternal occupation and union membership are used, the effect of the log of paternal income is between 0.157 (column 6) and 0.188 (column 5) depending on which instruments for parental education are used. Given that occupation is probably picking up permanent income, the paternal income effects could be viewed as the effects of short term income variations. However when only the interactions of union and occupation are used as instruments and both union and occupations are controlled for in the second stage (columns 7, 8 and 9), the estimates become very imprecise and unstable.
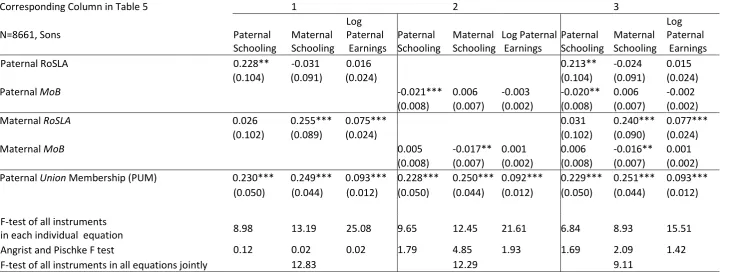
carried out to test the joint significance of the instruments. For example, in the left-hand panel of
Table 4a, the F-statistic for the joint significance of Paternal RoSLA, Maternal RoSLA and Paternal
Union Status in the Paternal Schooling Equation is 8.98. The F-statistic for these coefficients in the Maternal Schooling Equation is 13.19 and so forth. The F-Statistic for overall significance of all of these variables in all three equations in the left-hand panel is 12.83. The F-statistics for the overall significance of paternal month of birth, maternal month of birth and paternal union status in the set of equations estimated in the middle panel is 12.29. Thus the F-statistics in Tables 4a and 4c don’t always compare favourably with Stock and Yogo (2002) suggested cut-off of around 10. The modified F-statistic of Angrist and Pischke (2009) which is suggested for instruments in the case of multiple endogenous variables and which partials out the effects of the instruments on the other endogenous variables, is also reported. There are no suggested critical values as yet but the values in Table 4a are worryingly small.
In Table 4b (sons) and Table 4d (daughters) one can see the estimates of first stage specifications which allow for the interaction of paternal union status and paternal blue-collar worker status to be used as instruments. In these specifications, the instruments are much stronger than under the specifications in Table 4a (sons) and Table 4b (daughters) both when looking at the significance of the instruments across all three equations jointly and when looking at each equation individually. Additionally, the Angrist and Pischke F-tests are also much larger relative to those in Table 4a and Table 4c when the interaction of union status and blue-collar father was not used as an instrument. It is difficult to choose the strongest first stage specification given that there are different ways of measuring the strength of instruments. However the set of first stage equations estimated in Table 4b (sons) and Table 4d (daughters) have instruments which, whilst not very strong, are not weak either. Whether or not one includes paternal union status in the second stage equation (and hence not using paternal union status as an instrument) does not, in general, greatly affect the strength of the instruments. Thus the choice of preferred specification in Table 5 between columns 4, 5, 6 and columns 7, 8, 9 depends on whether or not one considers paternal union status as belonging in the second stage equation even when controlling for paternal occupation.
5. Conclusion
This paper has addressed the intergenerational transmission of education and investigated the extent to which early school leaving (at age 16) may be due to variations in permanent income and parental education levels. Least squares revealed conventional results - stronger effects of maternal than paternal education and stronger effects on sons than daughters. We also found that the education effects remained significant even when household income was included. Current income remains significant even when some measures of permanent income are included which indicates that some children could be financially constrained in their decision to attend post-compulsory education.
daughter staying on by seven percentage points. In contrast, maternal education has no statistical effect on the probability of remaining in education for either sons or daughters regardless of which instruments are used.
Using certain instruments to account for the endogeneity of paternal income, the elasticity of income on schooling decisions roughly doubles for sons. However there is no effect on daughters and the effect on sons is conditional on excluding paternal union status from the second stage and using the interaction of paternal union status and paternal occupation as instruments. However, taking the estimates at face value, the size of the effect of short term income, presuming occupation status is picking up the effect of permanent income, is relatively small.
The results imply that policy options that are explicitly aimed at relieving credit constraints at the minimum school leaving age such as EMA (see Dearden et al. (2009) may not be very effective in promoting higher levels of education (a finding that is consistent with recent UK evidence that used linked administrative data for a cohort from age 11 to age 19 (see (Chowdry et al. (2010)). A policy of increasing permanent income, like increasing parental education (or say through Child Benefit) would on the other hand have some positive effects, especially for daughters. The recently
proposed increase of the school leaving age to 18 would also benefit future generations through
Figures
Figure 1 Post Compulsory Participation by Paternal Education
Figure 2 Post Compulsory Participation by Maternal Education
0.5 0.6 0.7 0.8 0.9 1
15 16 17 18 19 20 21 22 23 24 25
P
ro
p
o
rtio
n
S
ta
y
in
g
O
n
Age father left education
Sons Daughters
0.5 0.6 0.7 0.8 0.9 1
15 16 17 18 19 20 21 22 23 24 25
P
ro
p
or
ti
o
n S
ta
y
ing
O
n
Age mother left education
Sons
[image:16.595.77.439.143.308.2] [image:16.595.77.446.394.582.2]Figure 3 Distribution of Father’s Weekly Earnings (in GBP 2005) by Union Status
Figure 4A Distribution of Paternal School Leaving Age by Third of Year of Birth
Paternal Weekly Earnings
union non-union
0 500 1000 1500 2000
0 .001 .002
0% 10% 20% 30% 40% 50% 60% 70% 80% 90% 100%
1953 1 1954 1 1955 1 1956 1 1957 1 1958 1 1959 1 1960 1 1961 1
Age 19+ Age 18 Age 17 Age 16 Age 15
[image:17.595.102.444.459.678.2]Figure 4B Distribution of Maternal School Leaving Age by Third of Year of Birth
Figure 5 Average School Leaving Age by Year of Birth: England Only 0%
10% 20% 30% 40% 50% 60% 70% 80% 90% 100%
1953 1 1954 1 1955 1 1956 1 1957 1 1958 1 1959 1 1960 1 1961 1
Age 19+
Age 18
Age 17
Age 16
Age 15
Birth Cohort in Four Month Intervals
16 16.2 16.4 16.6 16.8 17 17.2
1945 1946 1947 1948 1949 1950 1951 1952 1953 1954 1955 1956 1957 1958 1959 1960 1961 1962 1963 1964 1965
[image:18.595.82.457.418.660.2]Tables
Table 1 Sample Selection from pooled LFS 1992-2012
All those aged 16, 17 or 18
Living away
from parents Living with one parent Living with both parents Final sample
Age distribution:
% aged 16 23.08 10.34 24.26 23.5 24.01
% aged 17 39.84 29.87 41.12 40.06 39.92
% aged 18 37.09 59.78 34.62 36.44 36.07
% staying on at
16 75.08 50.02 72.37 77.46 78.12
Observations: 56,650 2,581 12,995 41,074 16,798
Table 2 Descriptive Statistics LFS 1992-2012 Estimation Sample Pat ern al L og E arn in gs Pat ern al Sc ho ol L ea vin g Ag
e Matern
al Sc ho ol L ea vin g Ag
e Patern
al A ge M at ern al A ge Fat he r affe cte d b y R oS LA M oth er A ffe cted b y Ro SL A Fat he r b orn Sep t – De c. M oth er b orn Sep t – D ec . Pat ern al Un io n M em be rsh ip Age o f R es po nd en t
Girls: N= 8137
Did not stay in full time education
(17%): 5.91 15.85 15.94 45.27 43.12 0.46 0.33 0.31 0.33 0.41 17.14
(0.53) (1.06) (1.01) (5.48) (4.70) (0.50) (0.47) (0.46) (0.47) (0.49) (0.75)
Did stay in full time education
(83%): 6.20 16.85 16.87 47.18 45.11 0.40 0.29 0.31 0.32 0.42 17.11
(0.61) (1.54) (1.43) (5.28) (4.67) (0.49) (0.45) (0.46) (0.47) (0.49) (0.77)
Boys: N= 8661
Did not stay in full time education
(26%) 5.91 15.83 15.86 45.39 43.20 0.43 0.32 0.30 0.34 0.42 17.13
(0.49) 1.09) (0.98) (5.80) (4.92) (0.49) (0.47) (0.46) (0.47) (0.49) (0.76)
Did stay in full time education
(74%) 6.18 16.72 16.79 47.21 45.09 0.41 0.31 0.31 0.32 0.41 17.12
(0.61) (1.49) (1.42) (5.35) (4.72) (0.49) (0.46) (0.46) (0.47) (0.49) (0.76)
Table 3 OLS estimates of Parental Education and Income on the Probability of Post-Compulsory Schooling of Children
Specification: (1) (2) (3) (4) (5) (6) (7) (8) (9)
Sons: N=8661
Maternal School Leaving Age 0.029*** 0.028*** 0.026*** 0.026*** 0.026*** 0.025***
(0.002) (0.002) (0.002) (0.002) (0.002) (0.002)
Paternal School Leaving Age 0.025*** 0.020*** 0.017*** 0.015*** 0.016*** 0.015***
(0.002) (0.002) (0.002) (0.002) (0.002) (0.002)
Paternal Log Earnings 0.118*** 0.066*** 0.064*** 0.040*** 0.062*** 0.038***
(0.008) (0.008) (0.008) (0.008) (0.008) (0.009)
Daughters: N= 8137
Maternal School Leaving Age 0.024*** 0.023*** 0.021*** 0.020*** 0.021*** 0.020***
(0.002) (0.002) (0.002) (0.002) (0.002) (0.002)
Paternal School Leaving Age 0.015*** 0.012*** 0.009*** 0.007*** 0.009*** 0.007***
(0.002) (0.002) (0.002) (0.002) (0.002) (0.002)
Paternal Log Earnings 0.088*** 0.050*** 0.045*** 0.027*** 0.044*** 0.027***
(0.007) (0.008) (0.008) (0.008) (0.008) (0.008)
Control for paternal union member no no no no no no yes yes yes
Control for paternal blue collar occ no no no yes yes yes yes yes yes
Table 4a Instrumental variable estimates: First Stage Regressions
Corresponding Column in Table 5 1 2 3
N=8661, Sons Paternal
Schooling Maternal Schooling
Log Paternal
Earnings Paternal Schooling Maternal Schooling Log Paternal Earnings Paternal Schooling Maternal Schooling
Log Paternal Earnings
Paternal RoSLA 0.228** -0.031 0.016 0.213** -0.024 0.015
(0.104) (0.091) (0.024) (0.104) (0.091) (0.024)
Paternal MoB -0.021*** 0.006 -0.003 -0.020** 0.006 -0.002
(0.008) (0.007) (0.002) (0.008) (0.007) (0.002)
Maternal RoSLA 0.026 0.255*** 0.075*** 0.031 0.240*** 0.077***
(0.102) (0.089) (0.024) (0.102) (0.090) (0.024)
Maternal MoB 0.005 -0.017** 0.001 0.006 -0.016** 0.001
(0.008) (0.007) (0.002) (0.008) (0.007) (0.002)
Paternal Union Membership (PUM) 0.230*** 0.249*** 0.093*** 0.228*** 0.250*** 0.092*** 0.229*** 0.251*** 0.093***
(0.050) (0.044) (0.012) (0.050) (0.044) (0.012) (0.050) (0.044) (0.012)
F-test of all instruments
in each individual equation 8.98 13.19 25.08 9.65 12.45 21.61 6.84 8.93 15.51
Angrist and Pischke F test 0.12 0.02 0.02 1.79 4.85 1.93 1.69 2.09 1.42
F-test of all instruments in all equations jointly 12.83 12.29 9.11
Table 4b Instrumental variable estimates: First Stage Regressions
Corresponding Column in Table 5 4, 7 5, 8 6, 9
N=8661, Sons Paternal Schooling Maternal Schooling Log Paternal Earnings Paternal Schooling Maternal Schooling Log Paternal Earnings Paternal Schooling Maternal Schooling Log Paternal Earnings
Paternal RoSLA 0.241** -0.018 0.012 0.228** -0.011 0.010
(0.104) (0.091) (0.024) (0.104) (0.091) (0.024)
Paternal MoB -0.020** 0.006 -0.003 -0.019** 0.007 -0.003
(0.008) (0.007) (0.002) (0.008) (0.007) (0.002)
Maternal RoSLA 0.017 0.247*** 0.078*** 0.022 0.231*** 0.017
(0.102) (0.089) (0.024) (0.102) (0.089) (0.102)
Maternal MoB 0.005 -0.018** 0.001 0.005 -0.016** 0.001
(0.008) (0.007) (0.002) (0.008) (0.007) (0.002)
Paternal Union Membership (PUM) 0.480*** 0.481*** 0.009 0.474*** 0.485*** 0.008 0.477*** 0.484*** 0.010
(0.067) (0.059) (0.016) (0.067) (0.059) (0.016) (0.067) (0.059) (0.016)
PUM*Blue Collar -0.544*** -0.516*** 0.189*** -0.535*** -0.523*** 0.190*** -0.540*** -0.520*** 0.190***
(0.1) (0.087) (0.023) (0.100) (0.087) (0.023) (0.100) (0.087) (0.023)
Using PUM as an IV
F-test of all instruments in each
individual equation 14.09 18.27 34.84 14.31 17.93 32.23 10.51 13.11 23.71
Angrist and Pischke F test 5.84 4.53 65.12 8.95 11.19 64.27 6.24 7.77 35.45
F-test of all instruments in all
equations jointly 21.09 20.67 15.27
Using PUM in second stage as exogenous variables
F-test of all instruments in each
individual equation 11.74 13.85 25.4 12.04 13.4 21.95 8.39 9.42 15.82
Angrist and Pischke F test 7.23 11.34 33.3 13.7 3.83 4.99 7.28 7.44 13.81
F-test of all instruments in all
equations jointly 14.44 19.87 13.70
Table 4c Instrumental variable estimates: First Stage Regressions
Corresponding Column in Table 5 1 2 3
N=8137
Daughters Paternal Schooling Maternal Schooling Log Paternal Earnings Paternal Schooling Maternal Schooling Log Paternal Earnings Paternal Schooling Maternal Schooling Log Paternal Earnings
Paternal RoSLA 0.270*** 0.076 -0.020 0.255** 0.075 -0.021
(0.104) (0.092) (0.024) (0.105) (0.092) (0.024)
Paternal MoB -0.012 -0.006 0.001 -0.010 -0.005 0.000
(0.008) (0.007) (0.002) (0.008) (0.007) (0.002)
Maternal RoSLA -0.072 0.255*** 0.029 -0.052 0.238*** 0.036
(0.103) (0.091) (0.024) (0.104) (0.091) (0.024)
Maternal MoB 0.016* -0.016** 0.005*** 0.016* -0.014** 0.006***
(0.008) (0.007) (0.002) (0.008) (0.007) (0.002)
Paternal Union Membership (PUM) 0.231*** 0.287*** 0.094*** 0.233*** 0.288*** 0.093*** 0.231*** 0.288*** 0.094***
(0.052) (0.045) (0.012) (0.052) (0.045) (0.012) (0.052) (0.045) (0.012)
F-test of all instruments in each individual
equation 8.85 16.21 21.5 8.87 15.01 23.59 6.54 10.65 14.63
Angrist and Pischke F test 9.05 5.99 8.98 4.25 18.84 9.72 4.46 7.98 7.7
F-test of all instruments in all equations
jointly 12.63 13.06 9.15
Table 4d Instrumental variable estimates: First Stage Regressions
Corresponding Column in Table 5 4, 7 5, 8 6, 9
N=8137
Daughters Paternal Schooling Maternal Schooling Log Paternal Earnings Paternal Schooling Maternal Schooling Log Paternal Earnings Paternal Schooling Maternal Schooling Log Paternal Earnings
Paternal RoSLA 0.276*** 0.082 -0.023 0.263** 0.082 -0.024
(0.104) (0.092) (0.024) (0.105) (0.092) (0.024)
Paternal MoB -0.011 -0.005 0.000 -0.009 -0.004 0.000
(0.008) (0.007) (0.002) (0.008) (0.007) (0.002)
Maternal RoSLA -0.068 0.258*** 0.028 -0.049 0.242*** 0.035
(0.103) (0.091) (0.024) (0.104) (0.091) (0.024)
Maternal MoB 0.016* -0.016** 0.005*** 0.016* -0.014** 0.006***
(0.008) (0.007) (0.002) (0.008) (0.007) (0.002)
Paternal Union
Membership
(PUM) 0.463*** 0.508*** -0.001 0.462*** 0.507*** -0.001 0.462*** 0.509*** -0.001
(0.069) (0.061) (0.016) (0.069) (0.061) (0.016) (0.069) (0.061) (0.016)
PUM*Blue Collar -0.510*** -0.496*** 0.209*** -0.504*** -0.491*** 0.209*** -0.508*** -0.495*** 0.209***
(0.102) (0.089) (0.023) (0.102) (0.090) (0.023) (0.102) (0.089) (0.023)
Using PUM as an IV
F-test of all instruments in each individual
equation 13.08 19.66 35.71 12.87 18.59 37.23 9.7 13.85 25.23
Angrist and Pischke F test 4.83 7.4 61.09 7.81 11.29 74.29 5.75 8.25 37.48
F-test of all instruments in all equations jointly 21.73 21.95 15.78
Using PUM in second stage as exogenous F-test of all instruments in each individual
equation 11.02 13.09 26.48 10.73 11.67 28.5 7.78 8.74 17.59
Angrist and Pischke F test 4.66 11.98 10.7 13.04 0.57 1.25 6.23 4.34 7.17
F-test of all instruments in all equations jointly 18.76 19.05 12.80
Table 5 Instrumental Variable Estimates: LFS 1992-2012
Specification: (1) (2) (3) (4) (5) (6) (7) (8) (9)
Instruments RoSLA RoSLA RoSLA RoSLA RoSLA RoSLA
MoB MoB MoB MoB MoB MoB
PUM PUM PUM PUM PUM PUM
PUM*Blue PUM*Blue PUM*Blue PUM*Blue PUM*Blue PUM*Blue
Second stage controls PUM PUM PUM
Blue Blue Blue Blue Blue Blue Blue Blue Blue
Sons: N=8661
Corresponding First Stage Table 4a
Left Panel Table 4a Mid Panel Table 4a Right Panel Table 4b Left Panel Mid Panel Table 4b Table 4b Right Panel Table 4b Left Panel Table 4b Mid Panel Table 4b Right Panel
Maternal School Leaving Age 2.369 -0.063 -0.013 0.003 0.023 0.011 -0.014 -0.077 -0.030
(23.721) (0.145) (0.086) (0.061) (0.044) (0.037) (0.063) (0.123) (0.045)
Paternal School Leaving Age 0.899 -0.108 0.004 0.039 0.025 0.028 -0.010 0.001 0.003
(8.668) (0.209) (0.084) (0.061) (0.043) (0.036) (0.070) (0.057) (0.040)
Paternal Log Earnings -8.237 0.766 0.281 0.162** 0.188*** 0.157** -0.029 -0.169 -0.025
(84.138) (0.866) (0.394) (0.069) (0.069) (0.066) (0.140) (0.407) (0.126)
Daughters: N=8137
Corresponding First Stage Table 4c
Left Panel Table 4c Mid Panel Table 4c Right Panel Table 4d Left Panel Mid Panel Table 4d Table 4d Right Panel Table 4d Left Panel Table 4d Mid Panel Table 4d Right Panel
Maternal School Leaving Age 0.037 -0.011 0.000 0.016 -0.008 0.001 0.024 -0.041 0.021
(0.080) (0.044) (0.039) (0.049) (0.041) (0.034) (0.057) (0.264) (0.055)
Paternal School Leaving Age 0.059 0.069 0.068 0.054 0.078* 0.070** 0.073 0.075 0.078*
(0.057) (0.082) (0.046) (0.053) (0.043) (0.035) (0.080) (0.048) (0.041)
Paternal Log Earnings -0.123 -0.004 -0.022 -0.043 -0.034 -0.031 0.030 -0.119 0.039
(0.249) (0.236) (0.153) (0.066) (0.062) (0.060) (0.232) (0.682) (0.165)
References
Acemoglu D, Pischke JS (2001) Changes in the Wage Structure, Family Income, and Children's Education. Eur Econ Rev 45 (4-6):890-904.
doi:http://www.elsevier.com/wps/find/journaldescription.cws_home/505541/descripti on#description
Almond D, Currie J (2010) Human Capital Development Before Age Five. National Bureau of Economic Research, Inc, NBER Working Papers: 15827.
doi:http://www.nber.org/papers/w15827.pdf
Angrist JD, Pischke J-S (2009) Mostly Harmless Econometrics: An Empiricist's Companion. Princeton and Oxford: Princeton University Press,
Behrman JR, Rosenzweig MR (2002) Does Increasing Women's Schooling Raise the Schooling of the Next Generation? American Economic Review 92 (1):323-334. doi:http://www.aeaweb.org/aer/
Bjorklund A, Lindahl M, Plug E (2006) The Origins of Intergenerational Associations: Lessons from Swedish Adoption Data. Quarterly Journal of Economics 121 (3):999-1028. doi:http://www.mitpressjournals.org/loi/qjec
Björklund A, Salvanes KG (2011) Chapter 3 - Education and Family Background: Mechanisms and Policies. In: Eric A. Hanushek SM, Ludger W (eds) Handbook of the Economics of Education, vol Volume 3. Elsevier, pp 201-247. doi:http://dx.doi.org/10.1016/B978-0-444-53429-3.00003-X
Black SE, Devereux PJ (2011) Chapter 16 - Recent Developments in Intergenerational Mobility. In: David C, Orley A (eds) Handbook of Labor Economics, vol Volume 4, Part B. Elsevier, pp 1487-1541. doi:http://dx.doi.org/10.1016/S0169-7218(11)02414-2
Black SE, Devereux PJ, Salvanes KG (2005) Why the Apple Doesn't Fall Far: Understanding Intergenerational Transmission of Human Capital. American Economic Review 95 (1):437-449. doi:http://www.aeaweb.org/aer/
Blanden J, Gregg P (2004) Family Income and Educational Attainment: A Review of Approaches and Evidence for Britain. Oxford Review of Economic Policy 20 (2):245-263. doi:http://oxrep.oxfordjournals.org
Cameron SV, Heckman JJ (1998) Life Cycle Schooling and Dynamic Selection Bias: Models and Evidence for Five Cohorts of American Males. Journal of Political Economy 106 (2):262-333. doi:http://www.journals.uchicago.edu/JPE/
Carneiro P, Heckman JJ (2004) Human Capital Policy. In: Heckman JJ, Krueger AB (eds) Inequality in America. MIT Press, Cambridge,
Carneiro P, Meghir C, Parey M (2007) Maternal Education, Home Environments and the Development of Children and Adolescents. C.E.P.R. Discussion Papers, CEPR Discussion Papers: 6505. doi:http://www.cepr.org/pubs/dps/DP6505.asp
Chevalier A, Harmon C, Walker I, Zhu Y (2004) Does Education Raise Productivity, or Just Reflect It? Economic Journal 114 (499):F499-517. doi:http://www.blackwellpublishing.com/journal.asp?ref=0013-0133
Chowdry H, Crawford C, Dearden L, Goodman A, Vignoles A (2010) Widening participation in higher education: analysis using linked administrative data. Institute for Fiscal Studies, IFS Working Papers: W10/04. doi:http://www.ifs.org.uk/wps/wp1004.pdf
Crawford C, Dearden L, Meghir C (2007) When You Are Born Matters. The Impact of Date of Birth on Child Cognitive Outcomes In England. CEE Discussion Paper.
Currie J, Moretti E (2003) Mother's Education and the Intergenerational Transmission of Human Capital: Evidence from College Openings. Quarterly Journal of Economics 118 (4):1495-1532. doi:http://www.mitpressjournals.org/loi/qjec
Dearden L, Emmerson C, Frayne C, Meghir C (2009) Conditional Cash Transfers and School Dropout Rates. Journal of Human Resources 44 (4):827-857. doi:http://jhr.uwpress.org/archive/
Dixon M, Gregg P, Robinson H (2013) Early, Late or Never? When does Parental Education Impact Child Outcome? IZA Discussion Paper.
Freeman RB (1994) H. G. Lewis and the Study of Union Wage Effects. Journal of Labor Economics 12 (1):143-149. doi:http://www.journals.uchicago.edu/JOLE/home.html Harmon C, Walker I (1995) Estimates of the Economic Return to Schooling for the United
Kingdom. American Economic Review 85 (5):1278-1286. doi:http://www.aeaweb.org/aer/
Heckman JJ, Masterov DV (2005) Skill Policies for Scotland. In: Coyle D, Alexander W, Ashcroft B (eds) New Wealth for Old Nations: Scotland's Economic Prospects. Princeton and Oxford: Princeton University Press, pp 119-165
Holmlund H, Lindahl M, Plug E (2008) The causal Effect of Parent's Schooling on Children's Schooling: A Comparison of Estimation Methods. IZA Discussion Paper.
Jenkins S, Schluter C (2002) The Effect of Family Income During Childhood on Later-Life Attainment: Evidence from Germany. DIW Discussion Papers.
Krueger AB (2004) Inequality, Too Much of a Good Thing. In: Heckman JJ, Krueger AB (eds) Inequality in America: What role for human capital policies? Edited with an introduction by Benjamin M. Friedman. Alvin Hansen Symposium on Public Policy series. Cambridge and London:MIT Press, pp 1-75
Lewis HG (1986) Union Relative Wage effects: A Survey. University of Chicago Press, Chicago Loken KV (2010) Family Income and Children's Education: Using the Norwegian Oil Boom as
a Natural Experiment. Labour Economics 17 (1):118-129. doi:http://www.elsevier.com/wps/find/journaldescription.cws_home/523092/descripti on#description
Lundborg P, Nordin M, Olof Rooth D (2011) The Intergnerational Transmission of Human Capital: Exploring the Role of Skills and Health Using Data on Adoptees and Twins. IZA Discussion Paper.
Maurin E, McNally S (2008) Vive la Revolution! Long-Term Educational Returns of 1968 to the Angry Students. Journal of Labor Economics 26 (1):1-33. doi:http://www.journals.uchicago.edu/JOLE/home.html
Murphy KM, Topel RH (1990) Efficiency Wages Reconsidered: Theory and Evidence. In: Weiss Y, Fishelson G (eds) Advances in the theory and measurement of unemployment. New York: St. Martin's Press, pp 204-240
Oreopoulos P, Page M, Stevens AH (2006) The Intergenerational Effects of Compulsory Schooling. Journal of Labor Economics 24 (4):729-760. doi:10.1086/506484
Page M (2006) Father's Education and Children's Human Capital: Evidence from the World War II GI Bill. University of California at Davis, Department of Economics, Working Papers. doi:http://www.econ.ucdavis.edu/working_papers/06-33.pdf
Plug E (2004) Estimating the Effect of Mother's Schooling on Children's Schooling Using a Sample of Adoptees. American Economic Review 94 (1):358-368. doi:http://www.aeaweb.org/aer/
Pronzato C (2012) An Examination of Paternal and Maternal Intergenerational Transmission of Schooling. Journal of Population Economics 25 (2):591-608. doi:http://www.springerlink.com/content/100520/
Sacerdote B (2004) What Happens When We Randomly Assign Children to Families? National Bureau of Economic Research, Inc, NBER Working Papers: 10894. doi:http://www.nber.org/papers/w10894.pdf
Sanbonmatsu L, Kling JR, Duncan GJ, Brooks-Gunn J (2006) Neighborhoods and Academic Achievement: Results from the Moving to Opportunity Experiment. Journal of Human Resources 41 (4):649-691. doi:http://jhr.uwpress.org/archive/
Shea J (2000) Does Parents' Money Matter? Journal of Public Economics 77 (2):155-184. doi:http://www.elsevier.com/locate/inca/505578/
Year
Number
Title/Author(s)
ESRI Authors/Co-authors
Italicised
2013467 SME Credit Constraints and Macroeconomic Effects
Petra Gerlach-Kristen, Brian O’Connell and Conor O’Toole
466 Transitions In and Out of Unemployment Among Young People in the Irish
Recession
Elish Kelly, Seamus McGuinness, Philip O’Connell, David Haugh and Alberto González Pandiella
465 The Impact of the Recession on the Structure and Labour Market Success
of Young NEET Individuals in Ireland
Elish Kelly and Seamus McGuinness
464 How do banking crises affect aggregate consumption?
Evidence from international crisis episodes
Petra Gerlach-Kristen, Brian O’Connell and Conor O’Toole
463 Negative Equity in the Irish Housing Market: Estimates using loan level
data
David Duffy, ESRI and Niall O’Hanlon, CSO
462 Decomposing patterns of emission intensity in the EU and China: how
much does trade matter?
Valeria Di Cosmo and Marie Hyland
461 When to invest in carbon capture and storage technology in the presence
of uncertainty: a mathematical model
D.M. Walsh, K. O’Sullivan, W.T. Lee, and M. Devine
460 The HERMES-13 macroeconomic model of the Irish economy
Adele Bergin, Thomas Conefrey, John FitzGerald, Ide Kearney and
Nuša Žnuderl
459 Smoking Outside: The Effect of the Irish Workplace Smoking Ban on
Smoking Prevalence Among the Employed
Michael Savage
458 Climate policy, interconnection and carbon leakage: the effect of
unilateral UK policy on electricity and GHG emissions in Ireland
John Curtis, Valeria Di Cosmo, Paul Deane
457 The effect of unemployment, arrears and negative equity on consumption:
Ireland in 2009/10
Petra Gerlach-Kristen
For earlier Working Papers see