QUARTERLY
ECONOMIC
COMMENTARY
SPRING
201
9
KIERAN MCQUINN
,
CONOR O'TOOLE
, MATTHEW ALLEN-COGHLAN
AND
PHILIP ECONOMIDES
ECONOMIC
FORECASTING
March
201
9
QUARTERLY ECONOMIC COMMENTARY
Kieran McQuinn
Conor O’Toole
Matthew Allen-Coghlan
Philip Economides
Spring 2019
The forecasts in this Commentary are based on data available by 14 March 2019
Draft completed on 15 March 2019
A subscription to the Quarterly Economic Commentary costs €327 per year, including VAT and postage.
© The Economic and Social Research Institute, Whitaker Square, Sir John Rogerson’s Quay, Dublin 2.
ISBN 978-0-7070-0480-8 ISSN 0376-7191
DOI https://doi.org/10.26504/qec2019spr
The Economic and Social Research Institute is an independent research institute working towards a vision of ‘Informed policy for a better Ireland’. The ESRI seeks to support sustainable economic growth and social progress in Ireland by providing a robust knowledge base capable of providing effective solutions to public policy challenges.
The Institute was founded in 1960 by a group of senior civil servants, led by Dr T.K. Whitaker, who identified the need for independent and in-depth research to support the policymaking process in Ireland. Since then, the Institute has remained committed to independent research and its work is free of any expressed ideology or political position. The Institute publishes all research reaching the appropriate academic standard, irrespective of its findings or who funds the research.
The ESRI brings together leading experts from a variety of disciplines who work together to break new ground across a number of research initiatives. The expertise of its researchers is recognised in public life and researchers are represented on the boards and advisory committees of several national and international organisations.
ESRI researchers uphold the highest academic standards. The quality of the Institute’s research output is guaranteed by a rigorous peer review process. Research is published only when it meets the required standards and practices. Research quality has also been assessed as part of two peer reviews of the Institute, in 2010 and 2016.
ESRI research findings are disseminated widely in books, journal articles and reports. Reports published by the ESRI are available to download, free of charge, from its website. ESRI staff members communicate research findings at regular conferences and seminars, which provide a platform for representatives from government, civil society and academia to discuss key findings from recently published studies and ongoing research.
The Commentary is edited by Kieran McQuinn and Conor O’Toole. Kieran McQuinn is Research Professor and Conor O’Toole is a Senior Research Officer at the Economic and Social Research Institute (ESRI). Matthew Allen-Coghlan and Philip Economides are Research Assistants at the ESRI.
Special Articles are published in the QEC in order to foster high-quality debate on
various aspects of the Irish economy and Irish economic policy. They are subject to refereeing prior to publication.
TABLE OF CONTENTS
Summary Table ... ii
National Accounts 2018, 2019, 2020 ... iii
CHAPTERS The Irish Economy – Forecast Overview ... 1
The International Economy ... 3
The Domestic Economy ... 16
General Assessment ... 60
Detailed Forecast Tables ... 63
SPECIAL ARTICLE Ireland and Brexit: modelling the impact of deal and no-deal scenarios A. Bergin, P. Economides, A. Garcia-Rodriguez and G. Murphy ... 69
SUMMARY TABLE
2016 2017 2018 2019 2020 Output (Real Annual Growth %)
Private Consumer Expenditure 4.0 1.6 3.0 2.3 2.2
Public Net Current Expenditure 3.5 3.9 6.4 6.5 5.3
Investment 51.7 -31.0 9.8 7.5 8.0
Exports 4.4 7.8 8.9 4.3 4.4
Imports 18.5 -9.4 7.0 6.3 6.1
Gross Domestic Product (GDP) 5.0 7.2 6.7 3.8 3.2
Gross National Product (GNP) 11.5 4.4 5.9 3.4 3.0
Prices (Annual Growth %)
Consumer Price Index (CPI) 0.0 0.3 0.6 1.0 1.4
Growth in Average Hourly Earnings 2.5 1.5 3.0 3.2 3.4
Labour Market
Employment Levels (ILO basis (‘000)) 2,132 2,194 2,250 2,307 2,356
Unemployment Levels (ILO basis (‘000)) 195 158 145 126 120
Unemployment Rate (as % of Labour Force) 8.4 6.7 5.7 5.2 4.8
Public Finance
General Government Balance (€bn) -1.5 -0.8 0.4 -0.9 -1.5
General Government Balance (% of GDP) -0.5 -0.4 0.1 -0.3 -0.4
General Government Debt (% of GDP) 73.4 68.4 64.7 63.1 58.3
External Trade
Balance of Payments Current Account (€bn) -11.4 24.9 29.0 17.0 12.1
Current Account (% of GNP) -5.1 10.7 11.5 6.5 4.4
Note: Detailed forecast tables are contained in an Appendix to this Commentary.
NATIONAL ACCOUNTS 2018
A: EXPENDITURE ON GROSS NATIONAL PRODUCT
2017 2018 Change in 2018
€ bn € bn Value Price Volume
Private Consumer Expenditure 99.9 104.3 4.4 1.4 3.0
Public Net Current Expenditure 29.6 32.0 8.1 1.5 6.4
Gross Fixed Capital Formation 69.0 79.4 15.1 4.8 9.8
Exports of Goods and Services 352.6 383.8 8.9 0.0 8.9
Physical Changes in Stocks 3.5 1.6
Final Demand 554.6 601.1 8.4 0.9 7.4
less:
Imports of Goods and Services 263.3 316.7 8.7 1.0 7.7
Statistical Discrepancy 2.8 1.8
GDP at Market Prices 294.1 318.5 8.3 1.5 6.7
Net Factor Payments -61.0 -66.6
GNP at Market Prices 233.1 251.8 8.0 1.9 5.9
B: GROSS NATIONAL PRODUCT BY ORIGIN
2017 2018 Change in 2018
€ bn € bn € bn %
Agriculture, Self Employed Income 3.5 3.8 0.3 9.4
Agriculture, Employee Remunerations 0.7 0.7 0.0 0.0
Non-Agriculture, Employee Remunerations 85.7 90.7 5.0 5.9
Other 113.3 118.3 5.0 4.4
Adjustments: Stock Appreciation 0.0 0.2
Statistical Discrepancy -2.8 -3.0
Net Domestic Product 250.6 271.9 21.3 8.5
Net Factor Payments -61.0 -66.6 -5.7 9.3
National Income 189.6 205.2 15.6 8.2
Depreciation 72.0 74.8 2.8 3.9
GNP at Factor Cost 261.6 280.0 18.4 7.0
Taxes less Subsidies -28.4 -28.2 0.3 -1.0
GNP at Market Prices 233.1 251.8 18.7 8.0
C: BALANCE OF PAYMENTS ON CURRENT ACCOUNT
2017 2018 Change in 2018
€ bn € bn € bn
X – M 89.3 99.5 10.2
F -59.8 -65.4 -5.6
Net Transfers -4.6 -5.1 -0.5
Balance on Current Account 24.9 29.0 4.1
as % of GNP 10.7 11.5
1
NATIONAL ACCOUNTS 2019
A: EXPENDITURE ON GROSS NATIONAL PRODUCT
2018 2019 Change in 2019
€ bn € bn Value Price Volume
Private Consumer Expenditure 104.3 108.5 4.0 1.7 2.3
Public Net Current Expenditure 32.0 35.3 10.5 3.8 6.5
Gross Fixed Capital Formation 79.4 87.4 10.0 2.4 7.5
Exports of Goods and Services 383.8 404.7 5.4 1.1 4.3
Physical Changes in Stocks 1.6 3.0
Final Demand 601.1 638.9 6.3 1.6 4.6
less:
Imports of Goods and Services 284.4 306.3 7.7 1.3 6.3
Statistical Discrepancy 1.8 -0.1
GDP at Market Prices 318.5 332.4 4.4 0.5 3.8
Net Factor Payments -66.6 -71.0
GNP at Market Prices 251.8 261.4 3.8 0.4 3.4
B: GROSS NATIONAL PRODUCT BY ORIGIN
2018 2019 Change in 2019
€ bn € bn € bn %
Agriculture, Self Employed Income 3.8 3.9 0.1 2.6
Agriculture, Employee Remunerations 0.7 0.7 0.0 0.0
Non-Agriculture, Employee Remunerations 90.7 96.2 5.5 6.1
Other 118.3 123.3 4.9 4.1
Adjustments: Stock Appreciation 0.2 0.2
Statistical Discrepancy -3.0 -3.0
Net Domestic Product 271.9 284.0 12.1 4.5
Net Factor Payments -66.6 -71.0 -4.4 6.5
National Income 205.2 213.0 7.8 3.8
Depreciation 74.8 77.5 2.7 3.6
GNP at Factor Cost 280.0 290.5 10.5 3.7
Taxes less Subsidies -28.2 -29.0 -0.9 3.1
GNP at Market Prices 251.8 261.4 9.6 3.8
C: BALANCE OF PAYMENTS ON CURRENT ACCOUNT
2018 2019 Change in 2019
€ bn € bn € bn
X – M 99.5 98.3 -1.2
F -65.4 -75.6 -10.3
Net Transfers -5.1 -5.6 -0.6
Balance on Current Account 29.0 17.0 -12.0
NATIONAL ACCOUNTS 2020
A: EXPENDITURE ON GROSS NATIONAL PRODUCT
2019 2020 Change in 2020
€ bn € bn Value Price Volume
Private Consumer Expenditure 108.5 113.0 4.1 1.9 2.2
Public Net Current Expenditure 35.3 37.6 6.5 1.1 5.3
Gross Fixed Capital Formation 87.4 97.3 11.3 2.5 8.0
Exports of Goods and Services 404.7 427.5 5.6 1.5 4.4
Physical Changes in Stocks 3.0 3.0
Final Demand 638.9 678.4 6.2 2.0 4.5
less:
Imports of Goods and Services 306.3 329.8 7.7 1.7 6.1
Statistical Discrepancy -0.1 -0.1
GDP at Market Prices 332.4 348.4 4.8 1.9 3.2
Net Factor Payments -71.0 -74.5
GNP at Market Prices 261.4 274.0 4.8 1.6 3.0
B: GROSS NATIONAL PRODUCT BY ORIGIN
2019 2020 Change in 2020
€ bn € bn € bn %
Agriculture, Self Employed Income 3.9 4.0 0.1 2.6
Agriculture, Employee Remunerations 0.7 0.7 0.0 0.0
Non-Agriculture, Employee Remunerations 96.2 101.7 5.4 5.6
Other 123.3 128.4 5.1 4.1
Adjustments: Stock Appreciation 0.2 0.2
Statistical Discrepancy -3.0 -3.0
Net Domestic Product 284.0 298.1 14.1 5.0
Net Factor Payments -71.0 -74.5 -3.5 4.9
National Income 213.0 223.7 10.7 5.0
Depreciation 77.5 80.1 2.6 3.4
GNP at Factor Cost 290.5 303.7 13.3 4.6
Taxes less Subsidies -29.0 -29.8 -0.8 2.6
GNP at Market Prices 261.4 274.0 12.5 4.8
C: BALANCE OF PAYMENTS ON CURRENT ACCOUNT
2019 2020 Change in 2020
€ bn € bn € bn
X – M 98.3 97.6 -0.7
F -75.6 -79.4 -3.7
Net Transfers -5.6 -6.1 -0.5
Balance on Current Account 17.0 12.1 -4.9
The Irish Economy – Forecast Overview
2018 saw the Irish economy register another sizeable increase in activity with GDP estimated to have risen by 6.7 per cent. While some of this increase is due to the disproportionate activities of a select number of multinational firms, the underlying performance of the economy is still remarkably strong. Increases in taxation receipts, even aside from corporation taxes and the ongoing dynamic performance of the labour market, are compelling evidence of this.
However, the present year has seen international sources of growth cool; the underlying weaknesses in the Chinese economy along with the deterioration in the trade relationship between the US and China have contributed to a reduction in the global outlook. The recovery in the Euro Area has also stalled somewhat. Inevitably, this will impact on the domestic economy, with the contribution of the trade balance to growth set to decline. These developments have led us to revise downwards our forecast of real GDP growth in 2019 from 4.2 per cent in the previous Winter Commentary to 3.8 per cent for 2019. It should be noted that all forecasts in the Commentary, unless otherwise stated, assume that the United Kingdom remains a member of the European Union.
The importance of Brexit for the Irish economy has seen the Department of Finance commission a joint research project with the ESRI to examine various different Brexit scenarios using COSMO – the structural model of the Irish economy. Other empirical work completed by researchers at the Institute (Lawless, 2016a; Lawless, 2016b; Lawless and Morgenroth, 2018)1 examining the
Brexit issue from a microeconomic persective has also been used in this exercise. The results of this analysis, which are published in a paper with the Commentary (Bergin et al., 2019), are used in the Commentary to examine the implications for the short-run growth outlook of the different scenarios. Therefore, like the previous Commentary, we produce a baseline set of forecasts under a no-Brexit scenario and complement this with a set of forecasts associated with certain Brexit outcomes.
Overall, this results in a baseline real GDP forecast of 3.8 per cent for the Irish economy in 2019 and 3.4 per cent in 2020. However, under a no-deal exit for the
1 Lawless, M. (2016a). Intermediate goods inputs and the UK content of Irish goods exports, Economic and Social Research Institute (ESRI).
Lawless, M. (2016b). ‘Irish-UK Services Trade and Brexit’, Working Paper No. WP595, Economic and Social Research Institute (ESRI).
UK with significant disruptions, Irish GDP is expected to grow by just 1.2 per cent in 2019 and 2.5 per cent in 2020.
The International Economy
The global economy appears poised for continued but slower growth in 2019 and 2020, however there are significant downside risks. Negotiations around the US-China trade dispute have intensified in Q1 2019, although no increases in tariff rates have, as yet, materialised. Furthermore, the Chinese economy is showing additional signs of economic uncertainty coming mainly through lower activity in the housing market and increased concern about domestic lending practices. These uncertainties have been incorporated into the IMF’s World Economic
Outlook as of January 2019, which revised world output growth down from 3.7 in
its October issue to 3.5 per cent for 2019.2 From a domestic perspective, these
broad-based declines in growth rates across large economies suggest a weakening of global demand for Irish exports.
The European Union continues to display signs of an economic slowdown. According to preliminary estimates of year-on-year real GDP growth, economic activity among the EU28 fell from 1.8 per cent in Q3 2018 to 1.4 per cent Q4 2018. Using the same seasonally adjusted measure, France, Germany and Italy experienced a 0.9, 0.6 and 0.1 per cent annual rise in real GDP, respectively, in Q4 2018. This is a clear sign of deteriorating economic conditions in the Euro Area. However, the European labour market remains robust: as of December 2018, EU28 unemployment fell to 6.6 per cent, ranging from a low of 2.1 per cent in the Czech Republic to a high of 18.5 per cent in Greece. The ECB has ended its asset purchases programme as of January 2019 and recently announced that rate hikes are off the table until 2020 at least due to recent weakness in economic performance. Inflation in the Euro Area averaged 2.0 per cent in Q4 2018, though price increases have moderated in the first months of 2019.
This slowdown in the Euro Area has led a number of commentators to query the underlying strength of the European recovery. Whelan (2018) suggests that the recovery to date is cyclical in nature and the recent sluggishness reflects underlying weak productivity growth and demographic factors.3 The combination
of these issues is likely to result in slow average growth rates for the Euro Area in the coming decades. Amongst the many other implications of this trend, Whelan (2018) notes that slower future growth rates are likely to lead to the ECB setting lower interest rates in the future which are likely to be lower than average rates during the pre-crisis era. With Irish growth rates set to exceed those of the Euro
2 International Monetary Fund (2019). World Economic Outlook: A Weakening Global Expansion, Washington, D.C.: International Monetary Fund, January 2019.
Area over the short to medium term, domestic policymakers cannot expect monetary policy at the European level to ‘lean against the wind’ in terms of cooling demand-side pressures in the Irish economy. In this context, the use of countercyclical tools for both fiscal policy and macro-prudential policy will be critical in preventing any overheating which may occur.
[image:15.595.79.523.342.563.2]As highlighted in Figure 1, real GDP growth in the UK had been trending downwards since well before the EU withdrawal referendum. Using measures of gross value added as a proxy for monthly changes in GDP, the ONS has highlighted a sudden loss of activity in both the production and manufacturing sectors. In Q4 2018, production contracted by 1 per cent while manufacturing contracted by 1.5 per cent relative to the same period last year. However, unemployment has continued to remain low throughout the year and is estimated to be 4.0 per cent in December 2018.
FIGURE 1 KEY UK ECONOMIC INDICATORS, YEAR-ON-YEAR CHANGE (%)
Sources: ONS, gross domestic product, percentage change, latest quarter on corresponding quarter of previous year (LHS); ONS,monthly GDP based on GVA (Gross Value Added), percentage change, latest three months on same three months a year ago (RHS).
As the key withdrawal date of 29 March approaches, much of the impact of Brexit already experienced by the UK economy has centred on exchange rate developments and slowdowns in investment activity. Between Q2 2016 and Q4 2018, the Pound lost 11.3 per cent of its value against the Euro. As displayed in Figure 2, the real economy experienced a broad-based disinvestment in Q4 2018. Among UK financial institutions, historically high levels of disinvestment have resulted in a net outflow of £26 billion worth of assets across the first three quarters of 2018. While developments in the real economy and financial markets are not always entirely correlated, both items appear to signal the recent manifestation of major uncertainty.
FIGURE 2 UK BUSINESS INVESTMENT YEAR-ON-YEAR GROWTH (%) AND UK FINANCIAL INSTITUTION NET INVESTMENT (£ BILLION)
Source: ONS,Business investment real-time database (LHS), ONS, Investment by insurance companies, pension funds and trusts (RHS).
Note: *Net investment for 2018 captures the first three quarters of 2018 and hence is not an annual figure.
As Breinlich et al. (2019) conclude, signs of UK firms offshoring production to the EU are already present and can be expected to accelerate should there be increased barriers to trade and migration introduced in April 2019.4 A number of
studies have assessed the long-term effects of Brexit on the UK economy; predictions for a ‘soft’ Brexit in the form of a free trade agreement averages a 3.7 per cent fall in GDP relative to the baseline scenario of ‘remain’, whereas a ‘hard’ Brexit involving defaulting to WTO tariff rates averages a 6.0 per cent decline (Bergin et al., 2019). Given the uncertainty around Brexit, the ESRI undertook joint research with the Department of Finance to consider the economic implications of different Brexit scenarios. These are summarised in a paper included in the Commentary and the impacts for the short-term forecasts of the Irish economy are summarised in Box 1.5
The US economy grew at an annual rate of 3.5 per cent in Q3 2018. Personal consumption contributed 2.7 percentage points towards this increase. As of October 2018, the US unemployment rate declined to 3.7 per cent. Growth rates in Q4 2018 and Q1 2019 are expected to be slightly weakened by the recent government shutdown. Estimates indicate this is likely to amount to a 0.65 percentage point reduction in economic growth in Q1 2019.6 As was widely
anticipated, the Federal Reserve raised the official US interest rate to a range of
4 Breinlich, H., E. Leromain, D. Novy and T. Sampson (2019). ‘Voting with their Money: Brexit and Outward Investment by UK Firms’, Centre for Economic Performance, the London School of Economics and Political Science.
5 Bergin, A., P. Economides, A. Garcia-Rodriguez and G. Murphy (2019). ‘Ireland and Brexit: modelling the impact of deal and no-deal scenarios’, Quarterly Economic Commentary Spring 2019, Special Article.
6 According to the White House Council of Economic Advisors, each week of the shutdown was estimated to result in a 0.13 percentage point reduction in quarterly economic growth. This shutdown saw a record high of 35 days in length. -10.0 -5.0 0.0 5.0 10.0 15.0 20.0 25.0 20 13 Q4 20 14 Q2 20 14 Q4 20 15 Q2 20 15 Q4 20 16 Q2 20 16 Q4 20 17 Q2 20 17 Q4 20 18 Q2 20 18 Q4
Machinery & Equipment Dwellings Total GFCF -40 -20 0 20 40 60 80 100 19 88 19 90 19 92 19 94 19 96 19 98 20 00 20 02 20 04 20 06 20 08 20 10 20 12 20 14 20 16 * 2018
2.25 to 2.5 per cent in December 2018. Given the US treasury yield curve’s tepid response to ongoing monetary policy measures, balance sheet reductions of $50 billion in securities are expected to continue with less frequent adjustments being made to the official interest rate.
[image:17.595.71.526.340.612.2]The trade balance for the US weakened in the latter half of 2018, with a 4 per cent year-on-year decline in goods exports and a 7 per cent increase in goods imports. Between January and November, the overall US trade deficit in 2018 increased by 9 per cent relative to the same period last year. Following the implementation of bilateral trade tariffs with China between July and September, Figure 3 highlights a significant decline in US exports contributing to this trade balance effect. These frictions in US-China trade have contributed to an 11 per cent rise in the trade deficit between January and November of 2018 relative to the same period last year.
FIGURE 3 US-CHINA SEASONALLY ADJUSTED IMPORTS AND EXPORTS, Y-O-Y GROWTH (%)
Source: United States Census Bureau, US Export and Import data for goods.
Real GDP in China grew year-on-year by 6.6 per cent in 2018, down from 6.8 per cent in 2017. Though the risk of increased tariff rates has been postponed, the economy is still struggling to cope with the burden of imposed restrictions both on the banking system and housing market.7 As previously noted in the Winter Commentary, the moderation observed in Chinese real estate prices in recent
7 In October 2018, the Reserve Bank of Australia’s Financial Stability Review noted that these policy measures have attempted to reduce indirect lending in the non-bank sector, simplify complex interconnections within the financial system, and reduce high levels of corporate leverage.
-50 -40 -30 -20 -10 0 10 20 30
months comes as price caps on new apartments and limitations on the resale of real estate purchases are introduced.
Real GDP in Japan remained flat year-on-year for Q4 2018, following further declines in net exports and private residential investment. As of August 2018, final estimates suggest there has been a 9.1 per cent decline in the size of the working population over the past ten years. Among others factors, this lessens the prospect of sustained growth in Japan. With gaps continuing to widen in the labour market, there are now an estimated 16 jobs available for every ten individuals seeking employment. Unemployment remains fixed at 2.3 per cent while weak economic activity has resulted in persistently low inflation.
Developments in oil prices
As displayed in Figure 4, trends in global oil prices reversed following October 2018. Between this period and January 2019, average oil prices have fallen by approximately 27 per cent for both Brent crude and WTI crude. This is likely the result of a slowdown in global demand and continued increases in US shale-oil production over the past year. OPEC has responded to such trends by requesting cutbacks in oil production among members. Though the majority of members have not adhered to such cutbacks, continued low levels of supply from Angola and Venezuela are allowing OPEC to meet targets on an aggregate level. Non-OPEC members however, such as Russia and Kazakhstan, have responded by increasing production to near record levels. From an Irish perspective, given the economic reliance on imported fossil fuels, low oil prices may lead to an extended period of low inflation and lower pressures on household expenses.
FIGURE 4 CRUDE OIL PRICES, NOT SEASONALLY ADJUSTED ($ PER BARREL)
Sources: Federal Reserve Bank of St. Louis.
0 20 40 60 80 100 120 140 20 13- 01-01 20 13- 04-01 20 13- 07-01 20 13- 10-01 20 14- 01-01 20 14- 04-01 20 14- 07-01 20 14- 10-01 20 15- 01-01 20 15- 04-01 20 15- 07-01 20 15- 10-01 20 16- 01-01 20 16- 04-01 20 16- 07-01 20 16- 10-01 20 17- 01-01 20 17- 04-01 20 17- 07-01 20 17- 10-01 20 18- 01-01 20 18- 04-01 20 18- 07-01 20 18- 10-01 20 19- 01-01
Figure 5 summarises the forecasts for GDP growth produced by the major institutions of their respective economies. Each forecast for 2018 signals minimum and maximum forecasts with point values identifying the median of forecasts. These forecasts signal a broad-based expectation of a moderation in economic growth across the majority of developed economies.
FIGURE 5 REAL GDP GROWTH (% CHANGE, YEAR-ON-YEAR)
Euro Area United States United Kingdom
Sources: FocusEconomics, IMF, OECD, HM Treasury and Federal Reserve.
I
MPLICATIONS FORI
RISHE
XPORTS,
I
MPORTS AND THEB
ALANCE OFP
AYMENTSGoods
Trade continues to drive economic growth in the Irish economy. As denoted in Figure 6, goods trade in Q4 2018 saw exports grow at an annual rate of 7.9 per cent while imports increased by 23.3 per cent. Over the past four quarters, for every €1 worth of goods imported to Ireland, the economy exported €2.33 worth of goods.
-2 -1 0 1 2 3 4
-2 -1 0 1 2 3 4
FIGURE 6 ANNUAL GROWTH RATE (%) IN TOTAL IRISH EXPORTS AND IMPORTS OF GOODS
Source: Central Statistics Office.
Note: Export and Import growth rates feature on the LHS whereas € million changes in trade are highlighted by the RHS.
While these traded goods are owned by Irish resident firms, some of these goods may never physically cross the Irish border. When examining the trade of goods, foreign-owned Irish resident firm activities such as processing and merchanting must be taken into account.8 Cross-border trade captured through monthly
merchandise-related trade statistics excludes the trade of ownership goods (e.g. contract manufacturing, merchanting). Comparing cross-border trade with the overall trade of goods enhances understanding of domestic exporter activity.9
In Q4 2018, seasonally adjusted cross-border imports of goods increased by 15 per cent relative to the same period the previous year. Exports increased by 22 per cent, driven largely by continued growth in demand for medicinal and pharmaceutical products. Figure 7 highlights significant contributions to the trade balance leading to an annual increase in the trade surplus of 26 per cent (€10.4 billion) in 2018.
8 ‘Goods for processing’ is dominated by ‘Contract Manufacturing’, a process in which multinational companies residing in Ireland issue contracts to foreign firms to produce goods. Although these goods never enter the Irish economy, due to ownership of these goods pertaining to Irish resident firms, sales are recorded as an Irish export. ‘Merchanting’ consists of the buying and selling of completed goods abroad which at no stage enter or leave Ireland. 9 For further details on ownership trade, see CSO document ‘Explaining Goods Exports and Imports 2012-2016’.
-5,000 5,000 10,000 15,000 20,000
-20 -10 0 10 20 30 40 50 60 70
FIGURE 7 ANNUAL GROWTH RATE (%) IN CROSS-BORDER IRISH EXPORTS AND IMPORTS
Source: Central Statistics Office.
However, as displayed in Table 1, exports have declined in the Food industry, in Machinery and transport equipment and for commodities related to Animal and vegetable oils, fats and waxes. The overall improvement in exports of €17.8 billion was largely due to the €18 billion improvement in the export of Chemicals and related products. Excluding such products results in residual exports declining between 2017 and 2018 by 0.3 per cent.
TABLE 1 ANNUAL CHANGE IN IRISH EXPORTS BY COMMODITY
2017 2018 €bn % Change
Net Exports of Cross Border Goods 122.8 140.6 17.8 14
Food and live animals 11.4 11.1 -0.3 -2 Beverages and tobacco 1.4 1.4 0.1 5 Crude materials, inedible, except fuels 1.8 1.9 0.1 6 Mineral fuels, lubricants and related materials 1.0 1.2 0.2 21 Animal and vegetable oils, fats and waxes 0.1 0.1 0.0 -28
Chemicals and related products 67.8 85.8 18.0 26
Manufactured goods classified chiefly by material 2.3 2.3 0.0 1 Machinery and transport equipment 21.2 19.8 -1.4 -6 Miscellaneous manufactured articles 14.9 15.7 0.8 6 Other items 1.0 1.1 0.1 18
Net Exports less Chemical Products 54.9 54.7 -0.1 -0.3
Source: Central Statistics Office and QEC author calculations.
-2,400 -1,600 -800 800 1,600 2,400 3,200 4,000 4,800 5,600
-15 -10 -5 0 5 10 15 20 25 30 35
Given the vulnerability of the domestic agricultural sector to Brexit, it is worth examining trade in this sector in more detail. Figure 8 splits food trade into two major sub-components. In mid-2017, a spike in exports of dairy and egg products occurred, likely due to CAP quota changes. Given this large increase in exports in overall food exports in 2017, it is difficult to ascertain how strongly recent uncertainty to do with Brexit has impacted the agri-food sector. Examining food on a country basis, both the UK and EU contributed towards modest growth in Irish food exports whereas remainder of the world’s demand for Irish food exports declined in value by 15.2 per cent between 2017 and 2018.
FIGURE 8 ANNUAL GROWTH RATE (%) IN CROSS-BORDER FOOD EXPORTS
Source: Central Statistics Office.
The various components of cross-border trade are not available on a seasonally adjusted basis. In Q4 2018, total cross-border imports of goods by this measure rose year-on-year by 18.2 per cent (15.0 per cent when seasonally adjusted). Between 2017 and 2018, Machinery and transport equipment products and Chemicals products represented 42 and 22 per cent of total imports, respectively. Machinery imports increased by 7 per cent and Chemicals by 13 per cent for the same period.
Relative to 2017, Ireland’s trade deficit with the UK increased by 35 per cent to €4.3 billion. While trade in chemical products with the UK fell significantly, imports from Europe and exports to the US have grown by 82 per cent and 39 per
-20 -10 0 10 20 30 40 50 60 70
cent, respectively. These, among other improvements, have caused Ireland’s trade surplus with the EU27 to increase by €1.7 billion while the surplus with the US increased by €6.4 billion (89 per cent of the overall trade surplus). Table 2 details changes in exports and imports between Ireland and other trading regions in 2018.
TABLE 2 JANUARY-DECEMBER ANNUAL CHANGE (%) IN GOODS EXPORTS AND IMPORTS
Exports % of Total
Exports Imports
% of Total Imports
Total – UK -3 10 5 20
Food and live animals 2 3 5 4 Chemicals and related products -15 3 -12 3 Machinery and transport equipment -7 2 8 4 Miscellaneous manufactured articles 5 1 4 3
Total – Rest of EU 18 40 23 40
Food and live animals 3 3 6 4 Chemicals and related products 31 26 82 11 Machinery and transport equipment -12 5 10 18 Miscellaneous manufactured articles 5 4 4 2
Total – US 18 28 -4 18
Food and live animals -34 < 1 26 < 1 Chemicals and related products 39 20 -42 4 Machinery and transport equipment -40 2 19 11 Miscellaneous manufactured articles 7 <1 0 1
Source: Central Statistics Office.
Services
FIGURE 9 ANNUAL GROWTH RATE (%) IN IRISH SERVICE EXPORTS AND IMPORTS
Source: Central Statistics Office.
Exports of computer services accounted for 46 per cent of total service exports in Q4 2018, increasing by 29.1 per cent relative to the same period last year. Royalties and licenses and business services formed 76 per cent of services imports in Q3 2018. These components experienced annual growth in Q4 2018 of 17.8 and 14.4 per cent respectively, as reflected in Figure 10. As a component of ‘business services’, imports of research and development services experienced the largest annual increase, rising by 120 per cent in Q4 2018 relative to the same period last year.
-15,000 -12,000 -9,000 -6,000 -3,000 3,000 6,000 9,000 12,000 15,000 18,000 21,000
-50 -40 -30 -20 -10 0 10 20 30 40 50 60 70
FIGURE 10 EXPORTS AND IMPORTS OF SERVICES (€ MILLION)
Source: Central Statistics Office.
Trade Balance
The value of goods and service exports in Q4 2018 increased at an annual rate of 9.3 per cent to €101 billion while imports increased by 22.3 per cent to €84 billion. This resulted in a €17 billion contribution to the Irish trade surplus, accounting for 21 per cent of nominal GDP in Q4 2018. Comparing cross-border trade with National Accounts data reveals estimates of ownership trade in the overall trade balance. Figure 11 highlights these differences, facilitating the assessment of domestic trade activity and Ireland’s international competitiveness over the past ten years. Due to the inclusion of ownership trade, a domestic trade surplus in Q4 2018 of €8 billion increases to €23 billion.
10,000 20,000 30,000 40,000 50,000 60,000
Imports, Total Imports, Royalties/licences Imports, Business services Exports, Total
FIGURE 11 CROSS-BORDER AND ADJUSTED NET EXPORTS OF GOODS AND SERVICES (€ MILLION)
Source: Central Statistics Office, QEC calculations.
Note: Adjustment to net trade accounts for ownership trade of goods. This includes, but is not limited to, forms of goods for processing such as contract manufacturing, and merchanting, i.e. purchase and resale of goods which do not enter the merchant’s economy.
Due to the volatile nature of ownership trade in goods as well as services, forecasts in the Commentary continue to be based on trends in trade patterns linked to underlying Irish economic activity. Consequently, we expect export growth of 4.3 per cent and 4.4 per cent in 2019 and 2020 respectively. Imports are expected to increase by 7.5 per cent in 2019 and 8 per cent the following year. The year-end current account is expected to reach €17 billion (6.5 per cent of GNP) in 2019 before falling somewhat to €12.1 billion (4.4 per cent of GNP) in 2020.
Given the uncertainty concerning Brexit, based on the results in Bergin et al. (2019), we present different a range of forecasts for the short-term trade outlook for the Irish economy in Box 1, Table B.10
10 Bergin, A., P. Economides, A. Garcia-Rodriguez and G. Murphy (2019). ‘Ireland and Brexit: modelling the impact of deal and no-deal scenarios’, Quarterly Economic Commentary Spring 2019, Special Article.
-6,000 6,000 12,000 18,000 24,000 30,000
The Domestic Economy
O
UTPUTThe domestic section of the Commentary is organised as follows; we initially review the outlook for output growth before discussing developments in the Irish monetary and financial sectors as well as developments in inflation. Demand-side factors such as consumption and housing market issues are then discussed. On the supply side, we then examine developments in investment and the labour market before concluding with an analysis of the public finances.
Given the ongoing uncertainty concerning the impact of Brexit on the Irish economy, the Department of Finance worked with researchers at the ESRI to examine the issue in some detail. This was mainly accomplished through use of COSMO – a structural model of the Irish economy. However, other empirical work by researchers at the Institute was also used. The results are presented in a paper to the present Commentary (Bergin et al., 2019). In Box 1, we use this work to assess the implications for the short-term growth rate of the economy under certain Brexit scenarios
BOX 1 A REASSESSMENT OF THE IMPACTS OF DIFFERENT BREXIT TYPE SCENARIOS ON THE
SHORT-TERM FORECAST OF THE IRISH ECONOMY
As a significant body of work has been recently completed by researchers in the ESRI examining the potential impact of Brexit on the Irish economy, in this Box we update the analysis presented in the last Commentary. Therefore, we examine the implications for the short-run outlook of the Irish economy of different Brexit scenarios. In Bergin et al. (2019) the specifics of the scenarios are outlined in detail. These scenarios are compared with a baseline scenario where the UK is assumed to remain part of the European Union.
Similar to previous exercises, the COSMO model links to an international network of models – in particular ‘NiGEM’ at the National Institute for Economic Research (NIESR) in the UK. However, the exercise also draws on more detailed micro-level research conducted on the Brexit issue in Lawless and Morgenroth (2016), Lawless (2018a) and Lawless (2018b). This work supplements the macro-level analysis with detailed information on the trading relationships between Ireland and the UK and between both countries and the rest of the EU.
Along with the two different ‘no-deal’ scenarios presented in Bergin et al. (2019), one scenario is based on the intended outcome of the Withdrawal Agreement achieved between the EU and the British Government in late 2018. The Withdrawal Agreement assumes a transition period of effective EU membership in the short run between the UK and the EU before a free trade agreement is established thereafter.
Table A summarises the impacts on the domestic economy of the different scenarios over the next ten years. These impacts are measured as percentage deviations from a baseline scenario where the UK continues to remain a member of the European Union. This impact of deviations from the baseline scenario is greatest in the case of ‘no-deal’ outcomes. In COSMO, the shock is transmitted to the Irish economy through the traded sector. Overall, in all cases there is a significant reduction in foreign demand which lowers the volume of output in the traded sector and exports over the medium to long-run below their baseline values. This fall in output results in labour demand being below the baseline level, which leads to lower employment and higher unemployment rates.
TABLE A THE IMPACTS OF BREXIT ON THE IRISH ECONOMY OVER THE LONG TERM (TEN YEARS LATER)
Scenario % Deviation from Baseline GDP
Withdrawal Agreement (FTA) -2.6
No-Deal -4.8
Disorderly No-Deal -5.0
By ten years, the results are almost identical under both ‘no-deal’ scenarios; this is because the main difference between both scenarios has to do with disruptions over the progression to WTO trade arrangements in the short term. These differences have mostly dissipated by 2027. In both cases real Irish GDP is down by approximately 5 per cent relative to the baseline. In contrast, the Withdrawal Agreement results in Irish output levels being 2.6 per cent below the baseline level for the same period.
As with the results in the last Commentary, these longer-term results from the econometric analysis are now related to shorter-term forecasts of the Irish economy. Initially, we focus on the implications of the results in Bergin et al. (2019) on the short-run forecasts of trade activity in the Irish economy. Table B presents forecasted rates of growth in exports and imports under the various Brexit scenarios.
TABLE B THE IMPACTS OF BREXIT ON THE SHORTER-TERM COMMENTARY TRADE FORECASTS
Scenario 2019 2020
Baseline
Exports 4.3 4.4 Imports 6.3 6.1
No-Deal
Exports 3.6 2.5 Imports 5.8 4.3
Disorderly No-Deal
Exports 0.9 3.1 Imports 3.5 4.6
Under the status quo of continued UK membership, the Commentary anticipates 4.3 per cent export growth in 2019 and 4.4 per cent growth in 2020. For imports of goods and services, a 6.3 per cent rise is expected in 2019 followed by a 6.1 per cent increase in 2020. Under a ‘No-Deal’ scenario, exports are now estimated to grow by 3.6 per cent in 2019 and 2.5 in 2020. Imports are forecasted to grow by 5.8 per cent in 2019 and 4.3 per cent in 2020. Under a ‘Disorderly No-Deal’ scenario, exports only increase by 0.9 per cent in 2019 and 3.1 per cent in 2020. Imports would grow by 3.5 and 4.6 per cent in 2019 and 2020 respectively, under such a scenario. It should be acknowledged that greater orders of disruption could occur. Lawless and Morgenroth (2017) suggests 53 per cent of Irish trade volumes are transported to or through the UK. Thus any significant landbridge frictions pose the risk of significantly limiting Irish trade performance and international competitiveness.11
In Table C, the impacts of the Brexit scenarios are examined in terms of the headline short-term GDP forecast for the Irish economy.
TABLE C THE IMPACTS OF BREXIT ON THE SHORTER-TERM COMMENTARY GDP FORECASTS
Scenario Year % Growth Rate 2019/2018
Baseline 2019 3.8 Baseline 2020 3.2
Disorderly No-Deal 2019 1.2
Disorderly No-Deal 2020 2.4
In all cases the Irish economy is expected to grow in the short to medium term; under the ‘Disorderly No-Deal’, however, output is only expected to increase by 1.2 per cent in the present year and 2.4 per cent in 2020. This compares with a baseline, no-Brexit case, of output growth of 3.8 and 3.2 per cent respectively for both years. It must be noted that this methodology does not include any major disruptions to financial markets or transport links that may occur under a hard no-deal scenario. These factors, if they were to occur, would almost certainly worsen the impact on Ireland.
References:
Bergin, A., P. Economides, A. Garcia-Rodriguez and G. Murphy (2019). ‘Ireland and Brexit: modelling the impact of deal and no-deal scenarios’, Quarterly Economic Commentary Spring 2019, Special Article.
Lawless, M., 2016a. Intermediate goods inputs and the UK content of Irish goods exports, Economic and Social Research Institute (ESRI).
Lawless, M., 2016b. ‘Irish-UK services trade and Brexit’, Working Paper No. WP595, Economic and Social Research Institute (ESRI).
Lawless, M. and E. Morgenroth, 2018. ‘Brexit and Irish consumers’, Quarterly Economic
Commentary: Special Article, Economic and Social Research Institute (ESRI).
This Box was prepared by Philip Economides and Kieran McQuinn.
M
ONETARY ANDF
INANCIALC
ONDITIONSInternational monetary environment
In its October assessment of the international financial environment, the IMF noted that financial conditions in advanced economies remained accommodative, with tightening conditions in emerging economies. However, they highlighted an increase in both immediate and medium-term risks arising from both monetary policy normalisation and trade tensions. They also noted that the degree to which policy rate increases and trade developments impact growth prospects critically depends on their impact on asset valuations and economic fundamentals.
In recent months, global volatility has increased as documented by the CBOE VIX (Volatility Index)12 presented in Figure 12. This is likely driven by both Brexit
concerns as well as global trade issues.
FIGURE 12 VIX VOLATILITY INDEX (%)
Source: St Louis Fed Database, from Chicago Board Options Exchange.
In the Euro Area, the continued operation of accommodative monetary policy through record low policy rates provides a stabilising backstop for financial markets. The worsening outlook for the European economy, as well as reduced inflation rates, have lessened the likelihood of a policy rate hike by the ECB in 2019. Extraordinary monetary policy measures, primarily in the form of quantitative easing, have been wound down but remain part of the toolkit if economic fundamentals deteriorate considerably. Figure 13 presents the EONIA rate, which continues to be negative in line with the policy rate stance.
FIGURE 13 EURO OVERNIGHT INDEX AVERAGE, EONIA (%)
Source: European Central Bank, Statistical Data Warehouse.
0 5 10 15 20 25 30 35 40 45
08-2013 03-2014 10-2014 05-2015 12-2015 07-2016 02-2017 09-2017 04-2018
Low policy rates in the Euro Area, as well as the sovereign asset purchase programme, have ensured that government bond yields have remained low for the past number of years. For Ireland, this has been particularly fortuitous given the highly indebted nature of the sovereign. Figure 14 presents the ten-year government bond yield for Ireland and selected other advanced economies. Irish bond yields have remained low throughout 2018 (sitting below UK and US levels). As rates will likely rise in the medium term, continued action to reduce the level of government indebtedness is critical in ensuring long-term fiscal sustainability.
An open question under any monetary policy normalisation scenario is the level to which the policy rate may rise. Before the crisis, policy rates hovered at between 4 and 5 per cent. Recent research by Whelan (2018) notes that, for the Eurozone as a whole, demographic and productivity factors may lead to lower long-term growth rates in the coming years. This may lead to a reappraisal of what is the long-term ‘neutral’ real rate of interest for the European economy, the interest rate which allows the economy to grow at its potential level. If potential output growth is lower, this may lead to lower real interest rates in the medium term. For Ireland, this would be beneficial given the high debt levels. However, as Irish potential output growth is likely to be higher than the Eurozone average, it means that the real interest rate maybe be stimulatory and not ‘neutral’ from an Irish economic perspective.
FIGURE 14 TEN-YEAR GOVERNMENT BOND YIELD (%)
Source: St. Louis Fed. database.
-2 0 2 4 6 8 10 12 14 01 -20 04 08 -20 04 03 -20 05 10 -20 05 05 -20 06 12 -20 06 07 -20 07 02 -20 08 09 -20 08 04 -20 09 11 -20 09 06 -20 10 01 -20 11 08 -20 11 03 -20 12 10 -20 12 05 -20 13 12 -20 13 07 -20 14 02 -20 15 09 -20 15 04 -20 16 11 -20 16 06 -20 17 01 -20 18 08 -20 18
Household Credit and Mortgage Market
Credit flows to the household sector are important in terms of financing consumption and housing investment but they must be closely monitored for emerging financial stability risks. Figure 15 presents the growth rates of credit to households from Irish resident credit institutions.13 The data are split by loans for
house purchase and other personal loans (auto finance, credit cards, student loans etc.). On an annualised basis, outstanding mortgage lending grew by 1 per cent to Q3 2018, a marginal increase on the previous quarter. Non-mortgage credit also continued to expand in Q3 2018 at an annualised rate of 0.2 per cent.
FIGURE 15 GROWTH RATES OF CREDIT TO HOUSEHOLDS (%)
Source: Central Bank of Ireland, Credit, Money and Banking Statistics.
Notes: Data are taken from Central Bank of Ireland data release A.18, Growth rates series codes 777 and 1,252.
An important measure of the sustainability of activity in the mortgage market is the payment arrears rate. As of Q3 2018, the share of principal dwelling home (PDH) loans in arrears stood at 6.2 per cent, down marginally on the previous quarter and down from 7.0 per cent in Q3 2017. This constitutes a total of 9.4 per cent of the balance of outstanding PDH mortgages. The default rate on buy-to-let (BTL) loans has also reduced but remains at 14.7 per cent of accounts. For the most recent quarter, the rate of decline in arrears appears to have stalled, in particular for BTLs. Given the continued economic buoyancy over this period, it is likely the remaining stock of outstanding defaulted loans are long-term problem cases carried over from the boom. These cases will likely require financial restructuring or legal resolutions and are unlikely to be resolved by economic developments over time. For the Irish financial sector to fully recover from the
13 See CBI for details.
-20 -10 0 10 20 30 40 20 05Q1 20 05Q3 20 06Q1 20 06Q3 20 07Q1 20 07Q3 20 08Q1 20 08Q3 20 09Q1 20 09Q3 20 10Q1 20 10Q3 20 11Q1 20 11Q3 20 12Q1 20 12Q3 20 13Q1 20 13Q3 20 14Q1 20 14Q3 20 15Q1 20 15 Q3 20 16Q1 20 16Q3 20 17 Q1 20 17Q3 20 18Q1 20 18Q3
international financial crisis, the issue of non-performing loans must be fully dealt with.
The risk to the mortgage market of heightened ECB policy rates is addressed in a Special Article accompanying this Commentary. Fahy et al. (2019) use household microdata to assess the ability of households to absorb the higher mortgage payments that would arise from increases in the policy rate.14 They find that a
100 basis point increase in the policy rate would lead to a 50 basis point increase in new arrears flows, based on a measure of missed payments due to financial distress.15 The economy would appear to be in a better position now to absorb
such a shock given the improvements in labour markets observed during the recovery while the mortgage market also appears to have become more resilient over time.
FIGURE 16 IRISH HOUSEHOLD MORTGAGE ACCOUNTS IN ARREARS BY TYPE OF LOAN (%)
Source: Central Bank of Ireland, Mortgage Arrears Statistics.
Notes: PDH refers to principal dwelling houses loans while BTL are buy-to-let loans. Loans are defined in arrears if they are greater than 90 days past due on their payments.
Focusing on new mortgage lending, a total of €8.7 billion worth of new loans were drawn down in 2018. This represents a considerable increase on the 2017 total of €7.25 billion and is the highest level of new lending since 2009. In terms of the number of loans, over 40,000 new loans were originated in 2018. This represents a sizeable increase from 32,000 in 2017.
14 M. Fahy, C. O’Toole and R. Slaymaker (2018). ‘The financial crisis and the changing profile of mortgage arrears in Ireland’, Quarterly Economic Commentary, Winter 2018, Research Notes.
15 The official definition of default as per the Basel criteria is 90 days past due.
FIGURE 17 TOTAL NEW MORTGAGE LENDING 2005-2018 (€ MILLION)
Source: Banking and Payments Federation Ireland.
Note: Number of loans (LHS), Value of Lending € million (RHS).
Given that credit availability tends to follow the economic cycle, it is critical to understand whether increases in lending are linked to economic fundamentals (such as income and population growth). In Figure 18, we present the growth in mortgage lending (value terms) and the growth rate in household income. It is clear that mortgage lending, at circa 20 per cent growth per annum, is fast outstripping income growth. However, the degree to which this indicates a financial stability risk depends on a) the credit conditions underlying the individual loans and b) the aggregate repayment capacity of the sector. In terms of the former factor, the macro-prudential framework deployed by the Central Bank in 2015 seeks to ensure that the credit conditions underlying the individual loans remain prudent. Recent research by McCann and Ryan (2016)16 indicates
that this framework has improved the credit risk of new Irish loans.
In terms of the repayment capacity, in a similar vein to Keenan and O’Brien (2018) we explore the trends in the ratio of new mortgage lending to net household disposable income on an aggregate basis (also in Figure 18 on the right hand axis).17 If mortgage lending increases relative to personal disposable
income, this can indicate the sector is leveraging beyond a sustainable level. Indeed, in 2006, new mortgage lending accounted for nearly 50 per cent of total household personal net disposable income in Ireland. While there have been
16 McCann, F. and E. Ryan (2016). ‘Originating Loan to Value ratios and the resilience of mortgage portfolios’, Economic Letters, No 10/EL/16, Dublin: Central Bank of Ireland.
17 Keenan, E., and M. O’Brien (2018). ‘New Mortgage Lending Activity in a Comparative Context’, Economic Letters, No 8/EL/18, Dublin: Central Bank of Ireland.
0 5,000 10,000 15,000 20,000 25,000 30,000 35,000 40,000 45,000
0 50,000 100,000 150,000 200,000 250,000
increases more recently in this ratio for Ireland, it stands at just over 10 per cent as of 2018, which is well below the figures seen during the credit boom period.
FIGURE 18 LENDING GROWTH, INCOME GROWTH (LHS) AND NEW LENDING TO NET DISPOSABLE INCOME (RHS) (%)
Source: New Lending Data from Banking and Payments Federation Ireland. Net disposable income of households – ESA code (B.6n_S1M) from CSO Annual National Accounts.
Note: Net disposable income for 2018 has been grown forward from 2017 by 4.8 per cent in line with QEC forecasts for personal disposable income.
Finally, to examine current household credit demand and supply conditions in Ireland in more detail, we outline recently collated survey data by the ESRI which capture information on applications and rejections for credit across a range of products. In Figure 19, we present the average application rate across mortgage loans, car loans, personal loans and credit cards for 2018 as well as the average rejection rate for those households who applied. The figures indicate that approximately 4 per cent of Irish households applied for a mortgage in 2018, 8 per cent applied for a car loan, 7 per cent for a personal loan and less than 2 per cent for a credit card. In terms of loan success, nearly 30 per cent of mortgage applications were rejected. This is higher than the other loan types and indicates the more intrusive screening that takes place for long-term home purchase finance relative to other credit transactions. The rejection rate was just over 6 per cent for car finance, over 11 per cent for personal loans and nearly 15 per cent for credit cards.
0% 10% 20% 30% 40% 50% 60%
-80% -60% -40% -20% 0% 20% 40% 60% 80%
FIGURE 19 HOUSEHOLD CREDIT DEMAND AND SUPPLY – ESRI SURVEY EVIDENCE – 2018 (%)
Source: ESRI Economic Sentiment Monitor.
Trends in SME and corporate credit market
A sufficient supply of credit to SMEs is critical in ensuring enterprises can manage day-to-day operations such as supply chain and inventory organisation. It also helps firms deploy capital for long-term productivity enhancing investments.
Figure 20 presents new lending to SMEs for the first three quarters of the year over the period 2011 to 2018. New lending has been increasing steadily in each year from 2015 onwards. The annualised growth rate for 2018 was 8 per cent. Considering the sectoral composition of lending, particularly large accelerations can be observed in construction, hotels and restaurants. It is noteworthy that there has been a decline in new lending to the wholesale and retail sector.
0% 5% 10% 15% 20% 25% 30%
0% 1% 2% 3% 4% 5% 6% 7% 8% 9%
FIGURE 20 NEW LENDING TO SMES (LEVEL, € MILLION) – TOTAL Q1-Q3 PER ANNUM
Source: Central Bank of Ireland, SME Credit Series, Table A.14.1.
While monitoring overall lending trends can be informative, it does not allow a disentangling of credit demand from credit supply factors. To get more insight into each of these dynamics separately, we present loan application and rejections data from the ECB survey of SMEs (Figure 21). We present the data for Ireland as well as the median value for other European countries for which data were available. Figures 21 A.1 and A.2 present the application and rejection rate for term loans. In the most recent data (April to September 2018) Irish SMEs had a similar application rate to their European peers of approximately 24 per cent. However, credit supply conditions appear tighter in Ireland with rejection rates over 7 per cent, which is nearly double the median level in the other EU countries. It is noteworthy that the rejection rate for Irish loans appears to have increased after Brexit which may reflect banks reappraising the credit risk of Irish companies exposed to UK trade. In terms of short-term credit demand, application rates are much lower in Ireland than in other European countries which may be suggestive of lower credit requirements.18 It is also noteworthy
that the application for short-term loans by Irish companies was comparable to other European countries until the Brexit referendum. Thereafter, it has trended downward in a marked fashion. Credit rejections for short-term facilities also rose after the UK European Union membership referendum but are now in line with other European countries.
18 ECB SAFE data also indicate that discouraged borrowers (those that did not apply due to possible rejection) has been falling in line with other European countries. Gargan et al. (2018) also show that Irish firms have considerable own funds which may be reducing the requirement to obtain external financing and muting the level of loan demand.
-40% -20% 0% 20% 40% 60% 80% 100%
0 500 1000 1500 2000 2500 3000 3500 4000 4500
FIGURE 21 SME CREDIT APPLICATIONS AND REJECTIONS (%)
A.1 Credit Applications for Bank Term Loans B.1 Credit Applications for Short-Term Facilities
A.2 Credit Rejections for Bank Term Loans B.2 Credit Rejections for Short-Term Facilities
Sources: ECB SAFE Survey.
Notes: Other countries include: AT, BE, DE, ES, FI, FR, GR, IE, IT, NL, PT. Application rate indicates the percentage of firms that applied for credit.
Looking forward, enterprises are likely to face a shock to cash flows and working capital if a hard-Brexit scenario occurs. Having sufficient credit lines and funding in place to manage any immediate disruptions to business operations or supply chains is important. To this end, the Government has introduced a Brexit loan scheme through the Strategic Banking Corporation of Ireland, which provides low cost funding to cover Brexit related working capital and investment needs. Measures such as this can be vital in ensuring firms do not face a credit crunch at a time when they are trying to deal with significant changes in trading relationships.
Interest rates and the cost of finance
The standard variable rate on new mortgage loans in Ireland stood at 3.12 per cent as of Q4 2018; this is down slightly year-on-year from 3.32 in Q4 2017. The market for fixed rates has become more competitive and the average rate on one- to three-year fixed rate products stood at 2.74 per cent in Q4 2018 which is 0
5 10 15 20 25 30 35
20
10
H1
2010H2 2011H1 2011H2 2012H1 2012H2 2013H1 2013H2 2014H1 2014H2 2015H1 2015H2 2016H1 2016
H2
2017H1 2017H2 2018H1
Median Non-IE IE
0 5 10 15 20 25 30 35 40
2010H1 2010H2 2011H1 2011H2 2012H1 2012H2 2013H1 2013H2 2014H1 2014H2 2015H1 2015H2 2016H1 2016H2 2017H1 2017H2 2018
H1
Median Non-IE IE
0 5 10 15 20 25
2010H1 2010H2 2011H1 2011H2 2012H1 2012H2 2013H1 2013H2 2014H1 2014H2 2015H1 2015H2 2016H1 2016H2 2017H1 2017H2 2018H1
Median Non-IE IE
0 5 10 15 20 25 30
2010H1 2010H2 2011H1 2011H2 2012H1 2012H2 2013H1 2013H2 2014H1 2014H2 2015H1 2015H2 2016H1 2016H2 2017H1 2017H2 2018H1
down 30 basis points in 12 months. However, when comparing Irish new house purchase loans relative to other Eurozone economies, it is clear interest rates on mortgages in the domestic market remain the highest of comparator countries (Figure 22).
FIGURE 22 INTEREST RATES ON NEW HOUSE PURCHASE LOANS TO HOUSEHOLDS (%)
Source: Central Bank of Ireland, SME Credit Series, Table A.14.1.
Notes: Countries included are: AT, BE, EE, ES, FI, FR, IE, IT, LT, NL, PT, SI. These countries are selected due to data availability. Data differ between this chart presented and the text, as the ECB comparison data include restructured mortgages whereas the new business standard variable rate (SVR) is only for new drawdowns.
A similar picture emerges in relation to corporate interest rates. Figure 23 presents the interest rates on new business loans for non-financial corporates in Ireland relative to the average for the Eurozone. Two series are presented: 1) loans greater than €1 million which is a proxy for large companies and 2) capturing loans of less than €250,000 which is used as a proxy for loans for SMEs. In December 2018, the average rate on new loans for large Irish corporates was 1.92 per cent. The Eurozone average was 1.3 per cent, approximately 60 basis points lower than the Irish rate. For small Irish corporate loans, the interest rate in December 2018 was 4.29 per cent compared to the Eurozone average of 2.24 per cent, a full 200 basis points lower than the Irish figure.
Given the common monetary policy rate, the ongoing existence of a wedge between the Irish and European markets can be explained by a range of structural factors of the banking system such as risk appetite, competition, regulations and the cost of funds for Irish banks. Policies to enhance the competitiveness of the banking sector and its efficiency are required.
0 1 2 3 4 5 6 7 8 2000Jan 2000O ct 2001Ju l 2002A p r 2003Jan 2003O ct 2004Ju l 2005A p r 2006Jan 2006O ct 2007Ju l 2008A p r 2009Jan 2009O ct 2010Ju l 2011A p r 2012Jan 2012O ct 2013Ju l 2014A p r 2015Jan 2015O ct 2016Ju l 2017A p r 2018Jan 2018O ct
The wedge may also reflect a greater risk profile amongst Irish SMEs or whether they have collateral available.
FIGURE 23 INTEREST RATES ON NEW CORPORATE LOANS – EUROPEAN COMPARISON (%)
Source: ECB MFI data. Small loans refer to loans less than €250,000.
To provide more insight into the variation of SME interest rates within Ireland, Figure 24 presents the average new lending interest rates by sector for the first three quarters of 2018. The lowest rates are in the hotels, real estate and manufacturing sectors. Often these sectors would have access to physical collateral in the form of buildings or machinery that could be used to lower the cost of finance. Sectors such as business services, education and transport face the highest rates.
0 1 2 3 4 5 6 7
20
10J
u
n
20
11Mar
20
11De
c
20
12S
e
p
20
13J
u
n
20
14Mar
20
14De
c
20
15S
e
p
20
16J
u
n
20
17Mar
20
17De
c
20
18
Se
p
FIGURE 24 INTEREST RATES ON NEW CORPORATE LOANS – SECTOR COMPARISON (BAR IS MARKET AVERAGE)
Source: CBI SME Credit Data.
Inflation Outlook
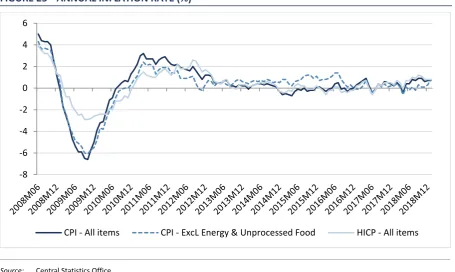
While the early months of 2018 had seen a moderation in inflation, both the overall Consumer Price Index (CPI) and the Harmonised Index of Consumer Prices (HICP) have started to rise in the final three quarters of 2018. Figure 25 presents the inflation rate for these series and the CPI excluding energy and unprocessed foods. While increasing inflationary pressures are evident from the CPI and HICP, core inflation which excludes energy and unprocessed foods is much weaker and suggests a more muted inflation outlook for the domestic economy. In the most recent data point there has been some convergence between the core and headline CPI.
[image:42.595.72.528.81.353.2]FIGURE 25 ANNUAL INFLATION RATE (%)
Source: Central Statistics Office.
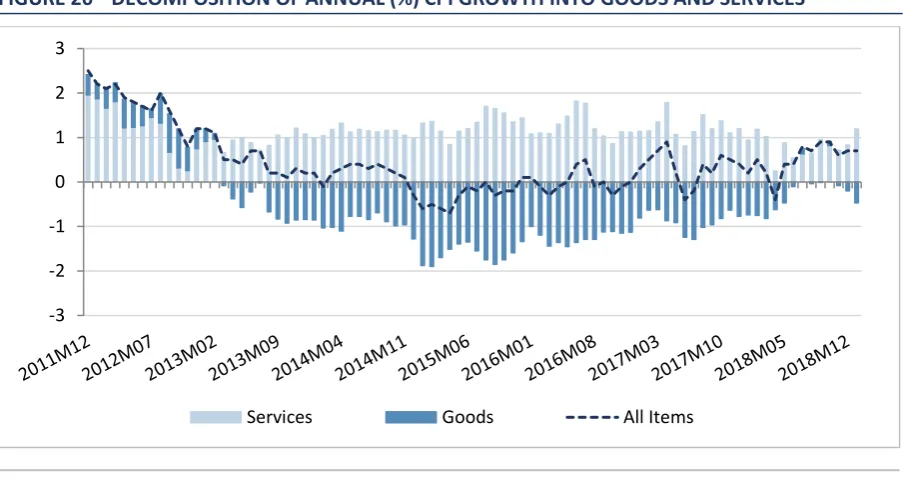
The difference in price trends between the goods and services sectors is quite apparent. The underlying trends in the CPI (Figure 26) up to January 2019 indicates service prices have been accelerating. Goods prices on the other hand have been declining and, while it appeared some of the declines in goods prices were abating, the final months of 2018 and into 2019 show an accelerated rate of decline in goods prices.
In terms of the product-specific contributions to inflation, the product groupings which are lowering the inflation rate are miscellaneous goods and services, household furnishings, equipment and household maintenance and food and non-alcoholic beverages. Housing and utilities, hotels and restaurants and energy products are providing the greatest stimulus to inflation.
-8 -6 -4 -2 0 2 4 6
[image:43.595.72.528.81.353.2]