Probabilistic combination of static and dynamic gait features for
verification
Alex I. Bazin
*, Mark S. Nixon
School of Electronic and Computer Science, University of Southampton, SO17 1BJ, UK
ABSTRACT
This paper describes a novel probabilistic framework for biometric identification and data fusion. Based on intra and inter-class variation extracted from training data, posterior probabilities describing the similarity between two feature vectors may be directly calculated from the data using the logistic function and Bayes rule. Using a large publicly available database we show the two imbalanced gait modalities may be fused using this framework. All fusion methods tested provide an improvement over the best modality, with the weighted sum rule giving the best performance, hence showing that highly imbalanced classifiers may be fused in a probabilistic setting; improving not only the performance, but also generalized application capability.
Keywords: Probabilistic, Biometrics, Gait, Bayesian, Logistic function, Fusion
1. INTRODUCTION
Gait recognition is defined as the identification of a person through the pattern produced by walking. This field has produced significant interest over recent years, and through this work it has been shown that a subject’s gait pattern is sufficiently unique for identification. Gait has particular advantages over other biometrics: it can be used at a distance, uses no addition skills on the part of the subject, and may be performed without the subject’s awareness or active participation. All of these advantages make it particularly valuable in surveillance or security systems.
Recognition methods can be broadly divided into two groups, silhouette-based techniques and model-based techniques. Silhouette-based techniques [1] tend to offer speed and simplicity, but are only indirectly linked to gait and are difficult to normalise for noise or variations such as clothing. Model-based techniques [2] use the shape and dynamics of gait to guide the extraction of a feature vector. In this paper we utilize the dynamic method of Wagg and Nixon [2, 3] and the static method of Veres et al [1].
In many recognition approaches, recognition relies on distance metrics, typically Euclidean distance, i.e a form of nearest neighbor classifier, between two vectors: one of a known subject, iC, and one of an unidentified subject, iN. A
classification decision can be made based on the Euclidean distance, d, between the two vectors. This approach has a number of weaknesses; principal amongst them is that it fails to exploit any knowledge of variation within the data, particularly which variation is due to changes between recordings of the same subject (intra-class variations) and which variation is due to changes between subjects (inter-class variations). The second important weakness of this technique is the uncertainty about the range or distribution of scores that will be produced. This is an important factor in verification and in data fusion. The Euclidean distance can struggle with verification since unimportant dimensions in the measurement vector can contribute greatly to the similarity score, exacerbating difficulty in finding a suitable threshold. Data fusion combines metrics from various techniques to build one single identification score [4-6]. These methods struggle when using distance based metrics since the scale and distribution of scores across multiple techniques are unlikely to be similar. To compensate for this, score transformation is often used to approximate the posterior probability [7, 8]; however it is not clear whether these are good approximations of the posterior probability. In this paper we describe a more suitable method, where the posterior probabilities are calculated directly. Previous approaches to combining gait metrics [7, 9] have all relied on score transformation to allow data fusion, also only static fusion rules are used and no consideration is given to the imbalance of classifiers.
One solution for all of the problems described above would be to use the Bayesian classifier [10] to provide a probabilistic measure for the verification (or classification) decision. A well designed Bayesian classifier will take into account intra and inter-class variation, as well as providing well scaled (guaranteed between zero and one) and well distributed outputs. The use of Bayesian classifiers is unknown in gait recognition, although there have been some attempts to implement Bayesian classifiers in face recognition [11-14]. Whilst these implementations have performed well in the classification task, initial experiments have suggested that similar performance is not achieved in the
*
verification task. It would appear that the suitability of the Gaussian distribution for modelling these distributions has not been fully explored and that the likelihoods arising from these models are poorly scaled and distributed [15].
In this paper we examine the application of our novel probabilistic framework to the task of data fusion. We describe our method for obtaining confidences in verification decisions using static and dynamic gait vectors. These confidences are combined using static and weighted fusion rules to assess the performance of our method using a large publicly available database [16]. We show that probabilistic methods for data fusion are beneficial to the problem of fusing multiple imbalanced gait measures for verification.
2. THEORY
2.1. Gait signature extraction
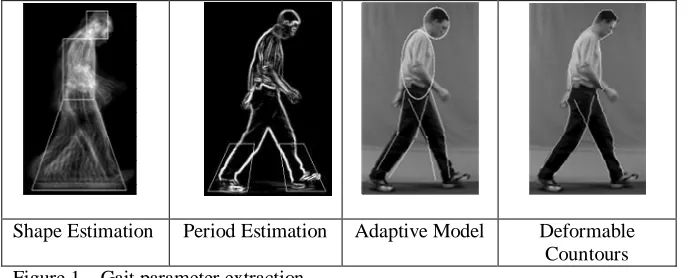
For our gait signatures we employ two methods, a dynamic method proposed by Wagg and Nixon [2, 3] and a static method described by Veres et al [1]. For the dynamic signature we follow the methods of Wagg and Nixon to extract a seventy-three dimensional measurement vector, i, using model based estimation. This signature derives from bulk motion and shape characteristics of the subject, articulated motion estimation using an adaptive model and motion estimation using deformable contours; examples of all of these processes can be seen in Figure 1. After pre-processing to remove noise and background the sequence is edge detected with a Sobel operator. A motion compensated temporal accumulation algorithm [17] is used to extract the bulk motion of the subject in the horizontal plane. This is then filtered using template matching, leaving only motion due to the subject. Shape estimation is then performed using a more accurate model of the subject’s shape.
Articulated motion is estimated as sinusoidal models of hip, knee, ankle and pelvic rotation. These provide a starting point for model adaptation of the subject’s limb movements. An adaptive process for joint location is then applied to the sequence to form a more accurate and robust model of limb movement. This adaptive process is based on an iterative gradient descent model repeated until no changes occur over the entire sequence.
By feature selection, the processes described in [3] yield 45 parameters based on are joint rotation models for the hip, knee and ankle and 18 parameters describing the subject’s speed, gait frequency and body proportions. A further 10 parameters are extracted from the processes described in [2]. All of these parameters are normalised to make them size invariant.
[image:2.612.62.411.402.541.2]Shape Estimation Period Estimation Adaptive Model Deformable Countours Figure 1 – Gait parameter extraction
For the static signature the sequence undergoes the same pre-processing to remove distortion and background and silhouettes are obtained by connected component analysis and morphological operators. The output of this operation is a series of binary images of the subject silhouette over a complete gait cycle. These silhouettes are normalised to provide a common centre of mass and then summed to form an average silhouette across the complete gait cycle. This average silhouette yields a vector of 4,096 dimensions.
2.2. Intra and inter-class variation
We seek to exploit our knowledge of the variation within the difference measure d to provide a probabilistic measure of whether the feature vectors iC and iN belong to the same subject. Specifically we wish to describe the variation in two
To describe this variance we take a corpus of training data that contains a number of subjects each with multiple measurement vectors. From this corpus we subtract every vector from all other vectors of the same subject and allow this to form our intra-class training set, DC; we also subtract every vector from every other vector in the corpus where
the subjects are not identical, this forms the inter-class training set, DI.
Having created our two training sets we then find the mean and variance of each set:
∑
= ∀ ∈
= N
i
i d D
d N 1
1
µ (1)
(
)
∑
= − ∀ ∈
= N
i
i d D
d N 1
2
2 1 µ
σ (2)
This process is undertaken for both the intra and inter-class training sets to give, µC, µI, σ2C, and σ2I. We justify the
use of the variance rather than the covariance following Liu and Wechsler’s work in face recognition [13] where they make the assumption that the covariance matrices are diagonal:
{
2 2}
2 2
1, ,..., m
diagσ σ σ =
Σ (3)
Initial experiments performed on our data show that the covariance matrices are indeed sparse except on the diagonal and we concur with Liu and Wechsler’s experiments showing no loss of performance using variance rather than covariance.
2.3. Likelihood estimation
We wish to describe a new sequence’s similarity to a stored sequence of a known subject in a probabilistic manner using the information on the mean and variance obtained in (1) and (2). To achieve this we must calculate the likelihoods of obtaining the distance d given either intra-class variation, P(d|C), or an inter-class variation, P(d|I), i.e that the subject is either a client or an impostor.
It is desirable to model these two distributions such that P(d|C) tends to one with d less than µC, tending to zero as d
increases beyond µC; conversely P(d|I) should tend to zero with d less than µI and tend to one as d increases beyond µI. If
the distributions of d from clients and impostors then the functions for P(d|C) and P(d|I) should appear as in Figure 2. To achieve this distribution we have chosen to model P(d|C) and P(d|I) as logistic functions (Figure 2) such that:
(
)
+ = − C C b d e C d P µ 1 1| (4)
( )
( ) + = − − I I b d e I d P µ 1 1 | (5) c i mbm = 3σ2/π2 ∈ , (6)
These functions conform to our requirements that they take into account knowledge of the variation in d, that they are well distributed and that they are guaranteed to produce outputs between zero and one.
2.4. Bayesian Classification
) ( ) ( ) | ( ) | ( d P C P C d P d C
P = (7)
) ( ) (C P I
P = (8)
) | ( ) ( ) | ( ) ( )
(d PC P d C P I P d I
P = + (9)
Equation (7) then simplifies to:
) | ( ) | ( ) | ( ) | ( I d P C d P C d P d C P + = (10)
Having calculated the posterior probability, a suitable decision threshold, t, can be implemented for the verification task. Hence if P(C|d) is greater than t we accept the assertion that the subject is a client, otherwise we reject them as an impostor. The value of t may be adjusted to achieve the desired trade-off between false accept and false reject rates.
2.5. Data fusion rules
Having obtained the posterior probability for our static and dynamic gait vectors we may now combine them using either static or weighted product and sum decision rules [4, 5]. The rules are given by (11) and (12), where P(C|di) is the
posterior probability from the ith classifier and R is the number of classifiers to be fused; in the case of the static fusion rules the weights are set to 1/R.
Sum rule:
(
)
=∑
(
)
R
i
i i
R wPC d
d d C
P | 1,..., | (11)
Product rule:
(
)
R(
)
Ri
R w i
R PC d i
d d C
P | 1,..., =
∏
| (12)The optimal weights, wi, for weighted fusion are determined by the additive error, Eadd from each classifier [18] and
may be found using:
i add R
k addk i
E E
w 1 1
1 −
=
∑
(13)Due to the difficulties in calculating the value of Eadd we instead approximate this value with the equal error rate of
each classifier.
3. METHODOLOGY
Using the Southampton HiD database [16] consisting of 1,079 sequences from 115 subjects walking to the left (such as the example image shown in Figure 3) we were able to construct training, gallery, client and impostor sets; these sets were converted to both dynamic and static feature vectors. The training set consisted of 145 sequences of 15 subjects that could be used to estimate the intra and inter-class mean and variance; the gallery consisted of single sequences from 100 subjects; the client set consisted of 834 sequences each matched to a subject in the gallery set; the impostor set consisted of 834 sequences where the sequences were not matched to a subject in the gallery.
Figure 2 – Intra and Inter Class Distributions and Likelihoods
Figure 3 – Example Image for Gait Sequence
4. RESULTS
The Equal Error Rates for all of the experiments are shown in Table 1. As can be seen the EERs for the dynamic and static modalities alone are 7.3% and 15.5% respectively; this makes the fusion task highly imbalanced and according to Daughman [6] we would expect to see no improvement through fusion. However we can see that all fusion methods show some improvement over the use of the dynamic method alone. Using McNemar’s Test [19] to evaluate the statistical significance of any improvement over the dynamic method we show that the improvement using the static product rule is not statistically significant, however the improvements shown by the other fusion rules are all statistically significant at the 1% level. Despite these improvement appearing small it must be remembered that the methods we are using are already highly effective and that since the results are statistically significant it is unlikely that this improvement is due to feature space noise.
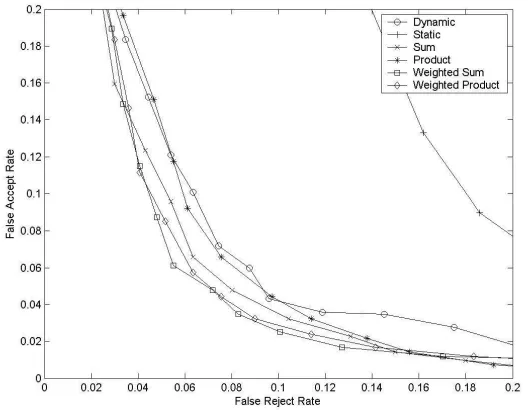
Receiver Operator Characteristic curves over the region of interest can be seen in Figure 3; from these we can see the poor performance of the static method together with the more effective dynamic method and the improvements gained by using the fusion rules. It can be seen that these improvement does not hold in all regions for all methods; perhaps this is because the weights are trained for the EER case, though further experiments would be needed to confirm this.
Method Equal Error Rate (%)
Dynamic 7.3
Static 15.5
Static Sum 6.5
Static Product 7.2
Weighted Sum 5.9
Weighted Product
6.2
[image:5.612.269.533.444.649.2]The results of our experiments show that in the case of highly imbalanced classifiers statistically significant improvement is possible through the use of fusion methods in conjunction with probabilistic techniques. The weights used for these experiments were obtained in a principled manner, though more work is needed to determine if this approach is optimal.
It is also of interest to consider how the fusion process improves the separability of the clients and impostors; this can be measured by Daugman’s decidability index [6] and is given by:
(
2)
2 2 1
2 1
2
1 σ σ
µ µ
+ − =
′
d (14)
Where µ1 and µ2 are the mean values of the client and impostor posterior probabilities respectively, and σ21 and σ22
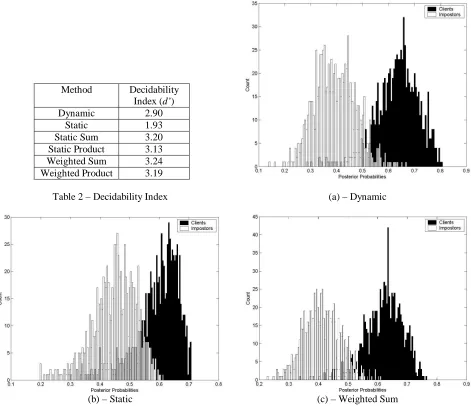
are the variances for the client and impostor posterior probabilities. By way of comparison the decidability index for an experiment with a classification rate of 99.2% on 252 examples was 3.43 [20]. The values for d’ can be seen in Table 2 with example distributions from the dynamic, static and weighted sum experiments in figures 4(a) through (c).
Method Decidability Index (d’)
Dynamic 2.90
Static 1.93
[image:6.612.71.542.262.668.2]Static Sum 3.20 Static Product 3.13 Weighted Sum 3.24 Weighted Product 3.19
Table 2 – Decidability Index (a) – Dynamic
(b) – Static (c) – Weighted Sum
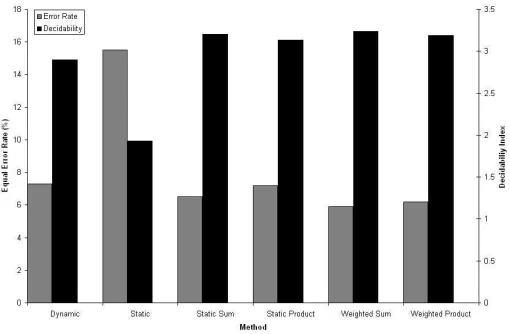
Using the decidability index to evaluate the various methods we see that they are generally in agreement with the Equal Error Rates above, the exception is the static sum and weighted product rules, although the difference in both the decidability index and EER is slight (Figure 5). It is apparent that the decidability index is roughly inversely proportional to the Equal Error Rate for our example methods; this is to be expected as the more separated the client and impostor sets are, the greater noise immunity one would expect the method to have.
Figure 5 – Equal Error Rates and Decidability
5. CONCLUSIONS
In this paper we have described a novel probabilistic framework for biometric recognition and data fusion; we show the framework applied to the fusion of two highly imbalanced gait modalities. Our results indicate that it is possible to achieve improvements in verification performance in imbalanced classifiers using probabilistic methods and fusion rules; in addition we show that the Weighted Sum rule is the most effective in our tests. We show that the improvement in error rate is due to an increased separation in the client and impostor distributions and that this increase is roughly proportional to the improvement in error rate. In future work we will aim to assess if the method we use for calculating weights is optimal and whether these weights may be tuned to provide better performance in certain areas of the ROC curve; we shall also extend this work to other biometric modalities.
ACKNOWLEDGMENTS
The authors gratefully acknowledge partial support by the Defence Technology Centre 8-10 supported by General Dynamics, the Engineering and Physical Research Council, UK, and Neusciences. The authors also thank David Wagg and Galina Veres for their assistance in processing the gait sequences.
REFERENCES
1. Veres, G.V., et al. What image information is important in silhouette-based gait recognition? in Proc. IEEE Computer Society Conf. Computer Vision and Pattern Recognition (CVPR 2004). 2004.
2. Wagg, D.K. and M.S. Nixon, Automated markerless extraction of walking people using deformable contour models. Computer Animation and Virtual Worlds, 2004. 15(3): p. 399-406.
3. Wagg, D.K. and M.S. Nixon. On automated model-based extraction and analysis of gait. in Proc. 6th IEEE Int'l Conf. Automatic Face and Gesture Recognition. 2004.
4. Kittler, J., et al., On combining classifiers. IEEE Transactions on Pattern Analysis and Machine Intelligence, 1998. 20(3): p. 226-239.
5. Benediktsson, J.A. and P.H. Swain, Consensus theoretic classification methods. IEEE Transactions on Systems, Man and Cybernetics, 1992. 22(4): p. 688-704.
6. Daughman, J., Biometric decision landscapes. 1999, University of Cambridge Computer Laboratory. 7. Wang, L., et al., Fusion of static and dynamic body biometrics for gait recognition. IEEE Transactions on
8. Shakhnarovich, G. and T. Darrell. On probabilistic combination of face and gait cues for identification. in Proc. 5th IEEE Int'l Conf. Automatic Face and Gesture Recognition. 2002. Washington, USA.
9. Cuntoor, N., A. Kale, and R. Chellappa. Combining multiple evidences for gait recognition. in IEEE Int'l Conf. Accoustics, Speech, and Signal Processing (ICASSP 2003). 2003. Hong Kong.
10. Langley, P., W. Iba, and K. Thompson. Analysis of Bayesian classifiers. in National Conf. Artificial Intelligence. 1992. San Jose, USA.
11. Chellappa, R., S. Zhou, and B. Li. Bayesian methods for face recognition from video. in Proc. Int'l Conf. Acoustics, Speech and Signal Processing (CASSP 02). 2002. Orlando, FL, USA: IEEE.
12. Chengjun, L., A Bayesian discriminating features method for face detection. IEEE Transactions on Pattern Analysis and Machine Intelligence, 2003. 25(6): p. 725-740.
13. Liu, C. and H. Wechsler. Probabilistic reasoning models for face recognition. in Proc. IEEE Computer Society Conf. Computer Vision and Pattern Recognition. 1998. Santa Barbara, USA.
14. Moghaddam, B., T. Jebara, and A. Pentland, Bayesian face recognition. Pattern Recognition, 2000. 33(11): p. 1771-1782.
15. Bazin, A.I. and M.S. Nixon. Facial Verification Using Probabilistic Methods. in Proc. British Machine Vision Association Workshop on Biometrics. 2004. London.
16. Shutler, J.D., et al., On a Large Sequence-based Human Gait Database. Proc. Recent Advances in Soft Computing, 2002: p. 66-71.
17. Wagg, D.K. and M.S. Nixon. Model-Based Gait Enrolment in Real-World Imagery. in Proc. Multimodal User Authentication. 2003.
18. Roli, F., G. Fumera, and J. Kittler. Fixed and trained combiners for fusion of imbalanced pattern classifiers. in Proc. 5th Int'l Conf. Information Fusion. 2002. Annapolis, MD, USA: Int. Soc. Inf. Fusion.
19. Beveridge, J.R., et al. Parametric and nonparametric methods for the statistical evaluation of human id algorithms. in Proc. 3rd Workshop on the Empirical Evaluation of Computer Vision Systems. 2001.