Annual report on the implementation of Council Regulation (EC) No 812/2004 during
2014
Member State: United Kingdom
Reference Period: 2014
Date: May 27
th2015
Authors: Simon Northridge
1, Al Kingston
1and Len Thomas
2.
1
Sea Mammal Research Unit (SMRU) / Scottish Oceans Institute (SOI), University of St
Andrews.
2
SUMMARY
Based on the 2014 official fleet effort statistics, between 25 and 27 UK registered vessels may have been fishing in such a way as to require the use of pingers under Regulation 812/2004, to help minimise cetacean bycatch. Most or all of the vessels concerned are now equipped with pingers, and the enforcement
authorities have been carrying out inspections to ensure compliance with the regulation.
UK based vessels are mainly using DDD-03 pingers to minimise cetacean bycatch, though other devices may also be being used. The UK authorised the use of the DDD pinger by the over 12 m fishing fleet, if used in accordance with agreed operating procedures, under Article 3 (2) of Regulation 812/2004, and has notified the European Commission accordingly.
Ongoing monitoring of pinger efficacy, as required under Article 2 of Regulation 812/2004, continues in the UK over 12 m set gillnet fleet, with 10 trips and 202 fishing operations monitored during 2014. While bycatch rates of harbour porpoise continue to be much lower in gillnets that are properly equipped with pingers (meaning no clear evidence of habituation yet), it is still unclear whether pingers are having any effect on the bycatch rates of dolphin species or seals in gillnets.
Monitoring during 2014 included 55 days on pelagic trawls and 304 days on static net (gillnet) vessels, as well as 39 days on longline vessels.
Sampling in pelagic trawl fisheries during 2014 focused on small scale fisheries for sprats, sardines and herring mainly in the English Channel, and for blue whiting west of Ireland (VIIC). There was no observer sampling and only three days fishing effort reported in the bass pair trawl fishery in the Channel in 2014. Sampling of static net fisheries covered a wide variety of gear types and major fishing areas. Roughly 90% of static gear sampling was in the south and west of the UK (Divisions VIIdefghj), and the remainder was in the Irish and North Seas.
An additional 1010 non-dedicated discard sampling days by collaborating institutions have also been collated, including 112 days and 299 net hauls among static net fisheries, without any record of cetacean bycatch. These records are useful mainly for screening for potential protected species bycatch that may indicate a requirement for more focused monitoring in certain places, times or on particular gear types. Cetacean bycatches recorded under the dedicated sampling programme included seven harbour porpoises and two common dolphins. All cetacean bycatches were recorded from static net fisheries, mainly tangle and trammel nets. Six grey seals were also reported bycaught.
Observed seabird bycatches were: fulmar (n=119), guillemot (n=8), great black-backed gull (n=1), herring gull (n=1) and great northern diver (n=1). Among the elasmobranchs, catches of porbeagle shark, spurdog, tope, blue shark, common skate, undulate ray and black skate were relatively common; less frequently recorded species included angel shark, six-gilled shark and long-nosed skate.
ACOUSTIC DETERRENT DEVICES
1. General Information
The UK is fully implementing Article 2 of Regulation 812/2004. All relevant vessel owners and masters have been advised of the provisions of the Regulation, and relevant training for enforcement officers has been provided. No additional legislative measures are needed. However, the Marine Management Organisation (MMO) provided full guidance on the implementation of the Regulation and the use of pingers, which is available at: http://www.marinemanagement.org.uk/fisheries/monitoring/regulations_cetaceans.htm Further, following notification to the Commission in line with the requirements of Regulation 812/2004 (Article 3) the UK now authorises the use of the DDD-03 pinger and has issued a procedure for its use, available at the above web page, to ensure that fishermen choosing this device deploy it correctly to be fully effective.
1.1 Description of the fleet
Official logbook records indicate that 32 UK registered vessels of over 12 m in overall length (LOA) fished with nets described as gillnets or entangling nets during 2014 in relevant fishing areas (ICES Divisions VIIdefghj and Subarea IV). Among these 32 vessels, 26 fished in the Southwest (VIIdefghj), an area where all bottom set or entangling gillnets deployed by over 12 m vessels are required to be with equipped pingers. Of these 26 vessels, 22 smaller boats (under 25 m) predominantly landed to local ports (meaning UK or local French) and 4 larger boats (over 25 m) landed predominantly into Spanish ports or via more distant UK ports to overland the catch. These larger vessels typically fish further from UK coasts, mainly along the continental shelf break, upper slope and deep-water banks.
Among the 26 over 12 m vessels fishing in the Southwest, official logbook records indicate that five used “encircling gillnets” to catch small pelagic fish in VIIe and VIIf. Further enquiries indicated that these vessels were in fact using a type of ring net (similar to a purse seine) to encircle pelagic fish, and such nets do not require pingers under the Regulation. The description used in the official logbook database of “encircling gillnets” is unclear and potentially misleading but it seems unlikely that the type of gear being described would oblige these five vessels to use pingers. Assuming this to be correct, the number of UK vessels requiring pingers in the Southwest area during 2014 was 21.
Eight vessels over 12 m fished with gillnets in the North Sea, two of which also fished in Subarea VII. Of these eight vessels, six reported the use of nets with meshes of more than 220 mm, which would require them to use pingers, while two UK based vessels used smaller meshed nets. These two vessels fished the North Sea throughout the year, including between August and October, and may have been fishing in such a way (i.e. with nets “the total length of which does not exceed 400 m”, indicative of nets fished on wrecks) that would require them to use pingers under the gear categories listed in Annex I of the Regulation. However, official logbook data do not contain this level of detail regarding net fleet lengths and we do not have information about whether these vessels were inspected at sea between August and October, the period during which pingers are required by vessels wreck netting (using short net fleets).
Overall we conclude that between 25 and 27 UK registered vessels may have been fishing in such a way as to require the use of pingers during 2014.
Table 1.1 Description of the UK fleet required to use pingers under Annex I of the Regulation (na = not available)
Metier
Fishing Area
Number of vessels
Expected % using pingers
Number of Trips
Days at Sea
Months of operation
Total net length
Total Soak time Southwest
GNS-Crustaceans VIIE 4 100% 5 15 1-11 na na
GNS-Crustaceans VIIE 4 100% 5 15 1-11 na na
GNS-Crustaceans VIIG 1 100% 1 10 6-6 na na
GNS-Demersal
fish VIIE 14 100% 179 569 1-12 na na
GNS-Demersal
fish VIIF 14 100% 90 306 1-12 na na
GNS-Demersal
fish VIIG 13 100% 178 923 1-12 na na
GNS-Demersal
fish VIIH 14 100% 118 640 1-12 na na
GNS-Demersal
fish VIIJ 13 100% 70 643 1-12 na na
North Sea
GNS-Demersal
fish IVA 6 100% 36 2780 3-10 na na
GNS-Demersal
fish IVB 2 ? 29 495 1-12 na na
GNS-Demersal
fish IVC 1 ? 3 29 1-12 na na
2. Acoustic Deterrent Devices (Article 2 and 3)
2.1 Mitigation measures
As far as we are aware, UK registered over 12 m vessels operating from the South West of England are using DDD-03 pingers routinely. Anecdotal accounts suggest that other pinger models may also be in use by the UK registered Spanish owned fishing fleet. A number of pinger types were noted during inspections by Scottish enforcement officers (see section 3.2 below).
Table 2.1: Mitigation measures being used in the UK fleet
Metier Fishing Area
Pinger Characteristics Other mitigation measures
GNS-Crustaceans VIIE DDD-03L and possibly others None known GNS-Crustaceans VIIG DDD-03L and possibly others None known GNS-Demersal fish VIIE DDD-03L and possibly others None known GNS-Demersal fish VIIF DDD-03L and possibly others None known GNS-Demersal fish VIIG DDD-03L and possibly others None known GNS-Demersal fish VIIH DDD-03L and possibly others None known GNS-Demersal fish VIIJ DDD-03L and possibly others None known
PTM-Bass VIIE DDD-03H on a voluntary basis Negligible effort 2014; fishery banned 2015 Larger UK registered vessels fishing offshore that are based in Spain rather than the UK are known
to be using more than one type of pinger among them, including the DDD-03. Details of enforcement actions during 2014 are given below in Section 3.2.
We continue to examine the data for evidence of effects of DDDs on species other than porpoises; specifically on bycatch rates of common dolphins and on possible effects on seal depredation.
3. Monitoring and assessment
3.1 Monitoring and assessment of the effects of pinger use (Article 2.4)
We have continued to monitor trips by over 12 m vessels that are required to use pingers under Regulation 812/2004. During 2014, 10 such trips involving 202 hauls were observed. We found no evidence of any decline in efficacy of the devices. The guidelines which were produced in 2012 and agreed with industry, state that DDD pingers should be placed no more than 4 km apart, either to the buoy ropes at each end of a net fleet, or if net fleets more than 4 km are used pingers should be attached to the floatline and/or buoy ropes so that no part of the net fleet is more than 2 km from an active pinger.
3.2. Report on measures to control specifications when pingers are in use by
fishermen (Article 2.4)
The Royal Navy and relevant national marine enforcement officers have been checking for compliance with Regulation 812/2004 whilst carrying out at-sea inspections; this is a task which is included as a regular inspection requirement in the relevant fishing areas. Inspections of over 12 m gill netting vessels are carried out according to a risk based enforcement approach.
During 2014, thirty seven over 12 m gill netting vessels were inspected at sea and in port. Inspections took place in Subareas IV, VI and VII. Five of these vessels were inspected by Scottish authorities in Subarea VI and eleven in Subarea IV, one by Welsh authorities and twenty by the English authorities.
During these inspections a number of different pinger types were noted to be in use, although no model details were recorded. Inspection officials did check pinger certificates on board and reported that most inspected vessels were using a mix of both “type 1” and “type 2” devices as set out in Annex II of Regulation 812/2004. As a consequence of one inspection regarding bycatch, a case has been submitted to the
Procurator Fiscal.
Following the initial boarding and inspections on gillnet vessels, when some infringements were detected, there was a notable improvement in levels of compliance during 2014 by the vessels concerned in the carriage and use of pingers. Additionally, shore based Fishery Officers witnessed pingers being loaded on some vessels whilst in port.
The MMO in England has also taken steps to employ the use of the ETEC detector, however the small range of some deterrent devices limit the platforms from which the ETEC detector can be used. Options to fully utilise this device will continue to be explored, but at sea inspections (in line with the risk based enforcement model) are the primary monitoring tool in the short term.
3.3. Derogation
In 2012 the UK authorised the use of DDD pingers, if used in accordance with agreed operating procedures, under Article 3 (2) of Regulation 812/2004, and notified the European Commission accordingly. In June 2014, the Commission was notified that the authorisation was to be extended for a further two years, in accordance with Article 3(2) of the Regulation. Certain UK vessels continue to use these devices under this authorisation.
3.4 Overall assessment
As mentioned in previous reports, the lack of detail in logbook and landings records makes it difficult to be certain which vessels are required to use pingers under the specifications listed in Annex I of the
Regulation. Specifically, it is not possible to identify vessels using “bottom-set gillnet or entangling net, or a combination of these nets, the total length of which does not exceed 400 metres” from logbook records.
OBSERVER SCHEMES
4. General information on implementation of Articles 4 and 5
No new procedures have been adopted regarding the implementation of the Observer Scheme during 2014. A dedicated protected species bycatch monitoring programme is managed and coordinated by the Sea Mammal Research Unit (SMRU) at the University of St Andrews, in collaboration with the Centre for Environment, Fisheries and Aquaculture Science at Lowestoft (Cefas) and the Agri-Food and Biosciences Institute of Northern Ireland (AFBINI). Data provided by Cefas and AFBINI include those collected through discard sampling conducted under the Data Collection Framework (DCF), data collected under other specific research efforts, and a limited number of dedicated sea days where protected species bycatch monitoring is the main focus for their observers.
collected under the programme are also increasingly being used to assess bycatch of other non-cetacean but protected or potentially vulnerable taxonomic groups or species, through the ICES Working Group on Protected Species Bycatch (WGBYC). The UK participates fully in the work of WGBYC. The EU Action Plan for reducing incidental catches of seabirds in fishing gears also calls on member states to undertake monitoring of seabird bycatch and “to report biennially to the Commission on the level of seabird bycatch observed by fishery and gear type”.
5. Monitoring
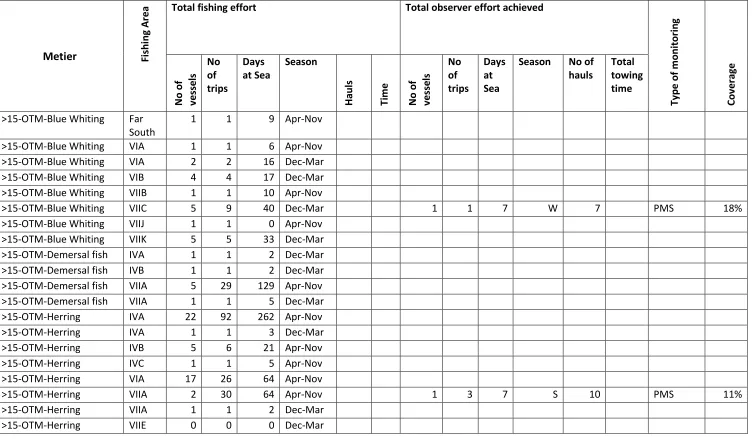
Table 5.1 Description of fishing effort and observer effort in towed gear: rows in bold are metiers with observed cetacean bycatch (see Table 6.1)
“Type of Monitoring” codes: SS= Scientific Studies; PP = Pilot project; HDM= Habitats Directive Monitoring; PMS = Pilot Monitoring Scheme.
Metier
Fishin
g A
re
a Total fishing effort Total observer effort achieved
Typ
e o
f
mo
n
ito
ri
n
g
Co
ve
ra
ge
N
o
o
f
ve
ss
el
s
No of trips
Days at Sea
Season
Ha
u
ls
Ti
me
N
o
o
f
ve
ss
el
s
No of trips
Days at Sea
Season No of hauls
Total towing time
>15-OTM-Blue Whiting Far South
1 1 9 Apr-Nov
>15-OTM-Blue Whiting VIA 1 1 6 Apr-Nov
>15-OTM-Blue Whiting VIA 2 2 16 Dec-Mar
>15-OTM-Blue Whiting VIB 4 4 17 Dec-Mar
>15-OTM-Blue Whiting VIIB 1 1 10 Apr-Nov
>15-OTM-Blue Whiting VIIC 5 9 40 Dec-Mar 1 1 7 W 7 PMS 18%
>15-OTM-Blue Whiting VIIJ 1 1 0 Apr-Nov >15-OTM-Blue Whiting VIIK 5 5 33 Dec-Mar >15-OTM-Demersal fish IVA 1 1 2 Dec-Mar >15-OTM-Demersal fish IVB 1 1 2 Dec-Mar >15-OTM-Demersal fish VIIA 5 29 129 Apr-Nov >15-OTM-Demersal fish VIIA 1 1 5 Dec-Mar
>15-OTM-Herring IVA 22 92 262 Apr-Nov
>15-OTM-Herring IVA 1 1 3 Dec-Mar
>15-OTM-Herring IVB 5 6 21 Apr-Nov
>15-OTM-Herring IVC 1 1 5 Apr-Nov
>15-OTM-Herring VIA 17 26 64 Apr-Nov
>15-OTM-Herring VIIA 2 30 64 Apr-Nov 1 3 7 S 10 PMS 11%
>15-OTM-Herring VIIA 1 1 2 Dec-Mar
Metier
Fishin
g A
re
a Total fishing effort Total observer effort achieved
Typ
e o
f
mo
n
ito
ri
n
g
Cove
ra
ge
N
o
o
f
ve
ss
el
s
No of trips
Days at Sea
Season
Ha
u
ls
Ti
me
N
o
o
f
ve
ss
el
s
No of trips
Days at Sea
Season No of hauls
Total towing time
>15-OTM-Horse mackerel IIA 1 1 14 Apr-Nov >15-OTM-Horse mackerel IVA 1 2 27 Apr-Nov >15-OTM-Horse mackerel VIA 1 1 3 Apr-Nov >15-OTM-Horse mackerel VIA 5 9 64 Dec-Mar >15-OTM-Horse mackerel VIIB 1 1 1 Apr-Nov >15-OTM-Horse mackerel VIIB 1 2 28 Dec-Mar >15-OTM-Horse mackerel VIIJ 1 1 18 Apr-Nov >15-OTM-Mackerel Far
South
1 1 16 Dec-Mar
>15-OTM-Mackerel IIA 3 3 1 Apr-Nov
>15-OTM-Mackerel IVA 22 123 339 Apr-Nov
>15-OTM-Mackerel IVA 1 2 5 Dec-Mar
>15-OTM-Mackerel IVB 1 1 0 Apr-Nov
>15-OTM-Mackerel IVB 1 1 2 Dec-Mar
>15-OTM-Mackerel VIA 22 86 313 Dec-Mar
>15-OTM-Mackerel VIIB 7 7 33 Dec-Mar
>15-OTM-Mackerel VIIJ 9 11 64 Dec-Mar
>15-PTM-Bass VIIE 1 3 10 Apr-Nov
>15-PTM-Herring IVA 1 5 31 Apr-Nov 2 1 12 S 8 PMS 38%
>15-PTM-Herring IVB 1 5 32 Apr-Nov
>15-PTM-Herring VIA 1.5 4 11 Apr-Nov
>15-PTM-Herring VIA 2 3 4 Dec-Mar
>15-PTM-Herring VIID 0.5 1 1 Apr-Nov
Metier
Fishin
g A
re
a Total fishing effort Total observer effort achieved
Typ
e o
f
mo
n
ito
ri
n
g
Cove
ra
ge
N
o
o
f
ve
ss
el
s
No of trips
Days at Sea
Season
Ha
u
ls
Ti
me
N
o
o
f
ve
ss
el
s
No of trips
Days at Sea
Season No of hauls
Total towing time
>15-PTM-Horse mackerel IVC 1 3 13 Apr-Nov >15-PTM-Horse mackerel IVC 2 2 4 Dec-Mar >15-PTM-Horse mackerel VIID 1 3 20 Apr-Nov >15-PTM-Horse mackerel VIID 2 3 21 Dec-Mar >15-PTM-Horse mackerel VIIE 1 2 2 Apr-Nov >15-PTM-Horse mackerel VIIE 2 5 37 Dec-Mar >15-PTM-Horse mackerel VIIJ 1 1 14 Apr-Nov
>15-PTM-Mackerel IVA 1 2 22 Apr-Nov
>15-PTM-Mackerel VIA 1 3 17 Dec-Mar
>15-PTM-Mackerel VIID 1 1 2 Apr-Nov
>15-PTM-Mackerel VIIH 0.5 1 2 Dec-Mar
>15-PTM-Mackerel VIIJ 1 1 4 Dec-Mar
>15-PTM-Sardine VIID 0.5 1 1 Apr-Nov
>15-PTM-Sardine VIIE 0.5 1 3 Apr-Nov
>15-PTM-Sprat VIA 2 18 18 Apr-Nov
>15-PTM-Sprat VIA 2 15 15 Dec-Mar
>15-OTM-Sprat VIIE 0 0 0 Dec-Mar
>15-OTM-Sprat VIIE 0 0 0 Apr-Nov
<15-OTM-Demersal fish IVC 2 7 7 Apr-Nov
<15-OTM-Anchovy VIIE 3 38 38 Apr-Nov
<15-OTM-Anchovy VIIE 3 9 9 Dec-Mar
<15-OTM-Bass VIID 1 1 2 Dec-Mar
<15-OTM-Bass VIIE 1 1 1 Dec-Mar
Metier
Fishin
g A
re
a Total fishing effort Total observer effort achieved
Typ
e o
f
mo
n
ito
ri
n
g
Cove
ra
ge
N
o
o
f
ve
ss
el
s
No of trips
Days at Sea
Season
Ha
u
ls
Ti
me
N
o
o
f
ve
ss
el
s
No of trips
Days at Sea
Season No of hauls
Total towing time
<15-OTM-Herring IVC 1 4 4 Dec-Mar
<15-OTM-Herring VIIE 1 3 3 Apr-Nov
<15-OTM-Herring VIIE 2 27 27 Dec-Mar 1 1 1 W 3 PMS 4%
<15-OTM-Horse mackerel VIIE 2 2 2 Apr-Nov
<15-OTM-Mackerel VIIE 1 1 1 Apr-Nov
<15-OTM-Mackerel VIIE 1 3 3 Dec-Mar
<15-OTM-Sardine VIIE 1 1 1 Dec-Mar
<15-OTM-Sprat IVC 1 12 12 Dec-Mar
<15-OTM-Sprat VIID 1 3 3 Dec-Mar
<15-OTM-Sprat VIIE 3 175 175 Apr-Nov 1 16 16 S 22 PMS 9%
<15-OTM-Sprat VIIE 3 68 68 Dec-Mar 1 10 10 W 23 PMS 15%
<15-PTM-Herring IVC 1 15 15 Apr-Nov
<15-PTM-Herring IVC 1 22 22 Dec-Mar
<15-PTM-Smelt IVC 1 17 17 Apr-Nov
<15-PTM-Sprat IVC 1 16 16 Apr-Nov
<15-PTM-Sprat IVC 1 14 14 Dec-Mar
<15-PTM-Sardine VIIE 0 0 0 Dec-Mar 2 2 2 W 2 PP ++
All metiers All
areas
Table 5.2 Description of fishing effort and observer effort in static gear: rows in bold are metiers with observed cetacean bycatch (see table 6.1)
“Type of Monitoring” codes:SS= Scientific Studies; PP = Pilot project; HDM= Habitats Directive Monitoring; PMS = Pilot Monitoring Scheme. (Métiers where cetacean bycatch was recorded in 2014 are in bold)
Metier
TOTAL FLEET EFFORT TOTAL OBSERVED EFFORT
T
yp
e o
f
mo
n
ito
ri
n
g
Co
ve
ra
ge
Fishing Area
No of vessels
No of trips
Days at Sea
Se
as
o
n Total length of nets
Total soak time
No of vessels
No of trips
Days at Sea
Se
as
o
n Total length of nets
Total soak time
>15-Gill-Demersal fish IVB 2 11 69 4-12
>15-Gill-Demersal fish IVC 1 3 12 1-12
>15-Gill-Demersal fish VIIE 9 45 167 1-12
>15-Gill-Demersal fish VIIF 8 22 66 1-12
>15-Gill-Demersal fish VIIG 10 25 83 2-12 1 1 1 Oct 6 137 SS 2%
>15-Gill-Demersal fish VIIH 6 45 203 1-12 1 1 5 Nov 15 353 SS 3%
>15-Gill-Demersal fish VIII 2 4 15 5-12
>15-Gill-Demersal fish VIIJ 4 12 51 5-12
>15-Gill-Large Pelagic Fish
VIIE 2 4 4 9-12
>15-Gill-Large Pelagic Fish
VIIG 1 2 6 8-8
>15-Gill-Large Pelagic Fish
VIIH 3 12 64 7-12
>15-Gill-Large Pelagic Fish
VIII 1 2 7 8-9
>15-Gill-Large Pelagic Fish
VIIJ 1 1 1 8-8
>15-Gill Hake-Demersal fish
Far South
1 8 44 1-2
>15-Gill Hake-Demersal fish
VIIE 2 2 3 2-3
>15-Gill Hake-Demersal fish
VIIF 7 29 88 1-11
Metier
TOTAL FLEET EFFORT TOTAL OBSERVED EFFORT
T yp e o f mo n ito ri n g
Cove
ra ge Fishing Area No of vessels No of trips Days at Sea Se as o n Total length of nets Total soak time No of vessels No of trips Days at Sea Se as o n Total length of nets Total soak time
fish Nov
>15-Gill Hake-Demersal fish
VIIH 5 7 19 3-12 1 1 1 Oct 13 322 SS 4.7%
>15-Gill Hake-Demersal fish
VIII 1 1 4 1-1
>15-Gill Hake-Demersal fish
VIIJ 7 33 197 1-9
>15-Gill Hake-Demersal fish
VIIK 1 4 35
11-12
>15-Gill light-Demersal fish
VIIE 2 8 39 1-4
>15-Gill light-Demersal fish
VIIF 1 1 2
12-12
>15-Gill light-Demersal fish
VIIG 2 5 33 1-3
>15-Gill light-Demersal fish
VIIH 3 7 42 1-12
>15-Gill light flatfish-Demersal fish
IVB 1 9 69 1-12
>15-TangTram-Crustaceans
VIIE 2 2 12 7-10
>15-TangTram-Crustaceans
VIIG 1 1 10 6-6
>15-TangTram-Demersal fish
Far South
1 3 38 1-2
>15-TangTram-Demersal fish
IVA 6 36 838 3-10
>15-TangTram-Demersal fish
IVB 2 8 64 5-7
Metier
TOTAL FLEET EFFORT TOTAL OBSERVED EFFORT
T yp e o f mo n ito ri n g
Cove
ra ge Fishing Area No of vessels No of trips Days at Sea Se as o n Total length of nets Total soak time No of vessels No of trips Days at Sea Se as o n Total length of nets Total soak time Demersal fish >15-TangTram-Demersal fish
VIIC 2 8 11 6-11
>15-TangTram-Demersal fish
VIIE 3 28 143 1-10
>15-TangTram-Demersal fish
VIIF 3 18 96 3-12
>15-TangTram-Demersal fish
VIIG 6 30 179 3-8 2 3 7
May-Oct
144 11616 SS 4.1%
>15-TangTram-Demersal fish
VIIH 9 47 313 1-12 1 2 3
Oct-Nov
65 3000 SS 0.8%
>15-TangTram-Demersal fish
VIII 3 23 159 1-12
>15-TangTram-Demersal fish
VIIJ 7 23 385 1-12
>15-TangTram-Demersal fish
VIIK 3 20 331 1-12
<15-Drift Oth-Cephalopods
VIIE 2 2 2 9-10
<15-Drift Oth-Crustaceans
IVC 3 7 7 6-10
<15-Drift Oth-Crustaceans
VIID 3 3 3 8-10
<15-Drift Oth-Demersal fish
IVB 1 1 1 7-7
<15-Drift Oth-Demersal fish
IVC 46 658 656 1-12 3 3 3
Mar-Jun
5 5 HDM 0.5%
<15-Drift Oth-Demersal fish
VIIA 3 43 43 1-11
Metier
TOTAL FLEET EFFORT TOTAL OBSERVED EFFORT
T yp e o f mo n ito ri n g
Cove
ra ge Fishing Area No of vessels No of trips Days at Sea Se as o n Total length of nets Total soak time No of vessels No of trips Days at Sea Se as o n Total length of nets Total soak time fish <15-Drift Oth-Demersal fish
VIIE 23 72 72 1-12 1 1 0 Dec 1 1 HDM 0.3%
<15-Drift Oth-Demersal fish
VIIF 6 7 7 1-11
<15-Drift Oth-Demersal fish
VIIG 1 1 1 5-5
<15-Drift Pel-Anadromous
IVB 1 28 28 5-8
<15-Drift Pel-Small pelagic fish
IVC 33 155 155 1-12
<15-Drift Pel-Small pelagic fish
VIA 1 1 22 7-7
<15-Drift Pel-Small pelagic fish
VIID 15 70 70 1-11
<15-Drift Pel-Small pelagic fish
VIIE 48 461 461 1-12
<15-Drift Pel-Small pelagic fish
VIIF 23 70 70 1-12
<15-Gill-Deep-water species
VIID 6 16 16 1-12
<15-Gill-Deep-water species
VIIE 16 53 53 1-12
<15-Gill-Deep-water species
VIIG 1 1 1 8-8
<15-Gill-Demersal fish IVB 16 91 92 1-12
<15-Gill-Demersal fish IVC 52 299 298 1-12 2 2 2
Jan-Dec
5 85 HDM 0.7%
Metier
TOTAL FLEET EFFORT TOTAL OBSERVED EFFORT
T yp e o f mo n ito ri n g
Cove
ra ge Fishing Area No of vessels No of trips Days at Sea Se as o n Total length of nets Total soak time No of vessels No of trips Days at Sea Se as o n Total length of nets Total soak time
<15-Gill-Demersal fish VIIA 9 29 33 1-12
<15-Gill-Demersal fish VIID 150 791 788 1-12
<15-Gill-Demersal fish VIIE 183 1255 1350 1-12 2 7 7
Jan-Dec
10 252 HDM 0.5%
<15-Gill-Demersal fish VIIF 117 790 829 1-12 3 11 14
Jan-Dec
35 605 HDM 1.7%
<15-Gill-Demersal fish VIIG 4 27 74 1-12 1 1 3 Dec 5 85 HDM
& SS
3.8%
<15-Gill-Demersal fish VIIH 2 11 34 4-11
<15-Gill-Demersal fish VIIJ 1 1 8 7-7
<15-Gill-Large Pelagic Fish
VIIE 2 2 2 6-10
<15-Gill-Large Pelagic Fish
VIIF 1 1 2 6-6
<15-Gill Hake-Demersal fish
VIIE 1 2 4 5-6
<15-Gill Hake-Demersal fish
VIIF 2 6 16 1-5
<15-Gill Hake-Demersal fish
VIIG 1 7 29 1-11
<15-Gill Hake-Demersal fish
VIIH 1 2 8 9-12
<15-Gill light-Anadromous
VIIE 1 1 1 6-6
<15-Gill light-Anadromous
VIIF 1 1 1 7-7
<15-Gill light-Cephalopods
IVC 2 3 3 4-7
Metier
TOTAL FLEET EFFORT TOTAL OBSERVED EFFORT
T yp e o f mo n ito ri n g
Cove
ra ge Fishing Area No of vessels No of trips Days at Sea Se as o n Total length of nets Total soak time No of vessels No of trips Days at Sea Se as o n Total length of nets Total soak time Cephalopods <15-Gill light-Cephalopods
VIIE 13 27 27 4-12
<15-Gill light-Cephalopods
VIIF 1 1 1 6-6
<15-Gill light-Demersal fish
IVB 5 26 26 1-12
<15-Gill light-Demersal fish
IVC 90 1108 1099 1-12
<15-Gill light-Demersal fish
VIA 1 3 21 6-6
<15-Gill light-Demersal fish
VIIA 35 385 385 3-11 2 4 4
May-Sep
1 14 HDM 1.0%
<15-Gill light-Demersal fish
VIID 263 3141 3146 1-12 1 1 1 Dec 1 33 HDM 0.0%
<15-Gill light-Demersal fish
VIIE 268 2055 2059 1-12
<15-Gill light-Demersal fish
VIIF 140 1014 1015 1-12 1 9 4
Jan-Dec
12 131 HDM 0.4% <15-Gill light-Demersal
fish
VIIG 17 184 195 1-12
<15-Gill light-Small pelagic fish
IVB 4 18 18 6-7
<15-Gill light-Small pelagic fish
IVC 10 14 14 1-11
<15-Gill light-Small pelagic fish
VIIA 1 2 4
10-10
<15-Gill light-Small
pelagic fish
VIID 30 112 112 1-12
Metier
TOTAL FLEET EFFORT TOTAL OBSERVED EFFORT
T yp e o f mo n ito ri n g
Cove
ra ge Fishing Area No of vessels No of trips Days at Sea Se as o n Total length of nets Total soak time No of vessels No of trips Days at Sea Se as o n Total length of nets Total soak time pelagic fish <15-Gill light-Small pelagic fish
VIIF 48 310 404 1-12 1 2 2 Nov 4 98 HDM 0.4%
<15-Gill light flatfish-Demersal fish
IVB 6 15 15 3-11 1 2 2 Sep 6 105 HDM 13.3%
<15-Gill light flatfish-Demersal fish
IVC 78 1102 1101 1-12 1 1 1 Nov 2 50 HDM 0.1%
<15-Gill light flatfish-Demersal fish
VIIA 13 74 74 2-12 1 2 2
Apr-Jun
1 7 HDM 2.7%
<15-Gill light flatfish-Demersal fish
VIID 240 8944 8951 1-12 10 11 9
Apr-Sep
29 704 HDM 0.1% <15-Gill light
flatfish-Demersal fish
VIIE 156 976 1005 1-12 3 6 3
Mar-Oct
9 260 HDM 0.3% <15-Gill light
flatfish-Demersal fish
VIIF 31 159 159 1-11 2 3 2
Mar-Apr
6 247 HDM 1.3% <15-Gill light
flatfish-Demersal fish
VIIG 1 1 1
11-11
<15-TangTram-Cephalopods
VIID 1 2 2 9-9
<15-TangTram-Cephalopods
VIIE 50 157 157 1-12
<15-TangTram-Cephalopods
VIIF 11 24 24 5-12
<15-TangTram-Crustaceans
IVB 11 85 85 1-12
<15-TangTram-Crustaceans
IVC 22 74 74 1-12
<15-TangTram-Crustaceans
VIA 1 1 36 5-5
Metier
TOTAL FLEET EFFORT TOTAL OBSERVED EFFORT
T yp e o f mo n ito ri n g
Cove
ra ge Fishing Area No of vessels No of trips Days at Sea Se as o n Total length of nets Total soak time No of vessels No of trips Days at Sea Se as o n Total length of nets Total soak time Crustaceans <15-TangTram-Crustaceans
VIID 69 195 195 1-12
<15-TangTram-Crustaceans
VIIE 95 526 583 1-12 2 5 4 Jun-Jul 12 1994 HDM 0.7%
<15-TangTram-Crustaceans
VIIF 78 838 840 1-12 1 2 2 Jun-Jul 3 588 HDM 0.2%
<15-TangTram-Crustaceans
VIIG 2 5 8 4-8
<15-TangTram-Demersal fish
IVB 6 12 12 2-7
<15-TangTram-Demersal fish
IVC 64 399 396 1-12
<15-TangTram-Demersal fish
VIIA 9 60 60 1-11 2 9 10
Apr-Sep
29 2487 HDM 16.7%
<15-TangTram-Demersal fish
VIID 111 460 459 1-12
<15-TangTram-Demersal fish
VIIE 148 1302 1399 1-12 6 56 96
Jan-Dec
459 32443 HDM & SS
6.9%
<15-TangTram-Demersal fish
VIIF 75 793 827 1-12 2 7 5
Mar-Jul
21 1579 HDM 0.7%
<15-TangTram-Demersal fish
VIIG 5 16 82 3-10
<15-TangTram-Demersal fish
VIIH 1 6 28 4-6
6. Estimation of incidental catches
During 2014, cetacean bycatch reported under the protected species bycatch observer scheme included seven harbour porpoises and two common dolphins. Bycatches were reported in the following metiers (Table 6.1).
Table 6.1 Incidental catch rates by fleet segment and target species
Metier Fis h in g A re a M ai n t ar ge t sp ec ie s In ci d en ta lly ca u gh t ce ta ce an sp ec ie s N o o f i n ci d en ts
No of individuals incidentally caught by species
Incidental catch rates: per haul
To ta l i n ci d en ta l ca tc h e sti mate CV With pingers Without pingers With pingers Without pingers <15-GNS-Demersal
VIIA Ray
H arb o u r po rp o ise
1 0 1 0 0.031
<15-GNS-Demersal
VIIE Anglerfish 3 0 3 0 0.020
<15-GNS-Demersal
VIIE Brill 1 0 1 0 0.083
<15-GNS-Demersal
VIIE Turbot 1 0 1 0 0.009
<15-GNS-Demersal
VIIF Anglerfish 1 0 1 0 0.052
Totals and Mean rates 7 0 7 0 0.039
>15-GNS-Demersal
VIIG Hake
Co m m o n D o lp h
in 1 1 0 0.030 0
>15-GNS-Demersal
VIIH Whitefish 1 1 0 0.083 0
No total mortality estimates have been generated by stratum in Table 6.1, as these are too narrowly defined to provide useful estimates of bycatch, and because care is needed in interpreting the bycatch rates in pingered vs. unpingered nets and how these are extrapolated to the total fleet in the absence of information on how pingers were actually being used during fishing operations that were not observed.
Instead synoptic estimates of bycatch of harbour porpoises, dolphins and seals are presented in Annex 2 of the report, based on a larger sample size of observations made over several years and in a wider range of metiers.
Two common dolphin bycatches were recorded from net fleets equipped with DDD pingers, but the majority of hauls observed in these metiers were using pingers, so the comparable rate in
unpingered nets at the same time is not known. Furthermore both bycatches were in nets that were more than 4km in length.
6.1 Recording of incidental catches
As in previous years, all bycatches were recorded according to standard data collection procedures by experienced on-board fishery observers. Not all hauls are observed on all trips, especially when hauling is more or less continuous. Wherever feasible, bycaught specimens were sampled at sea (external measurements including length, girth and sex determination and blubber thickness were recorded and teeth and skin samples were collected for age determination and genetic analysis) and some other whole marine mammal specimens (3 grey seals and one porpoise) were returned to shore for more detailed analysis under a complementary sub-project.
During 2014, dedicated sampling effort fell slightly below previous years’ levels when target levels have consistently been exceeded. In 2014 a total of 302 dedicated sampling days at sea were achieved on pelagic trawlers, netters and long-liners. These were augmented with 112 selected but non-dedicated days at sea on netters observed by Cefas under the discard programme, meaning a total of 414 days (target 425) days were sampled on pelagic trawlers, netters and longliners. Additionally we have reviewed and tabulated data from a further 898 discard sampling days conducted by AFBINI and Cefas on a variety of other vessel types (See Annex 1). Two further dedicated sampling days were done by SMRU observers on other gear types. We rely solely on the dedicated protected species trips to estimate bycatch rates and produce bycatch estimates for protected species, but the additional discard sampling days are useful to screen other fisheries and areas for potential protected species bycatches that may warrant further focus.
7. Discussion
7.1 Marine mammals
previous years under the bycatch programme annual targets have been exceeded. Sampling in 2014 consisted of 55 days on pelagic trawlers, 320 on gillnetters and 39 days on longliners. Sampling in the main pelagic trawl fisheries for mackerel and herring has been reduced to a lower level than in preceding years (55 cf 101 days in 2013). The almost complete absence of a bass pair trawl fishery during 2014 was also partly responsible for this relatively low level of sampling effort on this gear type in 2014.
Marine mammals recorded included six grey seals, seven harbour porpoises, and two common dolphins. No marine mammal bycatches were observed in pelagic trawls. Details of estimates of total bycatch of marine mammals in gillnet fisheries are given in Annex 2. Porpoise bycatches in 2014 were all in large mesh tangle/trammel net fisheries targeting several species (turbot, brill, ray, and monkfish). Common dolphin bycatches were all in offshore gillnets set for hake and gadoids. Seal bycatches were in inshore tangle nets and offshore trammel nets.
7.2 Other species
During 2014 we increased our monitoring of longlines to some extent (39 days: 9% of total), specifically with an interest in seabird bycatch. Fulmars appear to be the species most frequently taken in UK registered longline operations that operate mainly in VIA northwest of Scotland (Table 7.1). Elsewhere, guillemots were the most frequently bycaught seabird species, as in previous years, mostly taken in standard (i.e. relatively small meshed) gillnets (Table 7.2). Two gull species and a single great northern diver were also reported (Tables 7.1 & 7.2).
At least six large or prohibited species of shark were recorded, with spurdog, tope and porbeagle dominating the numbers; these were taken in most types of static gear (but noticeably few in tangle nets: Table 7.2). By contrast bycatches of skates were heavily concentrated in trammel nets, with the greatest number of records of common skate and undulate rays. Two shads (spp IND) were also recorded (Tables 7.1 & 7.2).
Although we continue to refrain from extrapolating our seabird bycatch observations, because of concerns over the representativeness of the sampling, we have performed some preliminary analyses in a separate study to examine the distribution of observed seabird bycatch rates and seabird densities to try and identify areas off the South Coast of England that might require further monitoring. Two general areas were identified as candidates for increased seabird bycatch
[image:22.595.78.522.638.769.2]monitoring coverage (Coram et al 2015).
Table 7.1 – Species of possible conservation concern identified during 2014 bycatch observations- individuals by ICES Division (numbers of individuals observed)
Species of potential conservation concern
IVA IVB VIA VIIA VIID VIIE VIIF VIIG VIIH VIIJ Total
Seabirds
Fulmar 6 113 119
Great black-backed gull 1 1
Great northern diver 1 1
Guillemot 1 2 5 8
Sharks
Angel shark 2 2
Blue Shark 2 4 9 8 23 Porbeagle shark 12 46 58
Six-gilled shark 2 2
Spurdog 215 215
Tope 3 11 14 53 81
Skates Black skate 24 24
Common skate complex 12 10 124 146
Long-nosed skate 1 1 2
Undulate ray 14 105 119
Other fish Shad spp. 1 1 2
[image:23.595.78.521.70.308.2]Total 6 2 114 2 15 113 244 65 235 8 804 Table 7.2Species of possible conservation concern identified during 2014 bycatch observations- individuals by gear type (numbers of individuals observed). Species of potential conservation concern Gillnet Long line Tangle net Trammel net Wreck net Total Seabirds Fulmar 119 119
Great black-backed gull 1 1
Great northern diver 1 1
Guillemot 8 8
Herring gull 1 1
Sharks Angel shark 2 2
Blue Shark 5 8 10 23
Porbeagle shark 39 13 6 58 Six-gilled shark 1 1 2
Spurdog 215 215 Tope 34 5 20 22 81 Skates Black skate 24 24
Common skate complex 146 146
Long-nosed skate 2 2
Undulate ray 9 110 119 Other fish
Shad spp. 1 1 2
8. Conclusions
Sampling remains focused in the Celtic Sea and English Channel, but increased sampling in 2014 was achieved in static net fisheries in the Irish Sea and in longline fisheries off the northwest of Scotland. The continuing monitoring focus in the southwest reflects our perception that this is the area where most marine mammal bycatch occurs in the UK. This is driven by the overlap of high levels of netting effort and relatively high densities of some mammal species. Sampling over a wider area will be needed to address uncertainties in bycatch rates elsewhere.
Annex 1: Other dedicated and non-dedicated sampling.
[image:25.595.68.530.192.380.2]A1.1: Other dedicated sampling of gear types not required under 812/2004
or 92/43/EEC
Table A1.1: Dedicated monitoring effort not required under 812/2004 or 92/43/EEC.
C atego ry N an tes Ty p e M eti er G ro u p Ta rg et G ro u p IC ES DI V IS IO N V es se ls Tr ip s Da ys at Se a Ha u ls Se as o n M amm al B yc atc h Se ab ir d B yc atc h
<15 FPO Pots and Traps
Shellfish IVb 1 1 1 2 Sep 0 0
<15 OTB Bottom Otter Trawl
Demersal fish
VIIe 1 1 1 2 Mar 0 0
>15 LLS Longlines Demersal fish
IVa 1 1 9 5 Nov 0 6 VIa 1 3 21 15 Aug 0 114 VIIj 1 1 9 13 Oct 0 0
TOTAL 41 37 0 120
Two strings of lobster pots and two demersal trawl hauls were monitored opportunistically. Observers are instructed to record data in such instances even though pots and demersal trawls are not a gear type of direct interest to the bycatch monitoring programme at this time.
Five longline trips were also monitored for a total of 39 days, resulting in 120 seabird bycatch records.
A1.2: Non-dedicated sampling.
A further 898 non-dedicated monitoring days were conducted during 2014 on a variety of demersal trawl gear types under the English (Cefas) and Northern Irish (AFBINI) discard sampling programmes (Table A1.2). These data are not incorporated into our annual marine mammal bycatch estimates because we cannot be sure that all bycatches would have been seen or recorded by discard officers as they have different work patterns and commitments while on deck compared with dedicated bycatch observers. Nevertheless these data are summarised and included in the report because they may provide an initial insight into the potential for cetacean bycatch to occur in gear types not routinely covered by dedicated monitoring under 812/2004 and the Habitats Directive.
programme and from which we have several records of cetacean bycatch occurring in 2014 (26 in 2013 – 9 in 2014). A similar pattern was evident in 2011 and 2012, so this year we have carried out a more detailed comparative analysis of bycatch rates calculated from data collected through
[image:26.595.70.530.201.780.2]dedicated and non-dedicated monitoring and results are presented in the following section (A1.3).
Table A1.2: Non-dedicated sampling conducted by collaborating institutions under DCF and other programmes.
Gear Group
Gear Type Area Target Days Hauls Dolphin Porpoise Contractor
Demersal Trawl
Beam IVC Brown Crab
1 4 0 0 Cefas
Demersal Trawl
Beam IVC Brown shrimp
3 18 0 0 Cefas
Demersal Trawl
Beam VIID Dover sole 1 5 0 0 Cefas
Demersal Trawl
Beam VIID not recorded
8 60 0 0 Cefas
Demersal Trawl
Beam VIIE Anglerfish 27 161 0 0 Cefas
Demersal Trawl
Beam VIIE Cuttlefish 14 108 0 0 Cefas
Demersal Trawl
Beam VIIE Dover sole 4 28 0 0 Cefas
Demersal Trawl
Beam VIIE Lemon sole
10 89 0 0 Cefas
Demersal Trawl
Beam VIIE Megrim 10 50 0 0 Cefas
Demersal Trawl
Beam VIIE not recorded
11 54 0 0 Cefas
Demersal Trawl
Beam VIIF Anglerfish 16 108 0 0 Cefas
Demersal Trawl
Beam VIIG Anglerfish 6 26 0 0 Cefas
Demersal Trawl
Beam VIIG Megrim 10 50 0 0 Cefas
Demersal Trawl
Beam VIIH Anglerfish 44 255 0 0 Cefas
Demersal Trawl
Beam VIIH Megrim 35 172 0 0 Cefas
Demersal Trawl
Beam VIIH not recorded
5 17 0 0 Cefas
Demersal Trawl
Dredge VIA Scallop 7 7 0 0 AFBINI
Demersal Trawl
Dredge VIIA Scallop 14 119 0 0 AFBINI
Demersal Trawl
Dredge VIID Scallop 1 6 0 0 Cefas
Demersal Trawl
Dredge VIIE not recorded
Demersal Trawl
Dredge VIIE Scallop 15 102 0 0 Cefas
Demersal Trawl
Fly seine VIIA Whitefish 6 30 0 0 AFBINI
Demersal Trawl
Mid water demersal
VIIA Nephrops 15 22 0 0 AFBINI
Demersal Trawl
Mid water demersal
VIIA Whitefish 102 163 0 0 AFBINI
Demersal Trawl
Otter IVB Bass 1 2 0 0 Cefas
Demersal Trawl
Otter IVB Cod 1 2 0 0 Cefas
Demersal Trawl
Otter IVB Dover sole 2 5 0 0 Cefas
Demersal Trawl
Otter IVB Nephrops 1 2 0 0 Cefas
Demersal Trawl
Otter IVB not recorded
1 2 0 0 Cefas
Demersal Trawl
Otter IVB Whiting 3 8 0 0 Cefas
Demersal Trawl
Otter IVC Dover sole 1 4 0 0 Cefas
Demersal Trawl
Otter VIIA Cod 1 1 0 0 Cefas
Demersal Trawl
Otter VIIA not recorded
2 5 0 0 Cefas
Demersal Trawl
Otter VIIA Skate 1 2 0 0 Cefas
Demersal Trawl
Otter VIID Lemon sole
2 3 0 0 Cefas
Demersal Trawl
Otter VIID not recorded
1 2 0 0 Cefas
Demersal Trawl
Otter VIID Plaice 1 4 0 0 Cefas
Demersal Trawl
Otter VIIE Brill 1 3 0 0 Cefas
Demersal Trawl
Otter VIIE Cuttlefish 2 5 0 0 Cefas
Demersal Trawl
Otter VIIE John Dory 4 14 0 0 Cefas
Demersal Trawl
Otter VIIE Lemon sole
12 34 0 0 Cefas
Demersal Trawl
Otter VIIE not recorded
8 23 0 0 Cefas
Demersal Trawl
Otter VIIE Plaice 4 11 0 0 Cefas
Demersal Trawl
Otter VIIE Ray 1 5 0 0 Cefas
Demersal Trawl
Otter VIIE Squid 3 11 0 0 Cefas
Trawl Nephrops Demersal
Trawl
Single Nephrops
IVB Nephrops 7 11 0 0 Cefas
Demersal Trawl
Single Nephrops
IVB not recorded
1 2 0 0 Cefas
Demersal Trawl
Single Nephrops
VIA Nephrops 12 40 0 0 AFBINI
Demersal Trawl
Single Nephrops
VIIA Nephrops 3 4 0 0 Cefas
Demersal Trawl
Single Nephrops
VIIA Nephrops 137 450 0 0 AFBINI
Demersal Trawl
Twin Nephrops
IVB Nephrops 3 4 0 0 Cefas
Demersal Trawl
Twin Nephrops
VIA Nephrops 60 147 0 0 AFBINI
Demersal Trawl
Twin Nephrops
VIIA Nephrops 202 567 0 0 AFBINI
Demersal Trawl
Twin Otter
IVC Cod 1 3 0 0 Cefas
Demersal Trawl
Twin Otter
VIIE Cuttlefish 1 2 0 0 Cefas
Demersal Trawl
Twin Otter
VIIE Haddock 9 18 0 0 Cefas
Demersal Trawl
Twin Otter
VIIE Lemon sole
3 10 0 0 Cefas
Demersal Trawl
Twin Otter
VIIE not recorded
2 5 0 0 Cefas
Encircling Net
Ring Net VIIE Pilchard 2 1 0 0 Cefas
Lines Handline VIID Bass 1 1 0 0 Cefas Lines Handline VIIE Bass 2 4 0 0 Cefas Lines Handline VIIE not
recorded
1 4 0 0 Cefas
Lines Handline VIIE Pollack 4 16 0 0 Cefas Lines Handline VIIE Whiting 1 7 0 0 Cefas Lines Handline VIIH Pollack 3 10 0 0 Cefas Lines Longline VIIE Plaice 6 5 0 0 Cefas Midwater
Trawl
Midwater VIIE Sprat 1 1 0 0 Cefas
Drift Net Drift VIIA Bass 4 8 0 0 Cefas Static Net Gill IVC Cod 2 4 0 0 Cefas Static Net Gill VIIA Ray 1 2 0 0 Cefas Static Net Gill VIID Dover sole 2 5 0 0 Cefas Static Net Gill VIIE Bass 2 4 0 0 Cefas Static Net Gill VIIE Gurnard 5 6 0 0 Cefas Static Net Gill VIIE Haddock 6 10 0 0 Cefas Static Net Gill VIIE Ling 1 5 0 0 Cefas Static Net Gill VIIE Mullet 1 2 0 0 Cefas Static Net Gill VIIE not
recorded
1 10 0 0 Cefas
Static Net Gill VIIF Haddock 1 2 0 0 Cefas Static Net Gill VIIF Ling 1 5 0 0 Cefas Static Net Gill VIIG Cod 4 14 0 0 Cefas Static Net Gill VIIH Pollack 6 30 0 0 Cefas Static Net Tangle /
Trammel
VIIA not recorded
1 3 0 0 Cefas
Static Net Tangle / Trammel
VIID Bass 2 3 0 0 Cefas
Static Net Tangle / Trammel
VIID Dover sole 12 39 0 0 Cefas
Static Net Tangle / Trammel
VIID Plaice 6 6 0 0 Cefas
Static Net Tangle / Trammel
VIIE Anglerfish 2 5 0 0 Cefas
Static Net Tangle / Trammel
VIIE Crayfish 2 8 0 0 Cefas
Static Net Tangle / Trammel
VIIE Gurnard 5 6 0 0 Cefas
Static Net Tangle / Trammel
VIIE Haddock 4 6 0 0 Cefas
Static Net Tangle / Trammel
VIIE not recorded
1 2 0 0 Cefas
Static Net Tangle / Trammel
VIIE Plaice 6 5 0 0 Cefas
Static Net Tangle / Trammel
VIIE Turbot 6 8 0 0 Cefas
Static Net Tangle / Trammel
VIIF Crayfish 6 7 0 0 Cefas
Static Net Tangle / Trammel
VIIF Dover sole 4 14 0 0 Cefas
Static Net Tangle / Trammel
VIIF not recorded
1 4 0 0 Cefas
Static Net Tangle / Trammel
VIIF Skate 2 6 0 0 Cefas
Static Net Tangle / Trammel
VIIG Cod 4 14 0 0 Cefas
TOTAL 1010 3464 0 0
A1.3: A comparison of dedicated and non-dedicated bycatch sampling.
In the previous three 812/2004 annual reports (covering 2011-2013 sampling) to the Commission, we have provided comparisons of cetacean bycatch rates produced with data collected under the dedicated bycatch programme with rates produced from data collected primarily from sampling conducted under the DCF. In the 2013 report specifically, we provided a more focussed analysis by comparing rates only from static net fisheries in Subarea VII over the 2011 to 2013 period, because several of those fisheries were monitored under both programmes and thus provide a better basis for comparison. The result of that analysis, which did not stratify the data by specific net type and/or area, showed that the overall cetacean bycatch rate (0.025 animals per haul) in Subarea VII
the rate calculated using non-dedicated observations (0.007 per haul) over the same period andarea (Northridge et al, 2014). We suggested that this difference was likely to be influenced by a number of factors, including which specific fisheries were monitored and the on deck sampling duties of observers under each programme.
Given current uncertainties about the future direction of protected species (PET) bycatch monitoring and signals from the Commission that PET bycatch monitoring may eventually be subsumed into the DCF, this year we have undertaken a more widespread (extended to Subareas IV, VI, VII & VIII) and longer term (2005 to 2014) analysis of static net data, which we have stratified by broad gear type and area (ICES division). This analysis provides a more robust assessment of potential differences in marine mammal (cetacean and seal) bycatch rates calculated from data originating from the different data collection programmes.
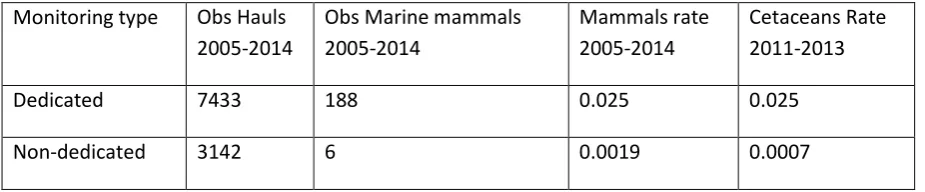
[image:30.595.71.534.358.454.2]Table A1.3 provides a summary of sampling levels, observed marine mammal bycatches under each programme and an initial comparison of overall bycatch rates calculated from the 10 year and 3 year data time series. We have used the same method of calculation for each dataset but have included seals and Subareas IV, VI & VIII in the broader 10 year analysis.
Table A1.3: Overall bycatch rates
Monitoring type Obs Hauls 2005-2014
Obs Marine mammals 2005-2014
Mammals rate 2005-2014
Cetaceans Rate 2011-2013
Dedicated 7433 188 0.025 0.025
Non-dedicated 3142 6 0.0019 0.0007
The numbers in Table A1.3 show that the bycatch rate calculated from dedicated sampling was relatively consistent over the two time periods at 0.025 animals per haul, despite seals and a much wider area being included in the 10 year dataset, whereas the rate calculated from non-dedicated data is almost three times higher over the longer time period. The three-fold increase (which results from 3 bycatch records from 2009/2010) in the non-dedicated rate leads to a reduction in the difference between rates calculated from each programme, from thirty-six times higher in dedicated sampling over the 3 year period to thirteen times higher over the 10 year period.
Figure A1.4: Gillnet bycatch rates calculated from dedicated and non-dedicated monitoring.
Figure A1.5: Tangle/trammel net bycatch rates calculated from dedicated and non-dedicated monitoring.
We then compared the bycatch rate distributions for each gear type using non-parametric tests (as the data do not follow the normal distribution). The results were values of P=0.028 for the gillnet dataset and P=0.012 for tangle/trammel nets respectively. Both are statistically significant results and demonstrate that differences exist between the calculated marine mammal bycatch rates under each data collection programme. We stratified the data in an equivalent way for each dataset and there was sampling in the majority of metiers under each programme (though not always observed bycatches), so the resulting difference in bycatch rates is likely to be largelydriven by differences in
0 0.01 0.02 0.03 0.04 0.05
IVB IVC VIA VIIA VIID VIIE VIIF VIIG VIIH VIIJ
Gill net bycatch rates by ICES division
Dedicated
Non-dedicated
0 0.01 0.02 0.03 0.04 0.05 0.06 0.07
IVA IVB IVC VIB VIIA VIID VIIE VIIF VIIG VIIH VIIIa
Tangle/trammel net bycatch rates by ICES division
Dedicated
[image:31.595.72.492.358.584.2]on-board sampling protocols rather than underlying differences in bycatch rates in the various fisheries sampled under each programme. This suggests that attempts to provide accurate advice about fisheries impacts on marine mammals in particular (and potentially other PET species) would be significantly hampered if only data collected under the DCF in its current form was used.