Research papers
Soil seal development under simulated rainfall: Structural, physical and
hydrological dynamics
Elena Armenise
a,⇑, Robert W. Simmons
a,⇑, Sujung Ahn
b, Amin Garbout
c, Stefan H. Doerr
b,
Sacha J. Mooney
c, Craig J. Sturrock
c, Karl Ritz
c,aa
School of Energy, Environment, and Agrifood, Cranfield University, Bedford, UK
b
Department of Geography, College of Science, Swansea University, Singleton Park, UK
c
School of Biosciences, University of Nottingham, Sutton Bonington, Nottingham, UK
a r t i c l e i n f o
Article history:
Received 7 April 2017
Received in revised form 20 July 2017 Accepted 29 October 2017
Available online 1 November 2017 This manuscript was handled by Marco Borga, Editor-in-Chief, with the assistance of Venkat Lakshmi, Associate Editor
Keywords:
Soil structural seal
Seal/crust thickness quantification X-ray Computed Tomography (CT) Unsaturated hydraulic conductivity (Kun)
Soil water repellency Simulated rainfall
a b s t r a c t
This study delivers new insights into rainfall-induced seal formation through a novel approach in the use of X-ray Computed Tomography (CT). Up to now seal and crust thickness have been directly quantified mainly through visual examination of sealed/crusted surfaces, and there has been no quantitative method to estimate this important property. X-ray CT images were quantitatively analysed to derive for-mal measures of seal and crust thickness. A factorial experiment was established in the laboratory using open-topped microcosms packed with soil. The factors investigated were soil type (three soils: silty clay loam – ZCL, sandy silt loam – SZL, sandy loam – SL) and rainfall duration (2–14 min). Surface seal forma-tion was induced by applying artificial rainfall events, characterised by variable duraforma-tion, but constant kinetic energy, intensity, and raindrop size distribution. Soil porosities derived from CT scans were used to quantify the thickness of the rainfall-induced surface seals and reveal temporal seal micro-morphological variations with increasing rainfall duration. In addition, the water repellency and infiltra-tion dynamics of the developing seals were investigated by measuring water drop penetrainfiltra-tion time (WDPT) and unsaturated hydraulic conductivity (Kun). The range of seal thicknesses detected varied from 0.6 to 5.4 mm. Soil textural characteristics and OM content played a central role in the development of rainfall-induced seals, with coarser soil particles and lower OM content resulting in thicker seals. Two dif-ferent trends in soil porosity vs. depth were identified:i) for SL soil porosity was lowest at the immediate soil surface, it then increased constantly with depth till the median porosity of undisturbed soil was equalled;ii) for ZCL and SL the highest reduction in porosity, as compared to the median porosity of undisturbed soil, was observed in a well-defined zone of maximum porosity reduction c. 0.24–0.48 mm below the soil surface. This contrasting behaviour was related to different dynamics and processes of seal formation which depended on the soil properties. The impact of rainfall-induced surface sealing on the hydrological behaviour of soil (as represented by WDTP and Kun) was rapid and substantial: an average 60% reduction in Kunoccurred for all soils between 2 and 9 min rainfall, and water repellent sur-faces were identified for SZL and ZCL. This highlights that the condition of the immediate surface of agri-cultural soils involving rainfall-induced structural seals has a strong impact in the overall ability of soil to function as water reservoir.
Ó2017 The Authors. Published by Elsevier B.V. This is an open access article under the CC BY license (http:// creativecommons.org/licenses/by/4.0/).
1. Introduction
A soil crust is a thin layer of consolidated material at the imme-diate soil surface with significantly different structural and mechanical characteristics than the underlying zone, which devel-ops as result of temporal and spatial interactions between physical, biological and chemical properties and processes (Assouline, 2004; Bajracharya and Lal, 1999; Neave and Rayburg, 2007). In general, two broad classes of soil crusts are distinguished based on their predominant mechanism of formation,viz.biological and physical.
https://doi.org/10.1016/j.jhydrol.2017.10.073
0022-1694/Ó2017 The Authors. Published by Elsevier B.V.
This is an open access article under the CC BY license (http://creativecommons.org/licenses/by/4.0/).
⇑ Corresponding authors at: Environment Agency, Guildbourne House, Chats-worth Road, Worthing, Sussex, BN11 1LD, UK (E. Armenise). Cranfield University, School of Water, Energy and Environment, Building 52a, Cranfield, Bedfordshire, MK43 0AL, UK (R.W. Simmons).
E-mail addresses :[email protected](E. Arme-nise),[email protected](R.W. Simmons).
Contents lists available atScienceDirect
Journal of Hydrology
Biological soil crusts develop from the intimate association between soil particles and microorganisms such as cyanobacteria, green algae, fungi, bacteria, lichens and bryophytes, which live within or immediately on top of the uppermost millimetres of soil (Belnap and Gardner, 1993). They are typical of arid and semi-arid regions but can occur in most ecosystems (Bowker et al., 2010; Jeffery et al., 2009; Knapen et al., 2007). In contrast, physical crusts have a physicochemical origin (Neave and Rayburg, 2007). Rainfall impacting on the soil surface is one of the major drivers for phys-ical seal formation. The kinetic energy associated with raindrop impacts destroys soil aggregates with concomitant compaction, slaking, physico-chemical dispersion and particle re-organization. Porosity at the immediate soil surface is significantly reduced through the in-filling and clogging of pores due to the wash-in of fine material, compaction associated with raindrop impacts, and deposition of clay particles at the immediate soil surface post-rainfall (Assouline, 2004). This gives rise to astructural seal. Dehy-dration of this rainfall-induced seal results in the formation of a structural crust. Throughout this paper the term seal is used when referring to the wetting phase, and crust when reference is made to the dehydrated seal.
The soil water reservoir is a major component of water storage within a catchment. Any alteration of the hydraulic structure of soils has great impacts on evapotranspiration, soil moisture con-tent, groundwater recharge, runoff processes and river flow, and in turn largely influences the catchment water balance. Soil crusts, either biological or physical, are extremely frequent both on culti-vated (Bajracharya and Lal, 1999; Bedaiwy, 2008; Knapen et al., 2007) and uncultivated soils (Menon et al., 2011). Therefore, the response of the soil surface to rainfall can have a significant impact on hydrological and ecological processes (Assouline et al., 2015). Recent record-breaking weather phenomena and flooding events in the UK and across Europe (Slingo et al., 2014; Schneider et al., 2013) have renewed interest on the possible links between agricul-tural land management and flooding. In this context, the effects of biological and/or physical sealing on agricultural soils and its implications for downstream flood risk could be of major significance.
Hydrological models are regularly used for flood forecasting. At the basis of hydrological modelling is the rainfall-runoff relation-ship of the catchment. This is a highly complex and non-linear hydrological phenomenon (Chen and Adams, 2006; Modarres and Ouarda, 2013) that describes the transformation of precipitation into discharge (Wagener and Wheater, 2004). The presence of a bio-logical and/or physical seal/crust on the soil surface modifies the partitioning between infiltration and runoff and adds extra com-plexity to the system.Chen et al. (2013)applied a rainfall-runoff model to analyse the respective role of several factors, including the presence of a physical seal layer, on the hydrological response of a semiarid hillslope. They found that the seal layer controlled runoff generation to such an extent that runoff was not generated when the seal was excluded from the simulation.Assouline and Mualem (2006)investigated the combined effect of soil hetero-geneity and surface seal formation on the rainfall-runoff relation-ship of a small hypothetical bare catchment and showed that soil sealing had a bigger impact on runoff than soil heterogeneity.
The thickness of the disturbed layer is a key feature of a sealed surface, which allows estimation of the extent of the impact of the sealing phenomenon. Wide ranges in seal thickness have been reported in the literature. Visual examination and measurement of the sealed/crusted surface, either directly with Vernier calipers (Bedaiwy, 2008; Roth, 1997), or via microphotographs (Bresson and Boiffin, 1990; Bu et al., 2013), have been primarily used to directly quantify seal and crust thickness. However, the risk with any visual assessment method is an underestimation of the thick-ness of the disturbed layer, whilst the unobserved remaining
dis-turbed part can still affect the flow processes in the upper soil layer.Bresson et al. (2004) showed the potential of X-ray tech-niques to characterise the bulk densit, of structural crusts. Here we describe the development of a method for a formally prescribed quantification of soil seal thickness which uses X-ray Computed Tomography (CT) data in an innovative way and enables a non-subjective assessment of seal formation and consolidation.
One of the principal constraints when describing and character-ising sealed soils is the temporal and spatial variability of physical seal hydraulic properties and associated seal structure (Augeard et al., 2007). To overcome this limitation,Assouline and Mualem (1997, 2000)developed and tested a model for soil sealing that takes into account several soil- and rainfall-related factors involved in seal formation. This model provided a much-needed theoretical basis for interpreting results from infiltration experiments in sealed soils and was successfully applied to simulate flow pro-cesses under sealing conditions. Small-scale experiments with sim-ulated rainfall have shown that relatively stable seals might form in a relatively short time (Bu et al., 2013; Neave and Rayburg, 2007). Nevertheless, beyond this time seal development might continue, and a dynamic balance between seal destruction and for-mation might be established. With regards to spatial variability, it is likely that gradual changes of structure within the seal are more likely to occur rather than the two discrete-layer structure firstly described byMcIntyre (1958a,b). Over the last few decades several studies have been conducted to investigate the processes and fac-tors involved in seal formation (see Assouline, 2004). However, experiments that provide additional evidence of the micro-scale modifications of soil surface structure and wider implications for soil hydrodynamics at the initial stages of seal formation are still required. Accordingly, we conducted a laboratory experiment and induced surface seal development in three agricultural soils of con-trasting texture with controlled rainfall events of constant inten-sity and kinetic energy (KE) and short storm duration time increments. Micro-morphological zones within the seal were identified non-destructively using X-ray CT and the micro-morphological characteristics of the seal quantified. Hydrological characterisation of the developing seals was conducted by measur-ing water repellency, a common feature of many soils (Doerr et al., 2000) and previously observed on soil crusts (Fischer et al., 2010), and by quantifying water infiltration dynamics.
2. Materials and methods
2.1. Soil sampling and preparation
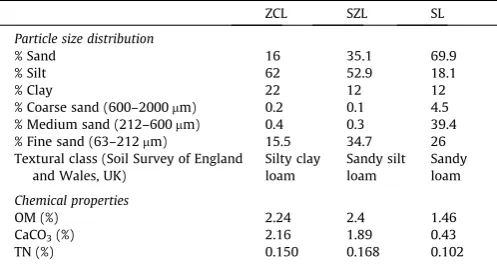
Three soils of contrasting chemical and physical properties (a silty clay loam, sandy silt loam and sandy loam, denoted ZCL, SZL, SL hereafter;Table 1) were sampled from fields used in
inten-Table 1
Selected soils chemical and physical characteristics.
ZCL SZL SL
Particle size distribution
% Sand 16 35.1 69.9
% Silt 62 52.9 18.1
% Clay 22 12 12
% Coarse sand (600–2000mm) 0.2 0.1 4.5 % Medium sand (212–600mm) 0.4 0.3 39.4 % Fine sand (63–212mm) 15.5 34.7 26 Textural class (Soil Survey of England
and Wales, UK)
Silty clay loam
Sandy silt loam
Sandy loam
Chemical properties
OM (%) 2.24 2.4 1.46
CaCO3(%) 2.16 1.89 0.43
[image:2.595.303.552.620.753.2]sive horticultural production and known to be susceptible to sur-face sealing. The fields were situated at three different locations in the UK. The ZCL and SZL were obtained from Butterwick (52°
5901200N, 0°30 3300E) and Wragg Marsh Spalding (52°4905000 N, 0°503200W), Lincolnshire and classified as Wisbech series (Soil Sur-vey of England and Wales) and Wisbech/Agney series respectively. SL was classified as Eardiston series, and sampled from Coughton, Ross-on-Wye, Herefordshire (51°5304300N, 2°3305000W). For each soil, a randomly selected 5-point bulk composite sample (60 kg) was collected (0–30 cm depth). Soil was stored overnight at 10
°C, and then sieved moist to <2 mm. Sieved soil was stored at 4
°C until required.
Open-topped microcosms were constructed using 50 mm lengths of 46 mm internal diameter PVC pipe. A nylon mesh (1 mm aperture) was glued to the bottom of the microcosm. Each microcosm was packed with fresh soil at a bulk density of 1.2 g cm3. A factorial experimental design was implemented using
the three soil types, subjected to four rainfall durations up to 14 min maximum (see below) and three types of analysis (unsatu-rated hydraulic conductivity, X-ray CT and water repellency), each applied to three independent replicates (total n = 108).
2.2. Simulated rainfall application
A rainfall tower was used to generate artificial rainfall which reproduces the physical characteristics of natural rainfall under controlled laboratory conditions in relation to drop-size distribu-tion, kinetic energy (KE) and intensity. The rainfall simulator con-sisted of a 0.5 m2bed of hypodermic needles (BD Microlance 3, 21
g, 0.840 mm) arranged in an offset 2.02.5 cm grid, sited at 8.8 m elevation above the plane of impact (Withers et al., 2007). A stainless steel 4.0 mm aperture mesh was located 1 m below the needle bed to break up the rain droplets to produce a randomly-distributed range of droplet sizes. A constant head of 15 mm reverse osmosis (RO) treated water above the needle drain points was created in the needle bed, and the spatial arrangement of water-releasing hypodermic needles changed until a uniform and replicable rainfall intensity, drop size distribution and KE was achieved.
Drop size distribution and drop fall velocities were quantified with a laser optical disdrometer (LOD, model OTT-Parsivel 2, OTT Messtechnik, Kempten, Germany). The LOD was positioned at five locations within the experimental area (front, middle, back, left and right). For each point four measurements, of 60 s duration were taken.
The temporal development of structural seals was induced by applying a controlled rainfall event of intensity 60 mm h1 and
KE of 18.4 J m2mm1for either 2, 5, 9, or 14 min duration
(here-after denoted D2, D5, D9, D14, were D abbreviates ‘duration’). This frequency of measurement was chosen to characterise the most dynamic stages of seal formation, namely aggregate breakdown and particle re-organization. Drop size ranged from 0.063 to 3.75 mm with a median drop size (D50) of 2.04 mm.
2.3. Unsaturated hydraulic conductivity analysis
Philip (1957, 1969) presented the first analytical solution to Richards’ equation for vertical and horizontal infiltration. This has an infinite series solution for cumulative infiltration that is a function of time. However, for simplification, the infinite series solution is approximated by retaining only the first two terms in the infinite series resulting in the following equation:
IðtÞ ¼A0t1=2þKt ð1Þ
whereI(t) is the cumulative infiltration at time t,A0is the soil
sorp-tivity, andKis the soil hydraulic conductivity.
An infiltration experiment using a mini disk infiltrometer (Decagon Devices, Washington, USA) was conducted in the labora-tory. Soil cores were placed on a sand table set to a pressure head (h) of 0.03 m and the mini disk infiltrometer, adjusted to the same pressure head value, was used to supply water to the top of each core. Prior to analysis, the samples were kept on the sand table for 24 h in order to equilibrate their matric potential. A thin layer of sand (Garside 80EW, Leighton Buzzard, UK) was applied to the soil surface to increase contact with the disk of the mini-disk infiltrometer. The infiltrometer was carefully placed on the contact sand and held in place with a ring stand and clamp. The elapsed time and the water level in the reservoir of the mini disk infiltrometer were recorded at predetermined time intervals up to 2 h. Philip infiltration model was then fitted to the measured infiltration data using nonlinear parameter optimization in excel and the unsaturated K was derived.
Capillary theory can be used to estimate the size of pores excluded from the transmission of infiltrating water at differing pressure heads (Sauer and Logsdon, 2002). Assuming the pores are cylindrical, for a certain pressure head (h) the pore radii can be predicted from:
r¼ 2
r
cosa
q
gh ð2Þwhere
r
is the surface tension of water (assumed to be 0.073 N m1),a
is the contact angle between water and the pore wall (assumed = 0°),a
is the density of water (Mg m3), andgis the gravitationalacceleration (9.8 m s2). From Equation 2, a pressure head of
0.03 m would exclude pores with diameters equal to or larger than 1.0 mm diameter.Luxmoore (1981)classified pore sizes of <10mm as micropores, from 10 to 1000mm as mesopores and > 1000mm as macropores. According to this classification, measurements of unsaturated hydraulic conductivity at a pressure head of0.03 m will give an estimate of the flow through meso- and micropores.
2.4. Assessment of soil water repellency
The soil cores were equilibrated to a constant temperature and relative humidity (20 ± 1°C, RH 50 ± 10%) for 24 h and water drop penetration time (WDPT) tests (Doerr, 1998) were performed under these same conditions. The surface of each soil core was divided into six parts using a pie-shaped frame, of which three sec-tions were used for WDPT test for the wet surface and another three for the dry surface. Three drops of distilled water (20
l
l) were dispensed using a fixed-volume pipette (Multipette Plus, Eppendorf, Germany). Water was slowly dispensed to make a drop hang on the tip of the pipette, which was then placed carefully on the soil surface to avoid any forced-penetration by a high kinetic energy of the water drop. After a set of WDPT tests for wet surfaces, all samples were dried in a dry oven (25 ± 5°C) for 48 h. Another set of WDPT tests for dry surfaces was conducted on the unused areas, using the same WDPT procedures.2.5. X-ray Computed Tomography
Reconstruc-tion of the projecReconstruc-tion images to produce three dimensional (3-D) volumetric data sets was performed using the software datos|rec (GE Sensing & Inspection Technologies GmbH, Wunstorf, Ger-many). The reconstructed CT volumes were visualized and quanti-fied using ImageJ software (version 1.48 V) (Rasband, 2014). A volume of interest (VOI) of cubic shape (1300 pixels size per axis) was cropped in the CT scan image in the middle of the sample in order to exclude the sample frame.
2.6. Image processing, segmentation and analysis
Scanned gray-scale data of the VOI’s were segmented using the global thresholding method (Otsu’s algorithm) to separate solid and pore phases. The Otsu thresholding algorithm was provided in the ImageJ software (version 1.48 V) (Rasband, 2014). A mor-phological filter permitted detection of the soil surface and thus to define layers as sections parallel to this detected surface (Fohrer et al., 1999). Seventeen layers of 10 voxels each i.e. 240 mm thick were then produced. The detectable pore total volume (>0.014 mm pores) within each of those sections were measured using the BoneJ plugins (Doube et al., 2010). The porosity was cal-culated in each section by dividing the pore total volume by the volume of the section.
2.7. Seal thickness quantification: a new approach
Seal and crust thickness was derived using a method that employed values of porosity (u) obtained from the CT data. A ref-erence volume of soil (1 voxel), where by definition the distur-bance by raindrop impact and the presence of washed-in particles from the surface were considered negligible, was identi-fied in the lower part of the microcosms (36.3 mm below the soil surface) and its porosity calculated (reference porosity =uref). To
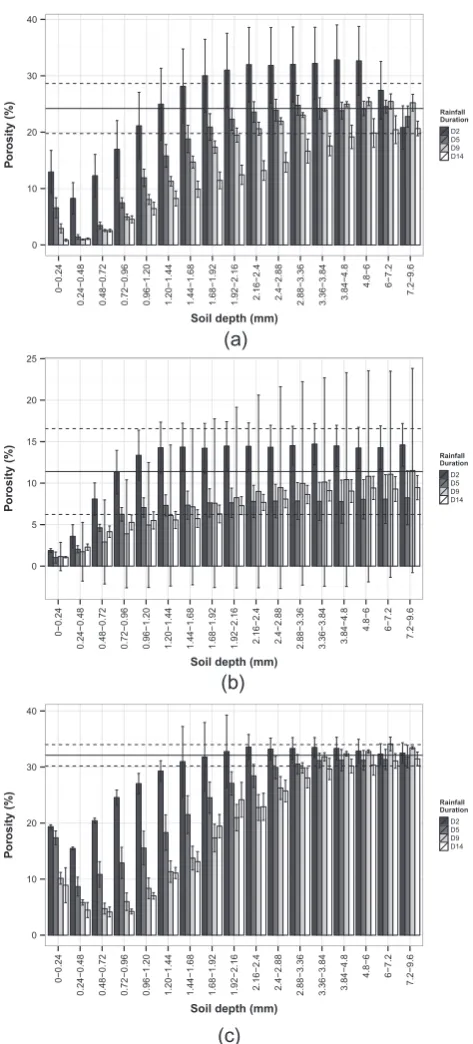
identify seal thickness and micro-morphology, soil volumes were taken across the microcosm depth at increments of 24mm. Conse-quently, 17 adjacent layers were considered in total and the corre-sponding porosities were calculated for each soil type and rainfall duration. These values of porosity were compared with the refer-ence porosity (Fig. 1). For a specific soil and rainfall duration, the thickness of the seal corresponded to the depth at which the seal porosity returned to the median reference porosity (~xuref) ± the
median confidence interval (CI). For soils ZCL, SZL and SL the~xuref
± CI values were 24% (±4.4%), 11% (±5%) and 32% (±1.9%), respec-tively (Fig. 1a–c).
2.8. Statistical analyses
One-way ANOVA was conducted to determine, for each soil type, the effects of rainfall duration on Kunand total porosity of
the seal layer. The means were compared using Student–New man–Keuls (SNK) test at the 0.05 level of significance. ANOVA assumptions of normality and homogeneity of variances of the residuals were explored graphically using respectively normal Q-Q plots and plots of the residuals versus fitted values. The Q-Q-Q-Q plot for Kunrevealed log-normally distributed data therefore ANOVA for
this variable was performed on log-transformed data. All statistical analyses were executed using R (R Development Core Team, 2010).
3. Results
3.1. Quantifying seal-thickness of different soils exposed to various durations of simulated rainfall
Fig. 1shows the porosity calculated for each soil and rainfall duration and in relation to the superimposed~xuref± CI of the
undis-turbed soil matrix, and provides an alternative way to define soil and crust thickness. For the ZCL soil (Fig. 1a), at rainfall durations D2, D5, D9, and D14 the ~xuref± CI was attained at 0.96–1.20,
1.68–1.92, 2.16–2.4, 4.8–6.0 mm respectively which suggests that the average seal thickness equated to 1.08, 1.8, 2.28, and 5.4 mm respectively.
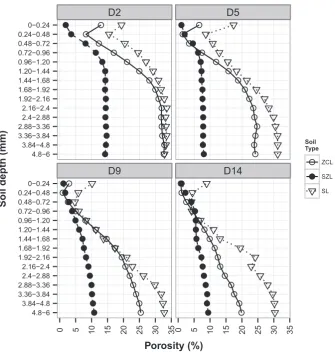
[image:4.595.309.546.61.584.2]Final average seal thickness values per rainfall duration and soil type derived using our imaging approach are represented inFig. 2. For ZCL the estimated seal thickness increased with rainfall
Fig. 1.Variation of porosity of 17 soil layers in relation to simulated rainfall for 2 (D2), 5 (D5), 9 (D9) or 14 (D14) minutes duration. Bars denote median crust porosity (n = 3), whiskers denote ± confidence interval of the median. Horizontal solid line shows the median reference porosity (~xuref), dashed lines show ±
confidence interval around the~xuref. (a) Silty clay loam (ZCL); (b) Sandy silt loam
duration from 1.08 mm for rainfall duration D2 to 1.8 mm at D5, 2.28 mm at D9, and 5.4 mm at D14. Similarly, seal thickness in SL increased exponentially in the order D2 < D5 < D9 < D14 (1.56, 3.12, 3.6, 5.4 mm respectively). A different behaviour was observed for SZL, where the increment in seal thickness due to rainfall dura-tion was very gradual (the seal developed was 0.6 mm thick at D2, 0.84 mm at D5, 1.56 mm at D9, and 1.8 mm at D14). The reduction in median porosity of the first 5 mm of soil with respect to the undisturbed zone was the lowest for SL (38%) and higher in ZCL (58%) and SZL (67%).
3.2. Spatial and temporal micro-morphological variations in seals due to rainfall
The dynamics of seal development and the predominant pro-cesses involved in rainfall-induced surface sealing can be inferred from Fig. 3. An abrupt and distinct zone of reduced porosity as compared with the ~xuref, located approximately 0.24–0.72 mm
below the seal surface was identified for ZCL at D2, D5 and D9, and for SL at all durations.
After 2-min rainfall duration (D2) the immediate soil surface of SL (0.0–0.24 mm) was associated with a 40% reduction in porosity as compared with the median reference porosity (~xuref). This trend
continued throughout the rainfall event. Further, between 0.24 and 0.48 mm depth, porosity decreased to 16%, corresponding to a 52% reduction as compared with the~xuref. This abrupt extra-dense zone
[image:5.595.52.283.64.304.2]was associated with a further 20% reduction inuas compared with
Fig. 2.Seal thicknesses derived with the method proposed in this study and extrapolated fromFig. 1. One value of thickness for each soil type (Silty clay loam – ZCL; Sandy silt loam – SZL; Sandy loam – SL) and duration (2, 5, 9 and 14 min: D2, D5, D9, D14 respectively) of simulated rainfall.
[image:5.595.135.471.378.731.2]the soil surface. This zone of intense porosity reduction progres-sively increases achieving at D9 a maximum depth of 0.72–0.96 mm with % reductions in porosity relative to~xurefranging from
81 to 85% (Fig. 3). Below this zone of intense porosity reduction, an incremental increase in porosity was observed, with~xurefbeing
attained at 2.88–3.36 mm depth for D5, and 3.36–3.84 mm for D9 and D14. No significant differences in porosity values were observed between D9 and D14 for any of the depth intervals inves-tigated (Fig. 1c). This suggested that optimum seal formation was attained following a 9 min storm duration.
As with the SL, for the ZCL the porosity of the uppermost soil layer progressively decreased with storm duration with porosity reductions as compared with ~xuref at D2, D5, D9 = D14 of 40%,
73% and 87%, respectively. The abrupt and narrow zone of intense porosity reduction was again observed between 0.24 and 0.48 mm depth at all storm durations achieving a maximum reduction in porosity as compared with~xurefof >90% (Fig. 1a). In comparison
with SL, no significant differences in porosity were observed between D9 and D14 for depth intervals 0.24–0.48 to 1.44–1.68 mm (Fig. 1a). However, in contrast to SL, further significant reduc-tions in porosity were observed between D9 and D14 for all depth intervals between 1.68–1.92 and 4.80–6.00 mm. This inferred a continued in-washing of fines to depth.
SZL did not present the zone of intense porosity reduction below the soil surface, rather the highest porosity reduction was associ-ated with the 0–0.24 mm layer. The surface reduction inufor SZL as related to the~xurefof 11% was equal to 84, 91, 90 and 91% at
D2, D5, D9 and D14 respectively. In addition, at D5, D9 and D14 the porosity profiles with depth of SZL showed a very similar trend (Fig. 3), and similar porosities values were also observed for D5, D9 and D14 at all depth intervals (Fig. 1b). These results indicated that after 5 min additional rainfall did not significantly alter the sealing processes in SZL and the optimum seal formation occurred at D5.
3.3. Resultant effects of sealing upon infiltration and water repellency phenomena
Generally, increasing rainfall duration appeared to reduce the unsaturated hydraulic conductivity (Fig. 4), although this trend
was marginally statistically significant for ZCL and SZL (P= .10 and 0.09 respectively) and not significant for SL (P= .45). The high-est reduction in hydraulic conductivity occurred between D5 and D9 for ZCL and between D2 and D5 for SZL: from 9.0 to 3.4 mm h1and 6.4 to 4.0 mm h1respectively. For SL, K varied between
1.4 and 8.4 mm h1 showing no relevant trend. The lowest K un
was observed in SL (median of all durations equal to 2 mm h1),
followed by SZL (4.1 mm h1) and ZCL (5.4 mm h1).
Water drop penetration time (WDPT) data for wet surfaces only are shown inFig. 5. Dry surfaces and those of untreated control cores showed no notable water repellency with most drops pene-trating without measurable delay (WDPT range 0–6 s). Reduction or disappearance of water repellency at very low water contents has been previously documented (de Jonge et al., 1999). For each soil and rainfall duration, the relative frequencies of four penetra-tion time classes were reported: WDPT < 5 s, 5 s < WDPT <10 s, 10 s < WDPT <15 s, and 15 s < WDPT <20 s. Drops lasting longer than 20 s were not observed for any soil surface. On average, the water repellency was greater in ZCL than SZL, with the greatest penetra-tion times ranging between 15–20 s and 10–15 s respectively. SL showed no signs of water repellency at any rainfall durations (WDPT, <5 s). In general, with the exception of SL, increasing rain-fall duration increased the proportion of more repellent classes, hence soil water repellency. In ZCL the relative frequency of the class 15–20 s increased from 0% at D2 to 22% at D5, 44% at D9, and 67% at D14. Similarly, in SZL the occurrence of penetration times between 5 and 10 s increased with duration as D2 > D5 > D9 (i.e. 11%, 33% and 100%) and decreased to 68% only at D14 where a longer time (10–15 s) appeared.
Based on the widely used WDPT classification system ofBisdom et al. (1993), all samples exhibited median penetration times clas-sified either as wettable (WDPT < 5 s) or slightly water repellent (5–60 s). Water repellency clearly differed between the three soil types (Fig. 5), decreasing with the content of fine soil particle frac-tions (Table 1). Specifically, the content of silt and clay, equal to 84, 65, and 30% for ZCL, SZL and SL respectively, was positively related to the median WDPT measured for the three soils (13, 6 and 0 s).
Fig. 4.Effect of rainfall duration (2, 5, 9 and 14 min: D2, D5, D9, D14 respectively) and soil type (Silty clay loam – ZCL; Sandy silt loam – SZL; Sandy loam – SL) on the unsaturated hydraulic conductivity (Kun) measured at 0.03 m pressure head.
Different letters indicate differences at P < .05 according to SNK test performed on log-transformed data.
4. Discussion
Crusts and seals should not be seen as discrete layers, but instead as disturbed layers that exhibit gradual changes in physical properties from the surface to some point beneath where the soil is still essentially undisturbed (Mualem et al., 1990). The ability to detect this potential pattern was at the core of the methodological approach based on CT-scan analysis for quantifying seal and crust thickness adopted in this study.
4.1. Seal thickness quantification and relationship with soil type and rainfall
The seal thickness measured with the method here developed ranged between 0.6 mm and 5.4 mm. Similarly toBradford and Huang (1992), thick seals formed readily in the sandy loam soil (SL) which also had the lowest OM content. Comparatively thinner seals were observed in the sandy silt loam soil (SZL) and this may in part be due to the higher OM content that imparted higher aggregate stability; ZCL was mid-range in terms of seal thickness, and had an intermediate OM content. A wide range of seal thick-nesses have been reported in the literature: between 1 mm and 8 mm (Bu et al., 2013), between 0.6 mm and 16.8 mm (Bedaiwy, 2008), 4 mm (Hyväluoma et al., 2012), between 0.2 mm and 20 mm (Bresson and Boiffin, 1990), between 2 mm and 12 mm (Roth, 1997). With the exclusion of Hyväluoma et al. (2012), all the aforementioned studies relied on visual examination for seal thickness quantification. The subjectivity associated with visual examination might have contributed to such variability in seal thickness reported in previous work, in conjunction with the obvi-ous differences in soil type and experimental conditions used.
Hyväluoma et al. (2012)used CT images to delineate the extent of the surface seal. They assessed the variation with depth of sev-eral soil properties, some directly determined from CT scans (porosity, pore size distribution), some derived after flow simula-tion through the pore structure obtained from the CT scans (per-meability, tortuosity, effective porosity). They concluded that, given the good agreement of the various metrics used in estimating seal thickness (approximately 3 mm and 4 mm), these could be used for quantifying the thickness of a compacted layer. However, these authors acknowledged that the small number of samples used (four) limited the validity of the results.
Seal thickness was strongly influenced by the amount of rain impacting onto the soil surface, i.e. the higher the rainfall duration, the thicker the resultant seal. It is well established that the rate of seal expansion and thickening is controlled by rainfall characteris-tics.Farres (1978)observed soil crust thickness increased with the cumulative rainfall and suggested an empirical relationship for this phenomenon.Bedaiwy (2008)determined that the increase of seal thickness followed closely the increase in rainfall KE.
4.2. Seal micro-morphology and relationship with soil type and rainfall
Structural seals are formed at the soil surface by the destruction of soil aggregates exposed to the direct impact of rain drops, com-paction, slaking, particle segregation, and pores filling and clogging by wash-in of fine material (McIntyre, 1958a, b; Assouline, 2004).
Badorreck et al. (2013)successfully used CT data to characterise and identify micro-morphological crust types of undisturbed soil samples from an artificial catchment. Similarly, in our study X-ray CT analysis was able to reveal the dynamics and processes of seal formation and differentiate micro-morphological zones within the seal. In two out of three soils under study, a zone of extreme porosity reduction was found at 0.24–0.72 mm below the soil sur-face. Our results corroborated with those ofFohrer et al. (1999),
who derived the bulk density distribution with depth using a med-ical X-ray CT scanner and observed the maximum value of bulk density at 1 mm below the surface. This behaviour contrasted with previous results indicating that the maximum bulk density (and consequently lowest porosity) is reached at the soil surface itself.
Fohrer et al. (1999)were not able to distinguish if the increased bulk density below the surface was either caused by a systematic image reconstruction error or by a real sealing pattern. This was because they used only one soil type and the phenomenon recurred in all the samples. In our study, SZL did not present the extra-dense layer below the surface. For this soil the porosity was lowest at the immediate surface and incrementally increased with depth. This indicated that the subsurface extra-dense layer detected by tomography was not a technical artefact, but a real micro-morphological soil property.
To understand the reason for the presence/absence of the zone of extreme porosity reduction below the soil surface, raindrop impact phenomena and the associated process of soil detachment should be taken into account.Erpul et al. (2008) and Salles et al. (2000)explained that when a drop hits the soil surface, it pene-trates the surface and compresses the soil. At the same time, dur-ing raindrop impact the pressure builds up at drop-soil interface and the high pressure inside the raindrop forces the water to escape laterally. The compressive stress is then transformed to shear stress across the solid-liquid contact region because of the lateral water movement. Basically, two stress components can be identified during raindrop impact: compressive stress from the impact (normal to the surface), shear stress from the lateral move-ment or jetting (tangential to the surface). The interaction between the obstacles (such as the bulge around the crater formed after drop hits and the irregularity of the soil surface itself) and the lat-eral jet stream is believed to be the major mechanism for soil detachment.Huang et al. (1982, 1983)showed that the partition of compressive and shear forces depends on the surface properties with greater lateral jet development, and in turn detachment, on a rigid surface compared to an elastic surface. More recentlyErpul et al. (2003, 2005) confirmed that the magnitude of compressive vs. shear stress components is dependent on the strength of the raindrop impacted surface and affects detachment.
It appears therefore that soil properties have a significant effect on the process of soil detachment as result of drop impact. Al-Durrah and Bradford (1982)reported that cohesion forces between soil particles strongly control the detached mass. When the disrup-tive forces from a raindrop overcome the bonding energy of the soil aggregates and the particle mass, soil detachment will take place (Lal, 1981). Evidence of a raindrop impact-threshold have been presented by several authors (Brandt, 1989; Sharma et al., 1991; Salles et al., 2000). In general, a sandy soil is less cohesive than a silt loam soil, and the minimum threshold rain energy needed to initiate soil detachment is lower (Salles et al., 2000).
It might be hypothesized that for the sandy silt loam soil (SZL) the critical KE required to initiate and support detachment was higher than the value used in our experiment (18.4 J m2mm1),
surface are expected to have a lower bulk density (and higher porosity) than the underling compressed zone, and this could be the reason for the abrupt and distinct zone of reduced porosity below the surface observed in the porosity vs. depth profiles of ZCL and SL.
Short rainfall durations (2, 5, 9 and 14 min) were selected to characterise the more dynamic stage of seal formation. It has already been established that relatively stable seals might form in a short time.Sang et al. (2008)showed the cumulative porosity of the 0–2 mm layer for soil either treated with anionic polyacry-lamide (PAM) or untreated at four rainfall durations (7.5, 15, 30, 60 min). They reported the biggest drop in cumulative porosity between 7.5 and 15 min rainfall for both treated and untreated soil. In our study a 5 min rainfall was sufficient to induce the for-mation of 1.8, 0.84 and 3.12 mm seal in ZCL, SZL and SL soils respectively. The drastic reduction in porosity in the upper layers compared to the median porosity of undisturbed soil (median ref-erence porosity =~xuref) provided robust evidence of seal
establish-ment. This was also supported by the steep decrement in water flow through meso- and micropores (indicated by unsaturated hydraulic conductivity measured at 0.03 m pressure head) between D2 and D9.
4.3. Infiltration dynamics and water repellency of developing seals
Rainfall had a rapid strong effect on the hydraulic properties of soil and this was clearly connected to the surface sealing process. After only 9 min, the unsaturated hydraulic conductivity was reduced by around 60% of its initial value. At this point in time the average seal thickness of the three soils was around 2.5 mm. Further seal expansion and modifications of the porous system due to the additional rainfall had a smaller impact on the Kun.
Despite being a sandy loam soil and having the highest seal porosity, SL was associated with the lowest unsaturated hydraulic conductivity. This was attributed to the fact that Kun
measure-ments at0.03 m pressure head selectively excluded the water flow in pores1 mm (i.e. the macropores). Given the textural char-acteristics of SL, it was likely that the relative abundance of macro-pores was higher than meso- and micromacro-pores. By excluding the macropores, the pore fraction contributing the most to the infiltra-tion in SL was excluded, hence the low Kunrecorded. This result
stressed the importance of considering pores size when studying the hydrologic responses of surface seals. It also highlighted that a minimum of two pressure head points, characterising different pore size classes (e.g. 0.005–0.03 m), should be selected for a better representation of the unsaturated flow.
Soil water repellency reduces the affinity of a soil to water such that it resists wetting for periods ranging from a few seconds to hours, days or weeks. It can be caused by hydrophobic organic compounds present on soil particle surfaces or as interstitial mate-rial (Doerr et al., 2000). The importance of this reduced soil wetta-bility on surface runoff generation has been widely highlighted (Cerda et al., 1998), including that of low levels of water repellency, which can also affect soil water distribution (Müller et al., 2007).
Doerr et al. (2003)have thus called for the inclusion of this variable in hydrological modelling to improve model predictions in catch-ments with water repellent soils.
Although soil water repellency has often been thought to develop more readily in coarse-textured soils due to their smaller surface area per unit volume (Crockford et al., 1991; De Bano, 1981) our results support previous findings where water repel-lency increased in soil particle fractions of decreasing size (de Jonge et al., 1999; Doerr et al., 1996; Mataix-Solera and Doerr, 2004; Rodríguez-Alleres et al. 2007). Modifications of the soil par-ticle size distribution, caused by the destruction of aggregates with raindrops impact, might be the cause of the development of water
repellency following rainfall and its increase with rainfall duration. Rainfall might have preferentially exposed the finest and more hydrophobic fractions, as well as the interstitial organic matter, and in turn affected soil water repellency.
5. Conclusions
In this study we have developed and tested a new imaging approach for quantifying seal/crust thickness, which enabled us to characterise soil seal formation under simulated rainfall at a fine spatial and temporal scale.
The seals formed under the experimental conditions produced in the laboratory ranged between 0.6 and 5.4 mm in thickness and, in general, the increase of thickness followed the increase in rainfall duration. The sandy loam soil, which was also characterised by a very low OM content, developed thicker seals, whilst the sandy silt loam soil with the higher OM developed thinner seals.
By coupling short rainfall duration time increments with CT-scan technology it was possible to illustrate the structural seal for-mation process and the temporal inter-related dominance and sig-nificance of the associated sub-processes. Critically, in the ZCL and SL soils, we were able to identify a distinct and persistent zone of intense porosity reduction immediately below the seal surface (0.24–0.48 mm). This result confirmed the existence of a raindrop impact threshold (related to a critical KE) that needs to be over-come in order to initiate and support soil detachment and that is specific for each soil type. Rainfall duration had a rapid strong effect on the hydraulic properties and water repellency of soil: unsaturated hydraulic conductivity was reduced and WDPT increased as rainfall duration increased. These results were related to rainfall-induced aggregate breakdown processes and, in general, seal formation.
Structural sealing can occur even at very short rainfall dura-tions. In this study <9 min rain was sufficient to induce the forma-tion of an average a >2.5 mm thick seal in three different soils and cause a 60% reduction of infiltration. These results demonstrate how the surface condition of intensively cultivated soils can have a profound effect on the potential ability of soils to act as a water reservoir, with wider implications for flood-risk management in catchments.
Acknowledgements
This work was supported by the UK Biotechnology and Biolog-ical Sciences Research Council [grant numbers BB/J006092/1, BB/ J006092/2, BB/J006793/1]; and the UK Department of Environ-ment, Food and Rural Affairs under the Government Partnership Award scheme. SD was co-funded by Leverhulme Trust Fellowship [grant number RF-2016-456\2]. The authors would like to thank Produce World Group for providing access to sample fields at But-terwick and Wragg Marsh and to Cobrey Farms for access to sam-ple fields at Croughton. Many thanks also to the laboratory technicians at Cranfield University, University of Swansea and University of Nottingham for their support. We also thank Shmuel Assouline for his insightful critique and suggestions for improve-ment of versions of this publication. The underlying data for this article can be accessed at https://doi.org/10.17862/cranfield.rd. 5591068.
References
Al-Durrah, M.M., Bradford, J.M., 1982. The mechanism of raindrop splash on soil surfaces. Soil Sci. Soc. Am. J. 46 (5), 1086–1090.
Assouline, S., Mualem, Y., 1997. Modeling the dynamics of seal formation and its effect on infiltration as related to soil and rainfall characteristics. Water Resour. Res. 33 (7), 1527–1536.
Assouline, S., Mualem, Y., 2000. Modeling the dynamics of seal formation: analysis of the effect of soil and rainfall properties. Water Resour. Res. 36 (8), 2341– 2349.
Assouline, S., Mualem, Y., 2006. Runoff from heterogeneous small bare catchments during soil surface sealing. Water Resour. Res. 42 (12).
Assouline, S., Thompson, S.E., Chen, L., Svoray, T., Sela, S., Katul, G.G., 2015. The dual role of soil crusts in desertification. J. Geophys. Res. Biogeosci. 120, 2108–2119.
Augeard, B., Assouline, S., Fonty, A., Kao, C., Vauclin, M., 2007. Estimating hydraulic properties of rainfall-induced soil surface seals from infiltration experiments and X-ray bulk density measurements. J. Hydrol. 341 (1–2), 12–26.
Badorreck, A., Gerke, H.H., Hüttl, R.F., 2013. Morphology of physical soil crusts and infiltration patterns in an artificial catchment. Soil Till. Res. 129, 1–8.
Bajracharya, R.M., Lal, R., 1999. Land use effects on soil crusting and hydraulic response of surface crusts on a tropical Alfisol. Hydrol. Process. 13 (1), 59–72.
Bedaiwy, M.N.A., 2008. Mechanical and hydraulic resistance relations in crust-topped soils. Catena 72 (2), 270–281.
Belnap, J., Gardner, J.S., 1993. Soil microstructure in soils of the Colorado plateau – the role of the cyanobacteriumMicrocoleus vaginatus. West. N. Am. Nat. 53 (1), 40–47.
Bisdom, E.B.A., Dekker, L.W., Schoute, J.F.T., 1993. Water repellency of sieve fractions from sandy soils and relationships with organic material and soil structure. Geoderma 56 (1–4), 105–118.
Bowker, M.A., Maestre, F.T., Escolar, C., 2010. Biological crusts as a model system for examining the biodiversity–ecosystem function relationship in soils. Soil Biol. Biochem. 42 (3), 405–417.
Bradford, J.M., Huang, C., 1992. Mechanisms of crust formation: physical components. Soil Crust. Chem. Phys. Processes, 55–72.
Brandt, C.J., 1989. The size distribution of throughfall drops under vegetation canopies. Catena 16 (4–5), 507–524.
Bresson, L.M., Boiffin, J., 1990. Morphological characterization of soil crust development stages on an experimental field. Geoderma 47 (3–4), 301–325.
Bresson, L.M., Moran, C.J., Assouline, S., 2004. Use of bulk density profiles from x-radiography to examine structural crust models. Soil Sci. Soc. Am. J. 68, 1169– 1176.
Bu, C.-F., Gale, W.J., Cai, Q.-G., Wu, S.-F., 2013. Process and mechanism for the development of physical crusts in three typical Chinese soils. Pedosphere 23 (3), 321–332.
Cerda, A., Schnabel, S., Ceballos, A., Gomez-Amelia, D., 1998. Soil hydrological response under simulated rainfall in the Dehesa land system (Extremadura, SW Spain) under drought conditions. Earth Surf. Proc. Land 23 (3), 195–209.
Chen, J., Adams, B.J., 2006. Integration of artificial neural networks with conceptual models in rainfall-runoff modeling. J. Hydrol. 318 (1–4), 232–249.
Chen, L., Sela, S., Svoray, T., Assouline, S., 2013. The role of soil-surface sealing, microtopography, and vegetation patches in rainfall-runoff processes in semiarid areas. Water Resour. Res. 49 (9), 5585–5599.
Crockford, H., Topalidis, S., Richardson, D.P., 1991. Water repellency in a dry sclerophyll eucalypt forest – measurements and processes. Hydrol. Process. 5 (4), 405–420.
De Bano, L.F., 1981. Water Repellent Soils: A State-of-the-Art. US Department of Agriculture, Forest Service, General Technical Report (PSW-46).
de Jonge, L.W., Jacobsen, O.H., Moldrup, P., 1999. Soil water repellency: effects of water content, temperature, and particle size. Soil Sci. Soc. Am. J. 63, 437–442.
Doerr, S.H., 1998. On standardising the ‘‘Water Drop PenetrationTime” and the ‘‘Molarity of an Ethanol Droplet” techniques to classify soil water repellency: a case study using mediumtextured soils. Earth Surf. Proc. Land 23, 663–668.
Doerr, S.H. et al., 2003. Soil water repellency as a potential parameter in rainfall-runoff modelling: experimental evidence at point to catchment scales from Portugal. Hydrol. Process. 17 (2), 363–377.
Doerr, S.H., Shakesby, R.A., Walsh, R.P.D., 1996. Soil hydrophobicity variations with depth and particle size fraction in burned and unburned Eucalyptus globulus and Pinus pinaster forest terrain in the Agueda Basin, Portugal. Catena 27 (1), 25–47.
Doerr, S.H., Shakesby, R.A., Walsh, R.P.D., 2000. Soil water repellency: Its causes, characteristics and hydro-geomorphological significance. Earth Sci. Rev. 51 (1– 4), 33–65.
Doube, M., Klosowski, M.M., Arganda-Carreras, I., Cordelieres, F.P., Dougherty, R.P., Jackson, J.S., Schmid, B., Hutchinson, J.R., Shefelbine, S.J., 2010. BoneJ: free and extensible bone image analysis in ImageJ. Bone 47 (6), 1076–1079.
Erpul, G., Norton, L.D., Gabriels, D., 2003. The effect of wind on raindrop impact and rainsplash detachment. Trans. ASAE (Am. Soc. Agric. Eng.) 46 (1), 51–62.
Erpul, G., Gabriels, D., Norton, L.D., 2005. Sand detachment by wind-driven raindrops. Earth Surf. Proc. Land. 30 (2), 241–250.
Erpul, G., Gabriels, D., Cornelis, W.M., Samray, H.N., Guzelordu, T., 2008. Sand detachment under rains with varying angle of incidence. Catena 72 (3), 413– 422.
Farres, P., 1978. Role of time and aggregate size in the crusting process. Earth Surf. Proc. 3 (3), 243–254.
Fischer, T., Veste, M., Wiehe, W., Lange, P., 2010. Water repellency and pore clogging at early successional stages of microbiotic crusts on inland dunes, Brandenburg, NE Germany. Catena 80 (1), 47–52.
Fohrer, N., Berkenhagen, J., Hecker, J.M., Rudolph, A., 1999. Changing soil and surface conditions during rainfall single rainstorm/subsequent rainstorms. Catena 37 (3–4), 355–375.
Huang, C., Bradford, J.M., Cushman, J.H., 1982. A numerical study of raindrop impact phenomena: the rigid case. Soil Sci. Soc. Am. J. 46 (1), 14–19.
Huang, C., Bradford, J.M., Cushman, J.H., 1983. A numerical study of raindrop impact phenomena: the elastic deformation case. Soil Sci. Soc. Am. J. 47 (5), 855–861.
Hyväluoma, J. et al., 2012. Using microtomography, image analysis and flow simulations to characterize soil surface seals. Comput. Geosci. 48, 93–101.
Jeffery, S., Harris, J.A., Rickson, R.J., Ritz, K., 2009. The spectral quality of light influences the temporal development of the microbial phenotype at the arable soil surface. Soil Biol. Biochem. 41, 553–560.
Knapen, A., Poesen, J., Galindo-Morales, P., De Baets, S., Pals, A., 2007. Effects of microbiotic crusts under cropland in temperate environments on soil erodibility during concentrated flow. Earth Surf. Proc. Land. 32 (12), 1884–1901.
Lal, R., 1981. Soil conservation: preventive and control measures. In: Morgan, R.P. (Ed.), Soil Conservation Problems and Prospects. John Wiley, New York.
Luxmoore, R.J., 1981. Micro, meso-, and macroporosity of soil. Soil Sci. Soc. Am. J. 45 (3).
Mataix-Solera, J., Doerr, S.H., 2004. Hydrophobicity and aggregate stability in calcareous topsoils from fire-affected pine forests in southeastern Spain. Geoderma 118 (1–2), 77–88.
McIntyre, D.S., 1958a. Permeability measurements of soil crusts formed by raindrop impact. Soil Sci. 4, 185–189.
McIntyre, D.S., 1958b. Soil splash and the formation of surface crusts by raindrop impact. Soil Sci. 85 (5), 261–266.
Menon, M. et al., 2011. Assessment of physical and hydrological properties of biological soil crusts using X-ray microtomography and modeling. J. Hydrol. 397 (1–2), 47–54.
Modarres, R., Ouarda, T.B.M.J., 2013. Modeling rainfall-runoff relationship using multivariate GARCH model. J. Hydrol. 499, 1–18.
Mualem, Y., Assouline, S., Rohdenburg, H., 1990. Rainfall induced soil seal (C) A dynamic model with kinetic energy instead of cumulative rainfall as independent variable. Catena 17 (3), 289–303.
Müller, K., Carrick, S., Meenken, E., Clemens, G., Hunter, D., Rhodes, P., Thomas, S., 2007. Is subcritical water repellency an issue for efficient irrigation in arable soils? Soil Tillage Res. 161, 53–62.
Neave, M., Rayburg, S., 2007. A field investigation into the effects of progressive rainfall-induced soil seal and crust development on runoff and erosion rates: the impact of surface cover. Geomorphology 87 (4), 378–390.
Philip, J.R., 1957. The theory of infiltration: 4. Sorptivity and algebraic infiltration equations. Soil Sci. 84 (3), 257–264.
Philip, J.R., 1969. Theory of infiltration. Adv. Hydrosci. 5, 215–296.
R Development Core Team, 2010. R: A Language and Environment for Statistical Computing. R Foundation for Statistical Computing, Retrieved from:. Rasband, W.S., 1997–2016. ImageJ. US National Institutes of Health, Bethesda,
Maryland, US. Retrieved from:https://imagej.nih.gov/ij/.
Rodríguez-Alleres, M., de Blas, E., Benito, E., 2007. Estimation of soil water repellency of different particle size fractions in relation with carbon content by different methods. Sci. Total Environ. 378 (1–2), 147–150.
Roth, C.H., 1997. Bulk density of surface crusts: depth functions and relationships to texture. Catena 29 (3–4), 223–237.
Salles, C., Poesen, J., Covers, G., 2000. Statistical and physical analysis of soil detachment by raindrop impact: rain erosivity indices and threshold energy. Water Resour. Res. 36 (9), 2721–2729.
Sang, S.L., Gantzer, C.J., Thompson, A.L., Anderson, S.H., Ketcham, R.A., 2008. Using high-resolution computed tomography analysis to characterize soil-surface seals. Soil Sci. Soc. Am. J. 72 (5), 1478–1485.
Sauer, T.J., Logsdon, S.D., 2002. Hydraulic and physical properties of stony soils in a small watershed. Soil Sci. Soc. Am. J. 66 (6), 1947–1956.
Schneider, C., Laize, C.L.R., Acreman, M.C., Florke, M., 2013. How will climate change modify river flow regimes in Europe. Hydrol. Earth Syst. Sci. 17 (1), 325–339.
Sharma, P.P., Gupta, S.C., Rawls, W.J., 1991. Soil detachment by single raindrops of varying kinetic energy. Soil Sci. Soc. Am. J. 55 (2), 301–307.
Slingo, J. et al., 2014. The recent storms and floods in the UK, Met Office,http:// www.metoffice.gov.uk/research/news/2014/uk-storms-and-floods.
Wagener, T., Wheater, H.S., 2004. Rainfall-Runoff Modelling in Gauged and Ungauged Catchments. Imperial College Press.
![4 (9 Anthryl) 1 phenylspiro[azetidine 3,9′ xanthen] 2 one](data:image/gif;base64,R0lGODlhAQABAIAAAP///wAAACH5BAEAAAAALAAAAAABAAEAAAICRAEAOw==)