We estimate the time required for HIV to complete separate stages of its infection cycle in productively infected CD4ⴙT cellsin vivoby comparing initial delays after administration of single antiretroviral drugs until HIV RNA reduction in peripheral blood. Data were obtained from monotherapy studies of eight antiret-roviral drugs from all currently licensed HIV drug classes: CCR5 blockers (maraviroc), fusion inhibitors (enfuvirtide), nucleoside and nonnucleoside reverse transcriptase inhibitors (abacavir, tenofovir, and rilpi-virine), integrase inhibitors (raltegravir), and protease inhibitors (ritonavir and nelfinavir). We find that HIV requires an average of 52 h between export of virions in one generation to export in the next, with most of this (33 h) taken up by reverse transcription. Reverse transcriptionin vivowas three times longer thanin vitroand began soon after virion fusion, as we determined no difference in mean times for commencement of reverse transcription and virion fusion as calculated by timing of the effects for tenofovir and maraviroc. Approxi-mately 7 h is required between HIV integration and virion production. First-phase HIV RNA decay (half-life of 17 h over all drugs) seemed to slow as the stage being inhibited by the drug was further from viral production. The mean estimated half-life of plasma virions was 5 min, significantly shorter than previous estimates.
A number of in vitro studies have characterized the time required for HIV to progress through components of its infec-tion cycle. However, timing in cell lines in the laboratory is not necessarily representative of what will occur in the complex environment of the body of an HIV-infected person, where variability will arise from the quasispecies nature of HIV and the heterogeneity of cell phenotypes and activation states within an individual as well as heterogeneity between individ-uals. Differences betweenin vitro and in vivo estimates can point to possible susceptibilities of HIV, as well as factors that contribute to the failure of combination antiretroviral therapy (CART).
In the past,in vivoestimates of the timing of the HIV life cycle have been inferred from the dynamics of HIV RNA decay after the commencement of antiretroviral therapy. The earliest of these calculations determined the life span of an infected cell and how long a virion will survive (14, 39). Further calculations attempted to determine the viral generation time, the time between the release of a virus, its infection of another cell, and finally release of virus from that cell (30). However, these calculations were hindered by limitations of analysis with a single drug and uncertainties about delays in the effect of that drug (13).
In recent years many new HIV antiretroviral drug classes have become available. There are five antiretroviral drug classes that are currently licensed for treatment of HIV-in-fected individuals: nucleoside/nucleotide reverse transcriptase
(RT) inhibitors (NRTI), nonnucleoside reverse transcriptase inhibitors (NNRTI), protease inhibitors (PI), fusion and CCR5 inhibitors (FI and CCR5-I), and integrase inhibitors (INI). These drug classes target different stages of the HIV infection cycle. Hence, antiviral therapy with any one will result in a delay before HIV RNA decreases in peripheral blood, which reflects how far that inhibited stage is from the time until a cell completes infection and produces virus (Fig. 1 and 2). This stage-dependent inhibition has been observed through the dif-ferent delays after application of these drug classes to cell cultures (4) and has been described in mathematical modeling of these processes (21, 35). Differences in timing between drug classes can also determine the time between stages of the viral life cycle. Here, we investigate the extent of these delays and their implications for the duration of stages of the HIV infec-tion cycle usingin vivodata.
Combination antiretroviral therapy should exhibit a delay that reflects the fastest-acting drug (4), so to distinguish the different stages only monotherapy studies were used in our analysis. In order for the calculation of the initial delay (de-termined by fitting a delayed decay curve to HIV RNA data) to be reasonably accurate, we also required data that had been obtained by frequent sampling of plasma following the com-mencement of drug dosing. We obtained longitudinal data of the number of HIV RNA copies per ml of plasma for individ-ual patients from previously published monotherapy dose-ranging or viral dynamics studies from each of the following drug classes: INI, raltegravir (RAL) (26); NNRTI, rilpivirine (RIL) (7); NRTI, abacavir (ABC) and tenofovir disoproxil fumarate (TDF) (8); FI, enfuvirtide (T20) (17); CCR5-I, mara-viroc (MVC) (17); PI, ritonavir (RTV) (30) and nelfinavir (NFV) (25).
The protease inhibitors ritonavir and nelfinavir interfere
* Corresponding author. Mailing address: School of Mathematics and Statistics, University of New South Wales, Sydney 2052, NSW, Australia. Phone: 61 2 9385 7042. Fax: 61 2 9385 7123. E-mail: J .Murray@unsw.edu.au.
䌤Published ahead of print on 10 August 2011.
10798
on November 7, 2019 by guest
http://jvi.asm.org/
with virion maturation as new virions are exported from a previously infected cell. They inhibit cleavage of the Gag poly-protein and block formation of the conical capsid of mature virions (15, 40). Figure 1 provides a schematic of these and subsequent events. The CCR5 inhibitor maraviroc competi-tively binds to CCR5, a major coreceptor for HIV-1, blocking the interaction between HIV Env and this coreceptor (5). This prevents the conformational changes in Env necessary for viral fusion. Enfuvirtide binds to the exposed transmembrane re-gion of the Env protein (gp41), blocking subsequent confor-mational changes and disabling the fusogenic process (17). Following formation of triphosphorylated forms of the nucle-oside (abacavir) and the nucleotide (tenofovir), reverse trans-criptase inhibitors become incorporated into the lengthening HIV DNA chain during reverse transcription but lack a termi-nal hydroxyl group which is necessary for continuation of this process (15). On the other hand, nonnucleoside reverse trans-criptase inhibitors such as rilpivirine interfere with the length-ening HIV DNA chain through binding to the RT enzyme near the catalytic site (3, 37). The integrase inhibitor raltegravir interferes with strand transfer and blocks insertion of the com-pleted HIV DNA chain into the host cell DNA (11, 12).
In these monotherapy studies the number of HIV RNA copies/ml had been assayed at a number of time points, which differed between studies but generally covered 9 days of treat-ment (Table 1). Patients were mostly antiretroviral naive or were naive with respect to the class of the drug being assessed and were taking no other antiretroviral drugs at the time of the study.
MATERIALS AND METHODS
Data fitting.Patient HIV RNA data were fitted with a delayed biphasic decay curve obtained from a standard model of HIV dynamics. The typical ordinary differential equation model of HIV RNA dynamics that includes biphasic decay (29) is given by
dV
dt ⫽NI⫹NMM ⫺cV
dI
dt ⫽共1 ⫺⑀兲kVT⫺␦I
dM
dt ⫽共1 ⫺⑀兲kMVM ⫺M
whereVrepresents HIV RNA copies,Iis the number of productively infected
CD4⫹T cells,Tis the number of uninfected CD4⫹T cells,MandM represent
the number of infected and uninfected cells, respectively, with slower decay
characteristics,␦andare the death rates of each infected component,cis the
loss rate of plasma virions,kandkMare rates of infectivity per virus of each
component, andNandNMare viral production rates from each infected
com-ponent.
For suitably high efficacy (⑀ ⬇ 1) with a drug taking effect at time, the
solution of this system of differential equations is given by the following:I(t)⫽
I0e⫺␦ (t⫺ )
,M(t)⫽M0e⫺
(t⫺ )
, and
V共t兲 ⫽e⫺c共t⫺ 兲⫹ NI0
c⫺ ␦ 共e
⫺␦共t⫺ 兲 ⫺e⫺c共t⫺ 兲兲 ⫹ NMM0
c⫺共e
⫺共t⫺ 兲⫺e⫺c共t⫺ 兲兲
fortⱖ, where we measure viral levels relative to baseline so thatV()⫽1.
Under the assumption that viral levels are in steady state before timeand
setting the right-hand side of the first differential equation to zero givesNI0
c ⫹ NMM0
c ⫽ 1. DefiningA ⫽
NI0
c in the expression forV(t) determines the decay
curve that we fit to HIV RNA data:
1, 0 ⱕt⬍
f共t兲 ⫽
再
e⫺c共t⫺兲 ⫹ cc⫺␦A共e⫺␦共t⫺兲 ⫺e⫺c共t⫺兲兲
⫹c⫺c 共1 ⫺A兲共e⫺共t⫺兲⫺e⫺c共t⫺兲兲,
ⱕ t (1)
For antiretroviral therapy with limited efficacy, equation 1 can also duplicate an initial first-phase decay followed by viral levels stabilizing at a lower level, where
the second phase now represents this limited efficacy with ⬇0 (28).
The virion clearance ratecwas included explicitly as it ensured the functionf
was smooth at time, which was necessary for convergence of the fitting method.
Since it should not vary with the different drugs, this parameter was set as a fixed effect only with no random effects over the patients.
The delay parameterwas allowed to differ on average between drugs, and so
the fitting procedure included a different fixed and random effect for the initial delay for the patients in each drug study. The means and standard deviations of
the remaining three parameters in equation 1 (A,␦, and) (assuming fixed and
random effects for each parameter) and the fixed-effect parametercwere
de-termined across all drug classes by fitting a nonlinear mixed effects (NLME) model, based on equation 1, to the HIV RNA data relative to baseline and grouped by patient. We used the NLME method nlmefit in Matlab 2010b (The
MathWorks, Inc., Natick, MA). The parameters,␦, andcwere log transformed
to ensure that they were positive, whileAwas transformed through the logit
function to satisfy the constraints 0ⱕAⱕ1. We specified an exponential error
[image:2.585.303.540.70.199.2]model so that we effectively fitted the log of equation 1 to log HIV RNA. This procedure enforces normally distributed random effects (after taking into
[image:2.585.46.282.73.224.2]FIG. 2. The replacement of productively infected CD4⫹ T cells with ones newly infected. The delay in effect of antiretroviral therapy (ART) arises from its inhibiting cells progressing through the infection cycle to replace those already productively infected. The further away a drug acts from viral production, the longer will be the time before its effects will be observed.
FIG. 1. The positions in the HIV life cycle affected by each drug class and their relative timing in terms of when they impact HIV RNA levels in blood.
on November 7, 2019 by guest
http://jvi.asm.org/
account the parameter transformations) around mean parameter values. Hence, the method will partially compensate for the different sets of time points used for each drug. For example, it implies that if one drug has frequent early sampling, then the first-phase decay rates calculated with these time points for this drug will also influence the first-phase decay rates for drugs where the sampling is less frequent. These assumptions assist in more accurate quantification of the initial delays, which is our main goal.
Delays obtained from these calculations are composed of the pharmacokinetic
(PK) delay while the drug achieves a suitable inhibitory concentration (PK), any
initial delay between HIV RNA decrease in lymphoid tissue, which is the major
source of viral production, and its distribution in peripheral blood (dist), and the
delay due to clearance of virions (c⬇1/c⫽7 min under our calculations), as
well as the intracellular delay required for HIV to progress from the stage being
inhibited, plus viral transcription and production,cell. All of these delays
con-tribute to the observed delay:PK⫹ dist⫹ c⫹ cell. Given that virion
distri-bution and clearance are fast processes (dist,c⬍⬍ cell), we estimate the time
required for HIV to progress from the stage being inhibited by that drug by the initial delay minus the PK delay.
In an effort to find the globally optimal parameter solution for the NLME fitting procedure, we generated 1,000 initial parameter vectors using Latin hy-percube sampling, ran the NLME algorithm starting at each of these parameter vectors, and then chose the solution with the minimum root mean squared error. This same method was also used to determine mean parameter values when the
clearance rate of free virus was fixed to literature estimates,c⫽23 (34). The
fitting of this reduced model performed significantly worse: Akaike information
criterion of⫺1,632 versus⫺1,672 for the full model (a lower value is better) and
log likelihood of 838.9 versus 859.9, respectively (a higher value is better). The mean and standard deviation estimates obtained from the NLME routine were used to obtain 95% confidence intervals (CIs). For parameters that had been transformed in the fitting procedure, the means and confidence intervals were obtained from the transformed variables first and then transformed back to the original parameters. The curves and distributions shown in Fig. 3 and 5 were obtained from the individual patient fits.
Multiple comparisons were performed with Tukey’s test on the
log-trans-formed fitted parameters for individual patients. Statistical significance was set at the 95% level.
PK delay estimation.We estimated the PK delay for each drug based on its
time to achieve maximum concentration (Tmax)in vivo. These values were
avail-able from literature reports (Tavail-able 2), except for ritonavir and enfuvirtide. The mean 3.6-h PK delay for ritonavir was calculated by determining the first time
this PI reduced infectious virus (30). The estimate ofTmaxfor enfuvirtide was
obtained by fitting a two-compartment model to the single-dose PK data in Table 2 of Kilby et al. (17).
RESULTS
Fitting a single decay curve with an initial delay to the data would have led to considerable inaccuracies as many patients received low dosages in the dose-ranging studies and so exhib-ited a stabilization of their plasma HIV levels within the study periods. Therefore, patient HIV RNA data were fitted with a delayed biphasic decay curve using a nonlinear mixed-effects model ([NLME] equation 1). Nonlinear mixed-effects model-ing has the advantage of determinmodel-ing mean behavior directly from grouped data (31) and has been used previously to ana-lyze HIV dynamics (27).
A number of these studies were dose-ranging trials involving doses with limited efficacy and little HIV RNA reduction. We therefore included only individuals who achieved more than a 0.5-log10HIV RNA reduction at some time after baseline and within a 10-day overall time period. With this restriction, a total of 146 individuals comprising 1,248 HIV RNA data points remained in the analysis.
n, number of patients.
b
Start of monotherapy in each case has been translated to day zero for consistency, and some time points are fractional. Not all patients were assayed at each time. Individuals were either antiretroviral naı¨ve or were not taking antiretroviral drugs for periods prior to commencement of monotherapy.
c
The enfuvirtide HIV RNA data consisted of data for four individuals in the 100-mg dosage group measured by PCR, as well as the mean data for each of the three dosage groups (3 mg, 10 mg, and 30 mg) measured by bDNA.
d
[image:3.585.43.541.82.183.2]Screening amount.
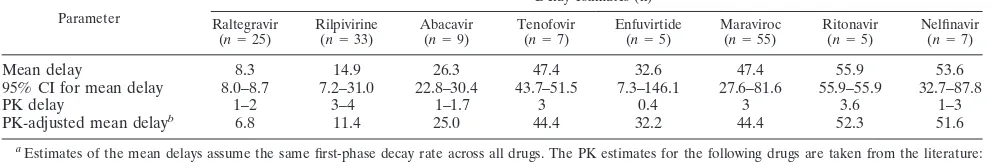
TABLE 2. Means and 95% CIs for initial delays and mean delays adjusted for PK delays
Parameter
Delay estimates (h)a
Raltegravir
(n⫽25)
Rilpivirine
(n⫽33)
Abacavir
(n⫽9)
Tenofovir
(n⫽7)
Enfuvirtide
(n⫽5)
Maraviroc
(n⫽55)
Ritonavir
(n⫽5)
Nelfinavir
(n⫽7)
Mean delay 8.3 14.9 26.3 47.4 32.6 47.4 55.9 53.6
95% CI for mean delay 8.0–8.7 7.2–31.0 22.8–30.4 43.7–51.5 7.3–146.1 27.6–81.6 55.9–55.9 32.7–87.8
PK delay 1–2 3–4 1–1.7 3 0.4 3 3.6 1–3
PK-adjusted mean delayb 6.8 11.4 25.0 44.4 32.2 44.4 52.3 51.6
a
Estimates of the mean delays assume the same first-phase decay rate across all drugs. The PK estimates for the following drugs are taken from the literature: raltegravir (24), rilpivirine (7), abacavir (19), tenofovir (1), maraviroc (6), ritonavir (30), and nelfinavir (25). The PK delay for enfuvirtide was calculated as described
in Materials and Methods from data in Kilby et al. (17).n, number of patients.
b
Calculated as mean delay minus PK delay (an average value was used for the PK delay when a range of values was given).
on November 7, 2019 by guest
http://jvi.asm.org/
[image:3.585.41.543.612.693.2]Plasma virion clearance rate c and half-life. The NLME procedure determined mean delay estimates for each drug as well as several decay parameters including the clearance rate of plasma virions. The optimal virion mean clearance ratec (equation 1 in Materials and Methods) calculated over all 146 individuals was 198 per day. This equates to a half-life of 5 min and is significantly shorter than the fastest previous estimate of 28 min obtained for a patient undergoing apheresis (34). Given that this value was significantly faster than previous estimates, we also performed another set of NLME calculations, but this time we fixed the value ofcat a rate of 23 day⫺1as determined
from literature estimates (34). However, this gave a signifi-cantly worse fit to the data (P ⫽9⫻10⫺11, likelihood ratio
test).
Stage-dependent delays. The initial delays over all drug classes were statistically significantly different (Table 2 and Fig. 3A) and increased in accordance with what would be expected from the stages of infection inhibited by each drug (Fig. 1). The enfuvirtide data set was limited by fewer patients and data points. Hence, delay estimates for this drug are less accurate, as indicated by the very wide 95% confidence interval.
After adjustment for pharmacokinetic (PK) delays, the ini-tial delays for the INI raltegravir and the NNRTI rilpivirine were significantly shorter than for all other drugs (adjusted for multiple comparisons). The delays for tenofovir, maraviroc, and the two PIs were not significantly different. We compared the timing of these delays, beginning with the drugs that ex-hibited the shortest delays. These drugs will inhibit a greater proportion of cells in the early phases of the infection process and will act at a time point closer to the stage where a cell becomes productively infected.
HIV integration to viral production. There was an 8.3-h mean delay between start of RAL monotherapy and the initial decrease of HIV RNA in peripheral blood (Table 2). With a PK delay estimate of 1.5 h, the time between RAL inhibition of HIV integration and viral production is on average 6.8 h (Ta-ble 2 and Fig. 4).
Duration of reverse transcription.After relative PK delays were taken into account, inhibition of reverse transcription covered an extensive time period since mean inhibition oc-curred at 11.4 h for the NNRTI rilpivirine, at 25.0 h for the NRTI ABC, and at 44.4 h for the NRTI TDF (Table 2 and Fig. 4). Given the disparity in the times and the different inhibitory processes used by these drugs, it seems likely that the delay associated with the NNRTI represents inhibition closer to the completion of RT. The longer delay for the nucleotide RTI tenofovir may indicate that it is more successful at inhibiting early stages and less successful at later stages within reverse transcription, while the nucleoside RTI abacavir would appear to be more effective at middle stages. However, it is possible these differences may be related to differences in the intracel-lular phosphorylation requirements of these two drugs and also to the longer intracellular half-life of tenofovir. The 33-h time period between the mean impact of rilpivirine and that of tenofovir, then, provides an estimate of the time required for reverse transcription in CD4⫹T cellsin vivo.
Reverse transcription to integration.If the short delay ob-served with the NNRTI rilpivirine indicates late stages of re-verse transcription, then in these CD4⫹T cells that are des-tined to be productively infected, HIV progresses from reverse transcription to integration in approximately 11.4 h⫺6.8 h⫽ 4.6 h.
[image:4.585.42.284.68.245.2]CCR5 binding and viral fusion. Given the sparsity of T20 data, virion fusion was better determined from the delay for the CCR5 inhibitor maraviroc. There was no statistical differ-ence between CCR5 binding, as measured by the delay in maraviroc activity, and commencement of reverse transcrip-tion, as estimated from tenofovir delays. Both tenofovir and maraviroc exhibited 44.4-h delays, and this lack of difference suggests that it takes little time for a virion to progress from
FIG. 3. Distributions of parameter values relative to drug group: initial delay (A), first-phase decay rate (B), second-phase decay rate (C), and fraction of viral load from the first-phase component (D).
FIG. 4. Means and 95% confidence intervals (Table 2) of the time before viral export from the second generation of infected cells for each of the processes in the HIV life cycle (all times have been adjusted for PK delays). The timing for viral fusion was taken from the delay associated with maraviroc, while viral export from the infecting cell was assumed to be given by the delay for the protease inhibitor nelfinavir since this drug had the widest confidence interval and the same mean delay as the other PI, ritonavir. The difference between the means provides estimates of the time required for HIV to progress between each of these stages in productively infected CD4⫹T cellsin vivo, subject to uncertainty in these measurements as depicted by the confidence intervals. The confidence intervals comprise the variation that can occurin vivoand between individuals, as well as flexibility in fitting the model to the data, especially when few early data points are available for some of the drugs.
on November 7, 2019 by guest
http://jvi.asm.org/
[image:4.585.318.524.70.203.2]binding to the CCR5 receptor, then to fusion, and through to the commencement of reverse transcription.
Viral export and infection.The mean PI delays were approx-imately 52 h while the delay for the CCR5-I was 44.4 h al-though the difference in delays was not statistically significant. This gives an estimate of 7.6 h between virion export and binding. However, the confidence intervals for each of these processes were very wide and overlapped extensively (Fig. 4), indicating that there is considerable uncertainty in this esti-mate.
Viral generation time.The time between viral export from an infected cell until viral export from the next generation of target cells represents the viral generation time. Protease in-hibitors interfere with maturation of virions to an infectious form and act postexport. Hence, the 52-h delay observed with the protease inhibitors provides an estimate of the viral gen-eration time (Fig. 4) although this is subject to some of the uncertainties around PK delays and virion half-lives (13). The viral generation time should at least exceed the 45-h difference in delays between the PIs and integrase inhibitor.
First-phase decay rates and productively infected CD4ⴙT cell half-lives.Viral decay was not entirely linear even before drug effect saturated or reached what would be expected of the second-phase viral decay that is observed under CART. The second phase with CART typically commences around 8 to 10 days after the start of therapy (29), much later than the change to a slower phase observed in the monotherapy studies at around day 4 (Fig. 5). The mean first-phase decay rate was 0.98 day⫺1with a 95% confidence interval of 0.58 to 1.64 per day.
This mean decay rate corresponds to a half-life of 17 h for productively infected CD4⫹T cells.
Do first-phase decay rates differ with the stage being inhib-ited? There are limits to how many parameters can be ex-tracted from fitting to data over a 10-day period. Hence, the parameters describing the first-phase decay rate were initially assumed independent of the drug while initial delays were allowed to differ. Even with the extent of these data, it is difficult to guarantee that this first-phase decay rate does not differ between drugs.
NLME calculations performed separately on each drug (starting from the optimal solutions above and assuming the optimal plasma virion clearance rate of c ⫽ 198) provided estimates of initial delays and first-phase decay rates for five drugs (the procedure failed on the remaining drugs because of the sparsity of data). These values were as follows: for ralte-gravir, delay of 10 h (after adjustment for PK delay) and decay rate of 1.52 day⫺1(11-h half-life); for rilpivirine, delay of 14.2 h
and decay rate of 0.93 day⫺1(18 h half-life); for abacavir, delay
of 21.9 h and decay rate of 0.70 day⫺1 (1 day half-life); for
maraviroc, delay of 42.7 h and decay rate of 0.86 day⫺1(19 h
half-life); for nelfinavir, delay of 55.7 h and decay rate of 1.50 day⫺1(11 h half-life). For the three drugs with the most
pa-tients and data points, raltegravir, rilpivirine, and maraviroc, the decay rates decrease with the length of the initial delay.
Second-phase decay rates.The second-phase decay covered a variety of situations including stabilization and rebound of viral load for low-dosage groups. The optimal fit to the data was achieved by using a second-phase decay rate of 0.22 day⫺1
(95% CI, 0.05 to 0.40 day⫺1) corresponding to a 3.1-day
half-life, which is considerably shorter than the 14.1-day half-life for second-phase decay under CART (29). Drugs with more fre-quent later time points such as raltegravir and maraviroc
ex-FIG. 5. HIV RNA copies/ml (blue circles) relative to baseline for typical patients in each drug study. Data for all patients included in the analysis for each drug are shown as gray markers. The patient-specific fit (fixed effect plus random effect for the individual [solid blue line]) and the mean response over all patients for that drug (fixed effect simulation for each drug [dashed black line]) are shown. The fixed-effect curve represents the mean response over all individuals within that drug study, where the only difference between drugs is the initial delay. Therefore, the initial delay will be calculated relative to each drug, but the decay phases of the mean response curves will be determined relative to all patients.
on November 7, 2019 by guest
http://jvi.asm.org/
[image:5.585.132.447.67.302.2]hibited second phases that were slower than the first phase, when these were fitted individually, and that were either sig-nificantly or substantially different from zero (Fig. 5). Hence, this second component of decay for these drugs was not a consequence of plasma viral levels reaching a new steady state under low drug doses in all cases.
DISCUSSION
The delays after the start of monotherapy indicate when inhibition for that particular drug occurs in the infection life cycle. By comparing delays from different classes, we have estimated the time HIV requires to progress between these stages. The data for these calculations were obtained from a number of studies in which plasma viral load measurements were determined at different time points. For consistency, it would have been preferable to generate new data from a single study where patients were randomized to the eight mono-therapy regimens and where the effects of these regimens on viral load were assessed at identical time points. However, due to the dangers of generating drug resistance, it is highly un-likely that a study with a nonclinical objective such as this would be approved or could be recruited. Given that uniform data will not be available, we are left with using mathematical techniques to best interpret currently available data sets. This is our approach. Moreover, we determine the timing of the steps in the HIV infection cycle of CD4⫹T cells in their myriad phenotypes and levels of activation within lymphoid tissue in the bodies of HIV-infected individuals. To date, the only esti-mates, valuable as they are, have been for individual strains of the virus in laboratory cell lines. Although our results may exhibit diversity across patients, this is likely to be more rep-resentative of the natural variation of these processes than the standardized experiments conductedin vitro.
For processes that require multiple steps, such as reverse transcription, inhibition can occur at different points within that process. We observed a shorter delay in action for the NNRTI than for both NRTI (Fig. 4). Several factors may have contributed to the faster effect of the NNRTI rilpivirine: (i) the NNRTI is administered in its active form while the nucleoside RTI and nucleotide RTI need to be tri- and biphosphorylated intracellularly, respectively, before conversion to their inhibi-tory forms, and (ii) NNRTI may act at fewer stages but with greater efficacy at each of these stages. Hence, they may inhibit shorter products more effectively than an NRTI. This has been observedin vitrowhere the NNRTI nevirapine was more suc-cessful in terminating shorter minus-strand DNA products than the NRTI zidovudine (AZT) (33). Furthermore, NNRTI have been observed to inhibit the later stage of plus-strand initiation with little effect on earlier minus-strand synthesis (9). The ability of an NNRTI to suppress productive infection in tissue culture systems drops when it is added 10 h after infec-tion (4), a time that also corresponds to the peak in HIV DNA presence in cells before it drops due to integration (2) and the appearance of cDNA (18). Hence, an NNRTI will exhibit inhibitory effects at late stages of reverse transcription where there are fewer remaining steps that can be blocked.
In vitro analyses of the dynamics of HIV infection,
con-ducted in a variety of cell lines, tend to indicate that these steps occur more quickly in comparison to the average values in a
population of HIV-infected individuals, as assessed here. After exposure to HIV, p24 appears in the cytoplasm of the infected cell after 1 h (38). Early stages of reverse transcription occur approximately 5 h after infection (4, 18), and later transcripts appear 2 h afterwards. The addition of an NNRTI 10 h after infection sees an approximately 50% decrease in its ability to suppress productive infection (4), suggesting that by this time virus will be close to the last inhibitory point of an NNRTI. This timing is also consistent with HIV DNA peaking during single-round infections after approximately 9 h (2) and to the appearance between 9 and 12 h of cDNA species (18). HIV integration occurs on average 15 h after infectionin vitro(18) while components of viral production have been measured at a variety of times postinfection, with p24 expression occurring between 9 to 12 h (38) and genomic RNA and mRNA appear-ing after 24 h (18). New HIV DNA production in second rounds of infection in culture appear between 28 and 32 h from the original infection, which is consistent with a 24-h period between initial infection and virion production and the 5 h required to commence reverse transcription (18). Hence, a complete intracellular cycle of HIV infection in vitro takes approximately 24 h, with an extra hour to produce second-round infections. This gives a total HIV generational time of
25 hin vitroand is much shorter than our 52 h estimate from
in vivodelays (Fig. 4).
The majority of the difference betweenin vitroandin vivo estimates seems to occur during reverse transcription.In vivo, its start is fast since tenofovir (which requires only biphosphor-ylation for its activity, bypassing the rate-limiting monophos-phorylation step) inhibition occurred on average at the same time as CCR5 binding. On the other hand, inhibition by rilpi-virine occurred on average 33 h after initial infection. This period is three times as long as the 10 h required on average for an NNRTI to have its effectin vitro(4). This slower time for reverse transcriptionin vivomay be due to variable activation rates and differences in the intracellular milieu of cells within the heterogeneous populations of CD4⫹T cells that existin vivo. It may also be due to dissociation of the RT primer from the lengthening HIV DNA chain. If the latter scenario is the case, then it may give rise to more extensive viral recombina-tion as the RT complex jumps to other infecting HIV RNA strands (16). However, the disparity in timing of RT activity as determined from the rilpivirine and tenofovir data may be due in part to the delay in attaining the active triphosphorylated state and the much longer intracellular half-life of tenofovir.
The fitting procedure determined two phases of decay within the 10-day period of these studies, and this slowing of decay after approximately 4 days has been observed previously (10, 23). The slowing of first-phase decay can be explained by a number of scenarios: (i) some drugs were given at low dosages which resulted in the number of HIV RNA copies/ml stabiliz-ing and/or reboundstabiliz-ing for certain individuals; (ii) later time points may be partially influenced by viral production from the traditional second phase seen with CART; (iii) some drug studies used branched DNA assays which have a limited dy-namic range especially at the lower end and therefore can lead to HIV RNA measurements at later time points that are arti-ficially elevated; (iv) there is ongoing replication that adds to viral load (10); and (v) productively infected CD4⫹T cells with different activation levels, including resting cells (41), may
on November 7, 2019 by guest
http://jvi.asm.org/
drug(s) being used. We found that fitting the model to each drug separately produced decay rates that decreased from 1.52 day⫺1 (half-life of 11 h) for raltegravir, to 0.93 day⫺1 for
rilpivirine, and to 0.86 day⫺1 for maraviroc. The slowing of
decay seems to depend on how far the stage being inhibited is from viral production. It is not due to poorer efficacy of the drugs since they each reduce HIV RNA by more than 90%, an effectiveness that precludes this difference in first-phase slope being due to efficacy. This correspondence of first-phase decay rate with the type of drugs may explain why others have ob-served faster first-phase decay rates with increased numbers of drugs being used (10) but attributed this to poorer efficacy of the regimen with fewer drugs (22).
We estimated a very short half-life of 5 min for virions in peripheral blood. This is considerably shorter than all other estimates, which range from 6 h (30) down to 28 min (34). Accurate estimates of virion clearance rates are difficult since they are reflected only in the sharpness of the change from the delay period to the early decay of HIV RNA (13). Estimates for processes that may occur in minutes will be hampered by assessing HIV RNA only in periods of hours or days. There-fore, this estimate for plasma virion half-life should be viewed with caution. However, this estimate provided a significantly better fit to data than using the literature-based estimate of a plasma virion clearance rate of 23 day⫺1(P⫽9⫻10⫺11).
CCR5 binding inhibition by maraviroc exhibited an initial delay with a broad confidence interval (Table 2 and Fig. 4), and, hence, the estimate for the time between viral export (as measured by the delay for the protease inhibitors) and CCR5 binding could vary considerably from the 7.6 h estimate from the mean delay differences. However, if virions exhibit a half-life of 5 min, then any sizeable period between virion export and cell fusion would lead to clearance of the vast majority of virions and make infection very unlikely through this process. In that case, there would need to be an intermediate process to maintain infectious virus, such as capture and presentation by follicular dendritic cells (36), or infection would have to occur predominantly via cell-cell transmission.
We have estimated the timing of components of the HIV infection cyclein vivo through calculations based on plasma viral levels for individuals enrolled in antiretroviral studies. The variability we observe, although much larger than ob-tained fromin vitro experiments, is to be expected because it reflects the complexity of thein vivosituation where infection is of CD4⫹T cells of differing phenotypes and where activation states occur in a diversity of tissue environments. Infectionin vivois also driven by a quasispecies of virus with different levels of infectivity, fitness, and pathogenicity. This situation is con-siderably different from the controlledin vitroexperiments that
for raltegravir; K. Boven, S. Vanveggel, and B. Woodfall for rilpivirine; M. Goicoechea for abacavir and tenofovir disoproxil fumarate; S. Hop-kins, M. Kilby, and M. Salgo for enfuvirtide; H. Mayer and E. van der Ryst for maraviroc and nelfinavir; and A. Perelson for ritonavir.
The Kirby Institute is funded by the Australian Government De-partment of Health and Ageing and is affiliated with the Faculty of Medicine, The University of New South Wales. Its work is overseen by the Ministerial Advisory Committee on AIDS, Sexual Health and Hepatitis. This research was supported through a National Health and Medical Research Council (NHMRC) Practitioner Fellowship to A.D.K. and NHMRC Program Grant 510448.
REFERENCES
1.Barditch-Crovo, P., et al.2001. Phase I/II trial of the pharmacokinetics, safety, and antiretroviral activity of tenofovir disoproxil fumarate in human
immunodeficiency virus-infected adults. Antimicrob. Agents Chemother.45:
2733–2739.
2.Brussel, A., and P. Sonigo.2003. Analysis of early human immunodeficiency virus type 1 DNA synthesis by use of a new sensitive assay for quantifying
integrated provirus. J. Virol.77:10119–10124.
3.Das, K., et al.2004. Roles of conformational and positional adaptability in structure-based design of TMC125-R165335 (etravirine) and related non-nucleoside reverse transcriptase inhibitors that are highly potent and effec-tive against wild-type and drug-resistant HIV-1 variants. J. Med. Chem.
47:2550–2560.
4.Donahue, D. A., et al.2010. Stage-dependent inhibition of HIV-1 replication
by antiretroviral drugs in cell culture. Antimicrob. Agents Chemother.54:
1047–1054.
5.Dorr, P., et al.2005. Maraviroc (UK-427,857), a potent, orally bioavailable, and selective small-molecule inhibitor of chemokine receptor CCR5 with broad-spectrum anti-human immunodeficiency virus type 1 activity.
Antimi-crob. Agents Chemother.49:4721–4732.
6.Fatkenheuer, G., et al.2005. Efficacy of short-term monotherapy with mara-viroc, a new CCR5 antagonist, in patients infected with HIV-1. Nat. Med.
11:1170–1172.
7.Goebel, F., et al.2006. Short-term antiviral activity of TMC278—a novel
NNRTI—in treatment-naive HIV-1-infected subjects. AIDS20:1721–1726.
8.Goicoechea, M., et al.2010. Abacavir and tenofovir disoproxil fumarate co-administration results in a nonadditive antiviral effect in HIV-1-infected
patients. AIDS24:707–716.
9.Grobler, J. A., et al.2007. HIV-1 reverse transcriptase plus-strand initiation exhibits preferential sensitivity to non-nucleoside reverse transcriptase
in-hibitors in vitro. J. Biol. Chem.282:8005–8010.
10.Grossman, Z., et al.1999. Ongoing HIV dissemination during HAART. Nat.
Med.5:1099–1104.
11.Hare, S., S. S. Gupta, E. Valkov, A. Engelman, and P. Cherepanov.2010. Retroviral intasome assembly and inhibition of DNA strand transfer. Nature
464:232–236.
12.Hazuda, D. J., et al.2000. Inhibitors of strand transfer that prevent
integra-tion and inhibit HIV-1 replicaintegra-tion in cells. Science287:646–650.
13.Herz, A. V., S. Bonhoeffer, R. M. Anderson, R. M. May, and M. A. Nowak.
1996. Viral dynamics in vivo: limitations on estimates of intracellular delay
and virus decay. Proc. Natl. Acad. Sci. U. S. A.93:7247–7251.
14.Ho, D. D., et al.1995. Rapid turnover of plasma virions and CD4
lympho-cytes in HIV-1 infection. Nature373:123–126.
15.Hughes, A., T. Barber, and M. Nelson.2008. New treatment options for HIV salvage patients: an overview of second generation PIs, NNRTIs, integrase
inhibitors and CCR5 antagonists. J. Infect.57:1–10.
16.Jung, A., et al.2002. Multiply infected spleen cells in HIV patients. Nature
418:144.
17.Kilby, J. M., et al.1998. Potent suppression of HIV-1 replication in humans
by T-20, a peptide inhibitor of gp41-mediated virus entry. Nat. Med.4:1302–
1307.
18.Kim, S. Y., R. Byrn, J. Groopman, and D. Baltimore.1989. Temporal aspects of DNA and RNA synthesis during human immunodeficiency virus infection:
evidence for differential gene expression. J. Virol.63:3708–3713.
on November 7, 2019 by guest
http://jvi.asm.org/
19.Kumar, P. N., et al. 1999. Safety and pharmacokinetics of abacavir (1592U89) following oral administration of escalating single doses in human immunodeficiency virus type 1-infected adults. Antimicrob. Agents
Che-mother.43:603–608.
20.Kuritzkes, D. R., et al.2007. Plasma HIV-1 RNA dynamics in antiretroviral-naive subjects receiving either triple-nucleoside or efavirenz-containing
reg-imens: ACTG A5166s. J. Infect. Dis.195:1169–1176.
21.Lloyd, A. L.2001. The dependence of viral parameter estimates on the assumed viral life cycle: limitations of studies of viral load data. Proc. Biol.
Sci.268:847–854.
22.Louie, M., et al.2003. Determining the relative efficacy of highly active
antiretroviral therapy. J. Infect. Dis.187:896–900.
23.Markowitz, M., et al.2003. A novel antiviral intervention results in more accurate assessment of human immunodeficiency virus type 1 replication
dynamics and T-cell decay in vivo. J. Virol.77:5037–5038.
24.Markowitz, M., et al.2006. Antiretroviral activity, pharmacokinetics, and tolerability of MK-0518, a novel inhibitor of HIV-1 integrase, dosed as monotherapy for 10 days in treatment-naive HIV-1-infected individuals. J.
Acquir. Immune Defic. Syndr.43:509–515.
25.Moyle, G. J., et al.1998. Safety, pharmacokinetics, and antiretroviral activity of the potent, specific human immunodeficiency virus protease inhibitor nelfinavir: results of a phase I/II trial and extended follow-up in patients
infected with human immunodeficiency virus. J. Clin. Pharmacol.38:736–
743.
26.Murray, J. M., et al.2007. Antiretroviral therapy with the integrase inhibitor raltegravir alters decay kinetics of HIV, significantly reducing the second
phase. AIDS21:2315–2321.
27.Palmer, S., et al.2008. Low-level viremia persists for at least 7 years in patients on suppressive antiretroviral therapy. Proc. Natl. Acad. Sci. U. S. A.
105:3879–3884.
28.Perelson, A. S.2002. Modelling viral and immune system dynamics. Nat.
Rev. Immunol.2:28–36.
29.Perelson, A. S., et al.1997. Decay characteristics of HIV-1-infected
com-partments during combination therapy. Nature387:188–191.
30.Perelson, A. S., A. U. Neumann, M. Markowitz, J. M. Leonard, and D. D. Ho.
1996. HIV-1 dynamics in vivo: virion clearance rate, infected cell life-span,
and viral generation time. Science271:1582–1586.
31.Pinheiro, J. C., and D. M. Bates.2000. Mixed-effects models in S and S-Plus. Springer-Verlag, New York, NY.
32.Plipat, N., P. K. Ruan, T. Fenton, and R. Yogev.2004. Rapid human immu-nodeficiency virus decay in highly active antiretroviral therapy
(HAART)-experienced children after starting mega-HAART. J. Virol.78:11272–11275.
33.Quan, Y., L. Rong, C. Liang, and M. A. Wainberg.1999. Reverse transcrip-tase inhibitors can selectively block the synthesis of differently sized viral DNA transcripts in cells acutely infected with human immunodeficiency
virus type 1. J. Virol.73:6700–6707.
34.Ramratnam, B., et al.1999. Rapid production and clearance of HIV-1 and
hepatitis C virus assessed by large volume plasma apheresis. Lancet354:
1782–1785.
35.Sedaghat, A. R., J. B. Dinoso, L. Shen, C. O. Wilke, and R. F. Siliciano.2008. Decay dynamics of HIV-1 depend on the inhibited stages of the viral life
cycle. Proc. Natl. Acad. Sci.105:4832–4837.
36.Smith, B. A., et al.2001. Persistence of infectious HIV on follicular dendritic
cells. J. Immunol.166:690–696.
37.Spence, R. A., W. M. Kati, K. S. Anderson, and K. A. Johnson.1995. Mechanism of inhibition of HIV-1 reverse transcriptase by nonnucleoside
inhibitors. Science267:988–993.
38.van’t Wout, A. B., et al.2003. Cellular gene expression upon human
immu-nodeficiency virus type 1 infection of CD4⫹-T-cell lines. J. Virol.77:1392–
1402.
39.Wei, X., et al.1995. Viral dynamics in human immunodeficiency virus type 1
infection. Nature373:117–122.
40.Wiegers, K., et al.1998. Sequential steps in human immunodeficiency virus particle maturation revealed by alterations of individual gag polyprotein
cleavage sites. J. Virol.72:2846–2854.
41.Zhang, Z., et al.1999. Sexual transmission and propagation of SIV and HIV
in resting and activated CD4⫹T cells. Science286:1353–1357.