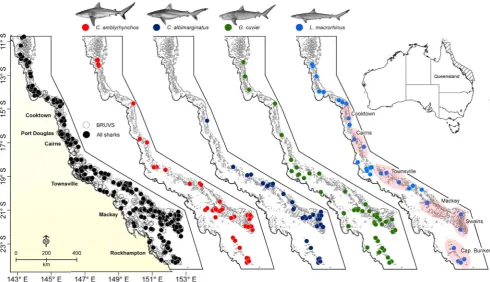
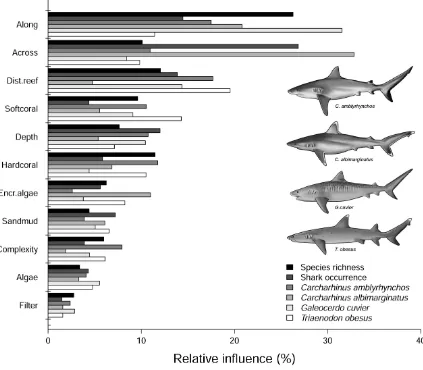
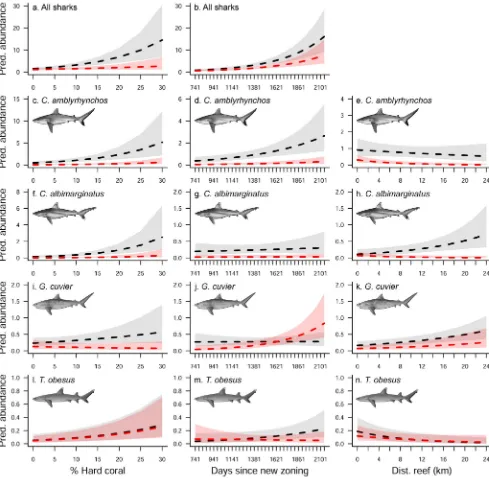
Quantifying shark distribution patterns and species-habitat associations: implications of marine park zoning
Full text
Figure


Related documents
ex-factory (gate) price for various users should be rationalized, and the existing natural gas pricing mechanism should be improved; natural gas infrastructure pricing mechanism
Investors can gain passive exposure to commodities by investing in a basket of futures, through Exchange Traded Funds and Exchange Traded Notes, or via index swaps.. The costs
The paper has also benefited from discussions with Atila Abdulkadiroglu, Filippo Taddei, Guido Sandleris and seminar participants at Columbia University, CREI, ETSG Athens,
2 A beginners’ guide Contents Programming principles Interpreting commands Reusable functionality Types of data Python objects Variables Basic data types Numbers Text strings
Obviously there are areas in the country which are weak, due to low membership numbers, and having branches of solely mature members in these areas need to be encouraged to
Phase angle vs frequency curve analysis The infrared radiation value vs time curve of the thermal anomalies and sound area in the steel pipeline is shown in Fig.. From the curve,
In summary, for detection of multilayer lead-steel bonded structure, periodic pulsed thermography can detect smaller defect than single pulsed thermography and it has
Exploring approaches used in diverse environments may help to reveal alternative diversity approaches (beyond colorblindness and multiculturalism) that people use to


