Research
Navigating trade-offs in land-use planning: integrating human well-being
into objective setting
Vanessa M. Adams 1,2,3, Robert L. Pressey 2,3 and Natalie Stoeckl 3,4
ABSTRACT. There is an increasing demand for development of natural resources, which can be accompanied by environmental degradation. Planning for multiple land uses requires navigating trade-offs between social, economic, and environmental outcomes arising from different possible futures. To explore these trade-offs, we use the Daly River catchment, in Australia’s Northern Territory, as a case study. The catchment contains areas of priority for both conservation and development. In response to the challenge of navigating the required trade-offs, the Daly River Management Advisory Committee (DRMAC) initiated a land-use plan for the region. Both development and conservation of natural resources in the catchment will affect human well-being and the long-term provisioning of ecosystem services in diverse ways. To understand some of these impacts, an innovative engagement process was designed to elicit the relative importance of key factors to residents’ well-being. The process identified 19 well-being factors grouped into four domains: biodiversity, socio-cultural, recreational, and commercial. Overall, the highest-ranked well-being factors were in the social-cultural and biodiversity domains while commercial values were ranked the least important. Respondents reported low satisfaction with commercial factors as well, noting concerns over environmental impacts from existing developments and sustainability of future developments. We identified differences in the reported importance values for several types of stakeholders, most notably between indigenous respondents and those employed in the agricultural sectors. Indigenous respondents placed greater importance on biodiversity and socio-cultural factors. Agricultural respondents placed greater importance on commercial factors. The outcomes of our engagement were integrated into DRMAC’s process of objective-setting to ensure that objectives for each domain were included in land-use planning. Our results can also anticipate potential conflicts between different stakeholders and changes in well-being associated with different land uses. We describe how our findings will inform the next stages of stakeholder engagement and comment on the utility of such an approach for integrating well-being into objective setting for land-use and scenario planning.
Key Words: development; human well-being; land-use planning; objective setting; stakeholder engagement; systematic conservation planning
INTRODUCTION
Conservation objectives have historically focused on ecological outcomes and relied on available science and expert knowledge (Margules and Pressey 2000), but recent contributions have advanced thinking about objectives to also address social objectives such as livelihoods (Pressey and Bottrill 2009). The shift in systematic conservation planning to consider a broader range of objectives has been accompanied by technical advances in available decision-support tools (e.g., Watts et al. 2009). These advances have facilitated more complex approaches to systematic conservation planning that support more holistic spatial approaches in which multiple uses are considered and planned for explicitly. Studies that consider multiple land uses have demonstrated that potential conflicts can be minimized by explicitly accounting for associated trade-offs (Polasky et al. 2005, 2008, Wilson et al. 2010, Venter et al. 2013).
The push to extend conservation planning to include social and economic considerations reflects a broader recognition that plans need to involve stakeholders throughout the planning process to maximize the likelihood of implementation (Knight et al. 2006). The importance of involving stakeholders will probably increase as plans become more comprehensive by integrating multiple land uses, and thereby expand the complexity of potential socioeconomic values and likely trade-offs that will have to be considered (Tallis et al. 2008, McShane et al. 2011). However, even
in conservation planning processes with documented stakeholder participation, engagement still typically focuses on stakeholder values relating to planning products, such as proposed maps of protection, rather than their involvement in setting objectives and measuring potential outcomes against these objectives (e.g., Fernandes et al. 2005, Game et al. 2011, Syakur et al. 2012). A clear gap in approaches to conservation planning is the incorporation of stakeholder values into planning objectives to both direct the plan and measure the outcomes. This level of consultation can be difficult for regional plans that affect large populations with diverse stakeholders and interactions between them.
One approach to more meaningful consultation with stakeholders is through the lens of human well-being. Human well-being and its connection to the environment became widely recognized through the Millennium Ecosystem Assessment (Millennium Ecosystem Assessment 2005). Well-being has been a key framework, in particular, for valuing and managing ecosystem services (e.g., Costanza et al. 1997, Maynard et al. 2010), exploring social preferences (e.g., Malinga et al. 2013), and identifying priorities for policy (for Index of Dissatisfaction measure see Larson 2009, Larson et al. 2013). Although human well-being has received an increased focus by academics, policy makers, and practitioners, an understanding of the links between well-being and the natural environment remains a gap in the science and
application of planning (Summers et al. 2012). Studies that explore the relationship between natural resources and well-being are thus timely (e.g., Marans 2003, Costanza et al. 2007, Summers et al. 2012).
Integrating residents’ preferences at the outset of a planning exercise via their contributions to objectives could ensure that the plan is well aligned with stakeholder values and therefore more socially acceptable (Knight et al. 2006). Although participatory objective setting has been utilized and explored in the related fields of environmental and land-use change planning, particularly through scenario development and evaluation (e.g., see Salter et al. 2009, de Groot et al. 2010, Malinga et al. 2013), it remains underexplored in systematic conservation planning. In addition, expanding conservation planning to consider multiple land uses requires decisions about potentially competing land uses that can result in variable impacts on different aspects of well-being. This decision process can be supported by methods applied in related fields such as the explicit evaluation of potential trade-offs (Polasky et al. 2008) or collective visioning to explore innovative responses to future changes (Barnaud et al. 2013). Different stakeholders or groups of stakeholders will likely have different preferences associated with plan objectives. As such, conservation planning processes that seek to embed the “values” of people within them will differ depending on the groups of stakeholders involved. In our study, we show how the views of residents can be used within the planning process, noting that the same methodological approach could be used with different stakeholders, e.g., a cross-section of residents at the state or country level. We demonstrate how our approach to integrating stakeholder preferences, through eliciting the relative importance of different well-being factors, can inform both the design and evaluations of land-use scenarios, which are themselves tools for understanding the acceptability of alternative futures for regions.
Here we aim to fill two important gaps in conservation planning: elucidating the relative importance of different well-being factors to stakeholders and the links between these factors and the natural environment; and using the relative importance of different well-being factors to inform plan objectives and measure plan outcomes. We use the conceptual framework of human well-being and an associated Index of Dissatisfaction for well-being factors (Larson 2009) to quantify the relative importance of well-being factors to different stakeholders and identify management priorities. We use the data on well-being to inform objectives for a land-use plan in a region with conflicting views about desirable future land uses and a process underway to plan for conservation and development. We also discuss the potential use of such an approach in identifying appropriate indicators in scenario analyses and cumulative impact assessments (Peterson et al. 2003, Weber et al. 2012).
METHODS
Planning region and process
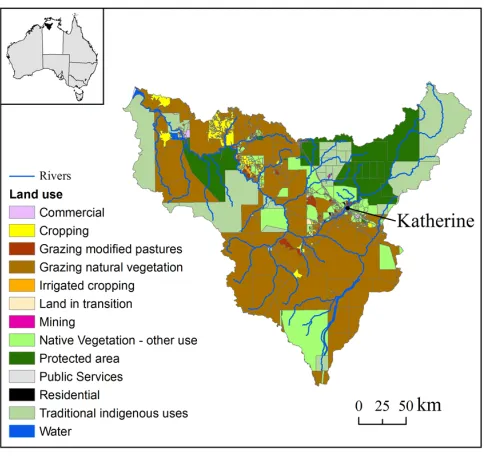
The planning region is the whole of the Daly River catchment in the Northern Territory, Australia (Fig. 1). The Daly catchment covers approximately 5.2 million ha, extending from the coastline southwest of Darwin to 250 km inland. The Daly River and its main tributaries are themselves important conservation features, the Daly being one of northern Australia’s largest rivers and with
[image:2.612.316.558.248.477.2]unusually consistent year-round flow. Riparian strips contain some of the most extensive gallery (rainforest) vegetation in the Northern Territory. In addition, the catchment is a high priority for development, having been identified as one of the only parts of the Northern Territory suitable for rain-fed crops (based on climate) and with potential for extensive irrigation, based on soil characteristics and both surface and subsurface hydrology (Pascoe-Bell et al. 2011). There is a clear need to jointly identify priorities for development and conservation, and to resolve conflicts between them.
Fig. 1. Daly catchment property boundaries and land use as
defined by ABARES land-use mapping. Inset shows the Northern Territory (white) and the Daly catchment (black).
In 2011 the Daly River Management Advisory Committee (DRMAC) commissioned our involvement as independent researchers to undertake an integrated conservation and development planning process. DRMAC was created in 2006 to work with relevant government agencies to advise on sustainable resource use and conservation in the Daly catchment. DRMAC promotes high standards of management of land and water and advises the relevant minister. The design of the Daly clearing guidelines (NRETAS 2010) and water allocation plans relied on direct involvement by DRMAC. DRMAC is composed of a chair and 12 members representing all major stakeholders in the catchment, except the mining and energy sectors. Included are three indigenous landowner representatives selected by the Aboriginal Reference Group (ARG) that comprises 12 language groups. DRMAC’s representative structure supports collaborative decision-making processes with strong ties to research providers, decision makers such as ministers, and members of local communities (Dale et al. 2014).
(year 2) and production of land-use scenarios and follow-up engagement to identify a preferred final land-use scenario (year 3). The results of this study focus mainly on the engagement process and its outcomes. The three-year planning process broadly follows the 11-stage process of systematic conservation planning outlined by Pressey and Bottrill (2009).
Fig. 2. The planning and engagement process for the Daly
River catchment, designed in collaboration with the Daly River Management Advisory Committee (DRMAC). (a) The planning process broadly followed the 11-stage systematic conservation planning process outlined by Pressey and Bottrill (2009). The stages are represented here in a circular fashion because DRMAC focuses on an adaptive management approach and, realistically, any regional plan is subject to refinements and adjustments (Pressey et al. 2013), especially during implementation and monitoring. (b) The process of stakeholder engagement was designed to focus on the stages from objective setting to systematic planning and assessment (rectangle in part a). Stages with stars indicate recognition of feedback from stakeholders. The engagement process includes: (1) DRMAC objective-setting sessions; (2) Elicitation of resident well-being factors (this stage, described in the Methods, involved two open forums to raise awareness of the planning process and purpose of engagement, five stakeholder focus groups to inform survey design and content, followed by a mail survey to catchment residents and then integration of well-being factors into the plan’s objectives, as indicated by the first star); (3) Designing future land-use scenarios based on plan objectives; (4) Integration of future scenarios and well-being preferences and satisfaction ratings for catchment changes to assess potential impacts of scenarios on social, economic, and environmental aspects of life in the catchment, indicated by second star; and (5) Presentation of scenarios to stakeholder groups to further refine objectives and identify a final land-use scenario for the development and conservation plan, indicated by third star.
Planning for the Daly catchment was initiated with a feedback session with DRMAC in which a clear problem statement was drafted and the solution was to design a strategic plan for development and conservation in the catchment. The next step was to set explicit objectives for the plan. We undertook a series of objective-setting sessions with DRMAC to first identify qualitative goals for conservation and development and their associated actions (Table 1). Based on these goals, we compiled
all available data on relevant spatially discrete features from government and scientific experts. These data sets were then presented to DRMAC and a final session identified quantitative spatial objectives based on qualitative goals and spatial data (see Pressey and Bottrill 2009 regarding the generic nature of this process in conservation planning). The objectives reflected existing policy, such as government protection targets to meet Convention on Biological Diversity commitments (CBD 2010), relevant legislation, and plans that inform land uses, e.g., clearing guidelines (NRETAS 2010), or the expressed views of experts and other stakeholders (Table 1). These objectives will be an integral component of spatial planning for the catchment, influencing the selection of areas for development and conservation with planning software (Ball et al. 2009, Watts et al. 2009).
With spatial objectives in place, the next stages of the planning process will develop and test different land-use scenarios before selecting a final scenario for the plan. Land-use scenarios will be designed using Marxan with zones (Watts et al. 2009) to optimally plan for multiple land uses while meeting objectives. The land-use scenarios will be coupled with water-use profiles for agricultural land and assessed using an existing tool for evaluation of management scenarios developed for the Daly (Pantus et al. 2011). The final plan will involve the land-use scenario, or a variation thereof, which meets the stated objectives and is best aligned with stakeholders’ preferences. Selection of the final land-use scenario and implementation of the plan was to be guided by DRMAC through adaptive planning, including refinement of objectives, updating of the plan, and evaluation of ongoing resource-use decisions. However, in 2013, the government chose to discontinue support of DRMAC. We have therefore proceeded with the final phase of planning by shifting our feedback from DRMAC to the government and relevant stakeholders, those who were members of DRMAC as well as the broader public within the catchment. Implementation of the plan is uncertain but the plan’s outcomes will be provided to both appropriate NT Government departments and a newly formed Territory-wide catchment advisory committee (NTCAC).
Strategy for stakeholder engagement
DRMAC requested a broad process of community engagement, in addition to engagement with key representatives of stakeholders. DRMAC, as the commissioning body for the plan, agreed to manage the process of setting objectives, but wanted to ensure that the objectives reflected people’s ties to and expectations about the catchment. An engagement strategy was therefore designed to include community forums, focus groups, and a survey sent to all residents of the catchment (Fig. 2b), with scope for feedback from stakeholders to refine objectives and direct subsequent stages of planning. DRMAC requested that the engagement process focus on eliciting the preferences of catchment residents. This reflected DRMAC’s catchment-specific role, as well as the availability of previous research that has identified broader regional and national perspectives on values associated with the Daly catchment (e.g., Zander et al. 2010, 2013, Zander and Straton 2010, Larson et al. 2013).
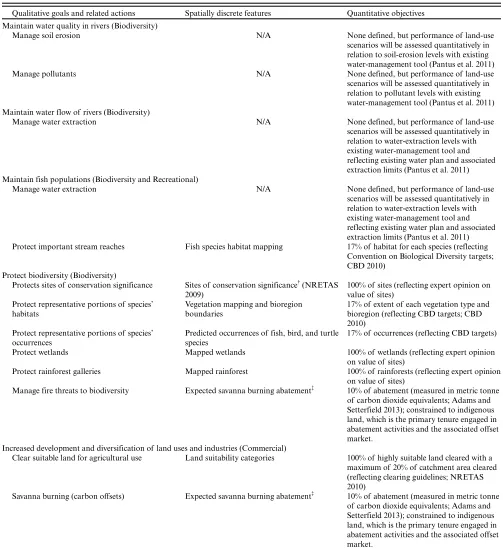
Table 1. Qualitative goals related to well-being identified through the objective-setting process with the Daly River Management
Advisory Committee (DRMAC). Each broad qualitative goal was mapped to one or more of the four well-being domains that focus groups identified. Under each goal, the associated actions, available mapped features, and spatial, quantitative objectives are listed. N/ A indicates that there were no available map products.
Qualitative goals and related actions Spatially discrete features Quantitative objectives Maintain water quality in rivers (Biodiversity)
Manage soil erosion N/A None defined, but performance of land-use
scenarios will be assessed quantitatively in relation to soil-erosion levels with existing water-management tool (Pantus et al. 2011)
Manage pollutants N/A None defined, but performance of land-use
scenarios will be assessed quantitatively in relation to pollutant levels with existing water-management tool (Pantus et al. 2011) Maintain water flow of rivers (Biodiversity)
Manage water extraction N/A None defined, but performance of land-use
scenarios will be assessed quantitatively in relation to water-extraction levels with existing water-management tool and reflecting existing water plan and associated extraction limits (Pantus et al. 2011) Maintain fish populations (Biodiversity and Recreational)
Manage water extraction N/A None defined, but performance of land-use
scenarios will be assessed quantitatively in relation to water-extraction levels with existing water-management tool and reflecting existing water plan and associated extraction limits (Pantus et al. 2011) Protect important stream reaches Fish species habitat mapping 17% of habitat for each species (reflecting
Convention on Biological Diversity targets; CBD 2010)
Protect biodiversity (Biodiversity)
Protects sites of conservation significance Sites of conservation significance† (NRETAS 2009)
100% of sites (reflecting expert opinion on value of sites)
Protect representative portions of species’ habitats
Vegetation mapping and bioregion boundaries
17% of extent of each vegetation type and bioregion (reflecting CBD targets; CBD 2010)
Protect representative portions of species’ occurrences
Predicted occurrences of fish, bird, and turtle species
17% of occurrences (reflecting CBD targets)
Protect wetlands Mapped wetlands 100% of wetlands (reflecting expert opinion
on value of sites)
Protect rainforest galleries Mapped rainforest 100% of rainforests (reflecting expert opinion on value of sites)
Manage fire threats to biodiversity Expected savanna burning abatement‡ 10% of abatement (measured in metric tonne of carbon dioxide equivalents; Adams and Setterfield 2013); constrained to indigenous land, which is the primary tenure engaged in abatement activities and the associated offset market.
Increased development and diversification of land uses and industries (Commercial)
Clear suitable land for agricultural use Land suitability categories 100% of highly suitable land cleared with a maximum of 20% of catchment area cleared (reflecting clearing guidelines; NRETAS 2010)
Savanna burning (carbon offsets) Expected savanna burning abatement‡ 10% of abatement (measured in metric tonne of carbon dioxide equivalents; Adams and Setterfield 2013); constrained to indigenous land, which is the primary tenure engaged in abatement activities and the associated offset market.
[image:4.612.52.555.141.691.2]Proper use of land and natural resources (Commercial)
Constrain land clearing to suitable land Land suitability categories Allow clearing only on suitable land Develop new settlements and townships (Social-Cultural)
Invest in infrastructure, release land to develop new settlements, and build critical mass in existing communities
N/A Required infrastructure and associated costs assessed postplanning
Maintain and protect indigenous cultural sites (Social-Cultural)
Protect identified indigenous cultural sites No available data. This type of data is highly guarded and difficult to elicit. Although there are methods for data elicitation and management on cultural sites, it was determined that this goal was outside the scope of the planning process. Groups such as the Aboriginal Reference Group or the Aboriginal Areas Protection Authority are likely to play a role in protecting sites as land-use changes occur.
None defined
Maintain important social and cultural sites (Social-Cultural and Recreational) Protect important social-cultural sites and
recreational spots
Inclusion of sites from survey data asking respondents to report those they would like protected. These are not considered to be sensitive in terms of cultural values.
100% of consensus sites
†The Northern Territory Government undertook an assessment of conservation and heritage values and identified 67 of the most important sites for biodiversity conservation across the Territory, some of which are in the Daly catchment. By definition, these sites need adequate protective management.
‡Savanna burning is an approved methodology for greenhouse-gas abatement under the Carbon Farming Initiative (CFI) in Australia (DCCEE 2011). It involves fire management to reduce the extent and timing of fires, by burning earlier in the dry season, and so reduce the total emissions associated with annual fires. Current enrolled properties for savanna-burning credits under the CFI are all indigenous.
survey was designed to elicit stakeholder preferences for different well-being factors and their satisfaction with potential changes in the catchment associated with both development and conservation. To inform the design of the survey, five focus groups were arranged. The survey results reported here will be used for three primary purposes: refining plan objectives, designing land-use scenarios, and targeting future engagement with stakeholder groups that have different preferences and could therefore play an integral role in building consensus around a final land-use scenario. In addition, there will be targeted engagement with groups that were not well sampled in the initial process described here. Because DRMAC was the original commissioner and planned implementer of the plan, the focus on resident preferences was consistent with the governing body’s priorities and broader responsibilities. However, given the change in DRMAC’s status and shift in the plan implementation strategy, there could be a disconnect between resident preferences and the broader Northern Territory Government policy for the catchment. One way of navigating the potential disconnect in resident preferences and government policy is to explicitly include relevant government departments in future engagement processes to help build consensus around a final land-use scenario both at a local resident level and at a broader territory level.
Focus groups and survey design
We chose the conceptual framework of human well-being to elicit a subjective quantification of the factors influencing well-being that were most important to respondents living in the Daly catchment. We chose human well-being as the framework because it comprises basic human needs, economic needs, environmental needs, and subjective happiness (Costanza et al. 2007, Summers et al. 2012) and is therefore well suited for understanding how
broad land-use changes, such as clearing for intensive agriculture or increasing nature reserves, might result in changes across these components. Furthermore, there is a substantive body of literature on subjective well-being and overall life satisfaction as an alternative way of looking at the “value” of the environment (Kristoffersen 2010) and there is widespread consensus that self-reported measures of life satisfaction are valid, replicable, and reliable (Diener 2009). Furthermore, we also wanted to identify priority areas for policy makers. Therefore, we selected the approach developed by Larson (2010) that first seeks to identify factors that individuals feel are important to their overall well-being, by asking them (thus a bottom-up, rather than top-down approach). It then asks people to indicate how important each of those factors are using a quantitative scale, and how satisfied they are with each factor. Finally, it calculates a composite metric of importance and satisfaction for identifying priorities.
Table 2. Final list of well-being factors and associated broad domains used in the survey.
Statements about well-being factors Domain
1. The river provides habitat for iconic species (like barramundi, black bream, long-neck turtles, sawfish) Biodiversity 2. The catchment provides habitat for a variety of plants and animals Biodiversity 3. A place where the river flows naturally and there are no dams Biodiversity 4. A place for natural heritage (e.g., important National Parks and unique environments) Biodiversity
5. A place for development and intensified production Commercial
6. The tourism industry in the catchment provides jobs and income Commercial
7. The agricultural industry in the catchment provides jobs and income Commercial
8. The mining industry in the catchment provides jobs and income Commercial
9. The cattle industry in the catchment provides jobs and income Commercial
10. The forestry industry in the catchment provides jobs and income Commercial 11. A place that is relatively free from congestion and major development Social-Cultural
12. A place that supports families and communities Social-Cultural
13. A place to preserve traditional (e.g. Indigenous) cultural values Social-Cultural
14. A place for research, teaching, and learning Social-Cultural
15. It is important to keep the area in good condition for future generations Social-Cultural 16. Even if I could never visit ANY part of the Daly, I would still like to know “it is there” Social-Cultural
17. Fishing and hunting for fun Recreational
18. Swimming, camping, boating, being in country Recreational
19. Fishing and hunting for fresh food Recreational
Things you like to do, places you like to visit, how you get by?” A person from each group summarized key points from the discussion and the lists were placed on walls around the room. Each participant was then given five “votes” (stickers) to be allocated across the items they thought were most important to assess. They could place all stickers on one item or distribute them across separate items. We then compiled the list of items and asked participants to assign them to broad domains: biodiversity, commercial, social-cultural, and recreational. Participants were then given a break and the list of items that received “votes” was organized by domain and placed on display. Participants were then asked to provide feedback on whether they felt the list of items was incomplete. They were also asked to engage in a group discussion about any concerns they had about their lives in the catchment at the time or about any potential changes to their lives in the catchment in the future.
A final list of well-being factors was compiled based on the five focus groups and structured to comprehensively include the top-priority items (those with “votes”) identified by the groups. This list was then circulated to focus-group attendees who had agreed to give further feedback and also to relevant representatives of government agencies and communities. These individuals were asked to provide feedback on the completeness of the list. The engagement process to this point provided a basis for designing the survey.
The survey was designed to elicit four types of data: (1) frequency of recreational activities in the catchment and any areas of importance for recreation or protection, (2) well-being importance and satisfaction, (3) satisfaction with hypothetical changes to land uses in the catchment, and (4) socio-demographic background. The final well-being factors included in the survey contained 19 factors grouped into four domains based on information from the focus groups. Table 2 lists the well-being factors presented in the survey. In case this list was not representative of all aspects of well-being, we included the option for survey respondents to list additional items; however, only six
respondents took advantage of this option, indicating that our list was reasonably comprehensive.
We selected a scale of 0-10 for respondents to rate both the importance of and satisfaction with the current state of each well-being factor, with 0 well-being not at all important/completely dissatisfied and 10 being very important/completely satisfied (for a discussion on methodological issues and appropriates of Likert scale measure see Cummins 2003). The list of hypothetical changes identified from the group discussions, about which residents in the catchment were concerned, included: (1) characteristics of life in the catchment such as the level of community support and infrastructure; (2) changes in industry and associated land uses in the catchment; and (3) environmental changes such as the level of water in the Daly River (currently no dams and relatively little extraction), amount of clearing of native vegetation, and overall health of native plants and animals. In addition, the issue of land clearing was a topic raised consistently in focus groups. We therefore included two separate questions in the survey relating to hypothetical changes in the catchment. The first was a list of hypothetical changes relating to life in the catchment (community, social aspects, industry, and environment) and the second was about incremental increases in clearing (from 10 - 100%). Respondents were asked to provide their level of satisfaction for each change, from 10 to 100% in 10% increments, using a 9-point Likert scale. Current property clearing within the catchment ranges widely from very small percentages up to nearly complete clearing. In addition, focus groups revealed variability in participants’ responses to acceptable levels of clearing both at the property and catchment scales. To enable us to distinguish preferences for incremental clearing, we therefore used a finely graded Likert scale coupled with small clearing increments across the full range of potential clearing.
Data collection and analyses
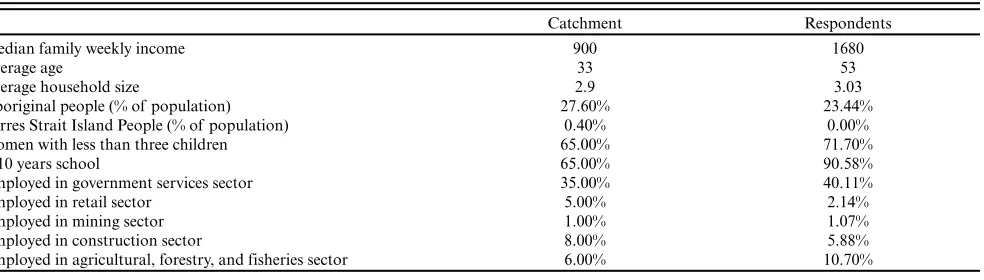
Table 3. Characteristics of respondents and of residents in the Daly River catchment (catchment resident statistics derived from
Australian Beareau of Statistics census data summarized at the catchment level, Larson and Alexandridis 2009).
Catchment Respondents
Median family weekly income 900 1680
Average age 33 53
Average household size 2.9 3.03
Aboriginal people (% of population) 27.60% 23.44%
Torres Strait Island People (% of population) 0.40% 0.00%
Women with less than three children 65.00% 71.70%
> 10 years school 65.00% 90.58%
Employed in government services sector 35.00% 40.11%
Employed in retail sector 5.00% 2.14%
Employed in mining sector 1.00% 1.07%
Employed in construction sector 8.00% 5.88%
Employed in agricultural, forestry, and fisheries sector 6.00% 10.70%
survey sent in May 2013 and replacement surveys sent two and five months later. Of the 2387 addresses contacted, 20 requested to be removed from the survey and 767 addresses were no longer active, leaving a total of 1600 possible respondents. The questionnaires were supplemented by 26 surveys completed through one-on-one interviews specifically targeting indigenous residents who typically have low response rates in mail-out surveys (Larson et al. 2013). The response rate to the survey (about 13%, or 209 of 1600 households) was slightly less than that of similar surveys in the region (16-25% response rate for region reported; Zander et al. 2010, Adams et al. 2012, Larson et al. 2013). The low response rate was probably attributable to survey fatigue, with a large number of academic, rural, and census surveys having been conducted in this region in recent years. Although the low response rate means that our results are not considered representative of the entire catchment population, we did find important differences in preferences between stakeholder groups that do not rely on an assumption of “representativeness” to usefully guide further engagement and inform plan objectives. Of the responses received, equal numbers were from males and females and respondents were representative of characteristics of catchment households and employment sectors (Table 3). Respondents were not, however, representative of income, education, or age, parameters for which were all above those for the catchment generally (Table 3), but in line with other survey responses from the region (Larson et al. 2013).
We analyzed the survey data in several ways. We calculated the mean importance scores for the 19 well-being factors and confidence intervals around the means. We tested for differences in reported preferences for well-being factors between different stakeholders based on reported socio-demographic characteristics. To do this, we developed explanatory linear regression models of responses for each well-being factor in relation to possible influencing factors, using forward and backward removal to select the best subset of predictors for each model. The best-fit model was selected using Akaike’s information criterion (AIC). We explored both linear regression and ordered logistic regression and found both gave almost identical results. We therefore report the linear regression models. Based on the 19 regressions, we identified two key stakeholder groups that were associated with different factors: indigenous respondents and respondents who earn an income from agriculture (livestock and crops aggregated
to reflect sector statistics for catchment). We therefore explored the stated preferences for these two groups by comparing their average importance scores and confidence intervals at the broad domain level (averaged responses across statements for each domain). To identify potential priorities for management and policy, we used a method developed by Larson (2010) in which a composite index, the Index of Dissatisfaction, is used to identify policy priorities based on either high importance or high dissatisfaction. The Index of Dissatisfaction for well-being factor k (IDSk) is calculated as:
(1)
where I is importance, D is dissatisfaction (the inverse of
satisfaction S calculated as 10-S), nk is the number of respondents
who reported both satisfaction and importance scores for well-being factor k, and N is the total number of respondents. Last, we calculated the mean reported satisfaction (reported on a 9-point Likert scale) for hypothetical changes in the catchment.
RESULTS
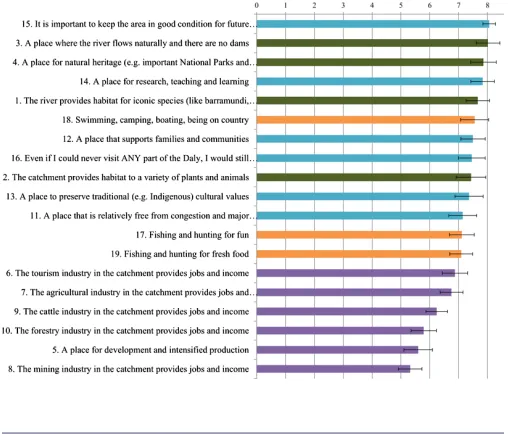
The highest ranked well-being factors were in the socio-cultural and biodiversity domains (Fig. 3). The well-being factor “It is important to keep the area in good condition for future generations” had the highest mean importance and smallest confidence interval, indicating strong concurrence among respondents about the importance of maintaining the condition of the Daly catchment. Commercial factors were ranked least important and the confidence intervals for commercial factors did not overlap with the top-ranked well-being factors in the biodiversity and socio-cultural domains (Fig. 3).
[image:7.612.63.555.121.261.2]Table 4. Characteristics of respondents (n = 141) determining the importance of the 19 factors tested. Characteristics included in the
best explanatory model of importance factors for each factor are displayed by plus or minus, indicating that the variable had a positive or negative relationship, respectively, with the perceived importance of the factor.
1 2 3 4 5 6 7 8 9 10 11 12 13 14 15 16 17 18 19
Male + +
-Has Children + + + +
Age + - - - +
Indigenous + + - - - - + + + + + + +
Size Of Household
- + + + + + +
Catchment Resident
+ + + -
-Self Employed
-Government - - - + + +
Agricultural + + + +
Industry - -
-Passive Income
- - + - + +
Income - + +
[image:8.612.45.299.406.623.2]Adjusted R² 0.098 0.093 0.020 0.076 0.072 0.115 0.122 0.021 0.083 0.077 0.041 0.027 0.047 0.068 0.087 0.172 0.153 0.082 0.118
Fig. 3. Mean importance values and confidence intervals for 19
well-being factors. Color of bar indicates the domain:
biodiversity (green), commercial (purple), social-cultural (blue), recreational (orange).
R² range from 0.02 to 0.172) was not a major concern, given the exploratory nature of these analyses and the lower importance of explanatory power compared to establishing that particular stakeholder groups differed in their associations with well-being factors.
Differences in well-being preferences between the agricultural sector and indigenous respondents were highlighted by the importance values given by these groups to factors grouped in domains (Fig. 4). The confidence intervals for indigenous respondents and those who reported earning an income from agriculture did not overlap
Fig. 4. Average importance values given to well-being factors,
by domain, for three groups of respondents: those earning an income from agriculture, indigenous respondents, and total respondents. Confidence intervals for three of the four domains (circled) do not overlap between indigenous respondents and those who earn an income from agriculture.
[image:8.612.313.559.428.677.2]The factors with the highest Index of Dissatisfaction scores were in the commercial domain, and the dominant reason for highest scores was low reported satisfaction (Table 5). For these factors, respondents noted concerns over environmental impacts from existing developments. They also noted concerns over sustainability of future development and lack of science to inform assessment of impacts as well as a lack of transparent decision making and regulations on industry from government. Respondents also stated concerns over the economic viability of certain industries, in particular the low level of tourism and lasting negative impacts of the live-trade ban on the cattle industry. Recreational factors (well-being factors 17, 18) also had reasonably high IDS scores because of relatively high importance and moderate dissatisfaction, with the primary concern being observed changes in fish abundance. Factors associated with the other two domains (biodiversity, socio-cultural) all had similar satisfaction ratings. Most concerns associated with these factors echoed the already-discussed concerns of observed environmental degradation and lack of transparent decision making.
When asked about potential changes in aspects of daily life in the catchment, respondents reported that they would be strongly dissatisfied with an increase in the cost of living and a reduction in recreation spots but would be strongly satisfied with an increase in infrastructure (Fig. 5). Responses to changes in economics resulted in divergent responses from indigenous respondents and those employed in the agricultural sector, consistent with importance results (Fig. 4). For example, relative to total respondents, indigenous respondents would be more dissatisfied and agricultural respondents more satisfied with an increase in agriculture (mean satisfaction of 2.95 and 6.04, respectively, with nonoverlapping confidence intervals, Fig. 5). Responses to five environmental changes also differed significantly between indigenous and agricultural respondents (Fig. 5).
Across all respondents, satisfaction was greatest for levels of increased clearing of 10 or 20%, but then declined steadily with larger percentages (Fig. 6). However, even for the lowest percentage clearing value (10%), the average satisfaction response was 4.5 reflecting that respondents would be slightly less satisfied with this change. The current clearing across the Daly catchment is approximately 5.5%, so this could reflect a preference for no change to the existing clearing level. In contrast, agricultural respondents were neutral (confidence interval around reported satisfaction includes a value of 5) to clearing up to 30%. Differences in responses to environmental changes between agricultural and indigenous respondents (Fig. 5) were also reflected in responses to levels of future clearing. For increases between 20 and 60%, agricultural respondents were more satisfied than indigenous respondents.
DISCUSSION
[image:9.612.316.558.252.501.2]Our study illustrates one method of eliciting stakeholder preferences for well-being factors that can be used to inform land-use objectives and relevant indicators for changes in residents’ satisfaction with present and possible future conditions in a region. We chose a well-being framework to elicit stakeholder preferences because we can use the elicited data to refine plan objectives that will be used in the design of land-use scenarios. We can also use these data as indicators when testing the impacts of alternative land-use scenarios. Our approach provided a
Fig. 5. Mean satisfaction (0 being much more dissatisfied and 9
being much more satisfied) and confidence intervals for hypothetical changes in the catchment for three groups of respondents: those who earn income from agriculture, indigenous respondents, and total respondents. Changes to daily life (blue) covered cost of living, infrastructure, recreation spots, and population. Economic changes (purple) concerned changes in agriculture, tourism, and mining. Environmental changes (green) were a dam on the Daly, reduction in dry-season water level in the Daly, abundance of trees, and
abundance of fish. Agricultural respondents are shown by solid color, indigenous respondents with diagonal hatching, and total respondents with white bars. Significant differences between agricultural and indigenous respondents are circled.
structured elicitation process for engaging representatives of a region’s population in objective setting and plan design.
We identified 19 well-being factors that aligned with four broad well-being domains: biodiversity, commercial, socio-cultural, and recreational. By eliciting residents’ preferences for these 19 factors, we were able to compare their relative importance across stakeholder groups. Our analysis suggests that, on average, catchment residents place low importance on commercial factors relative to other aspects of well-being (Fig. 2 and 3). This is consistent with findings regarding well-being factors related to water in the same region, indicating that socio-cultural factors were assigned highest importance (Larson et al. 2013, Zander et al. 2013). Our result is also consistent with feedback provided throughout the public engagement process in which residents regularly noted that they moved to the Daly region because of its environmental and social attributes.
Table 5. Index of Dissatisfaction (IDS) for well-being factors; higher values indicate greater importance, less satisfaction, and/or higher
percentages of respondents providing information about the factor. The components of the IDS are provided for each factor: mean importance (I), mean satisfaction (S), and percentage of respondents who provided information about both parameters (%). Mean importance reported here might not exactly match values provided in Figure 3 because only those respondents who answered questions for both importance and satisfaction (n = 145) were included in values for IDS. Reasons for dissatisfaction reported in the survey are given for each factor.
I S % IDS Reasons for dissatisfaction (concerns) 7. The agricultural industry in the catchment
provides jobs and income
6.47 5.99 93.79% 24.37 Environmental impacts (pollution and water extraction)
6. The tourism industry in the catchment provides jobs and income
6.69 6.15 94.48% 24.32 More tourism needed
Need for greater restrictions on where tourists can go 9. The cattle industry in the catchment
provides jobs and income
5.88 5.69 93.79% 23.74 Environmental sustainability
Need for greater restrictions on cattle access to wetlands and river
Impacts of live-trade ban on economic sustainability and associated impacts on families and communities 10. The forestry industry in the catchment
provides jobs and income
5.64 5.41 91.03% 23.55 Concern over proper use of land and water Environmental impacts of forestry (erosion, weeds, water extraction)
5. A place for development and intensified production
5.37 5.15 88.97% 23.2 Lack of transparent decision making from
government (short-term plans serving vested interests instead of sound long-term economic development) 17. Fishing and hunting for fun 7.18 6.71 95.86% 22.62 Decreased fish numbers
Need for greater restrictions on boats and fishing access
18. Swimming, camping, boating, being in country
7.68 7.01 97.93% 22.5
8. The mining industry in the catchment provides jobs and income
5.05 5.13 89.66% 22.04 Pollution
Lack of disclosure and transparency from companies Need for greater restrictions from government History of spills and inadequate clean-up Permanent negative environmental impacts 12. A place that supports families and
communities
7.57 6.94 93.10% 21.56 Loss of community services (like clinics, sports clubs, facilities)
Not enough jobs
Cost of living too high (shops have insufficient selection and prices very high)
Population turnover (people come and go) 4. A place for natural heritage (e.g.,
important national parks and unique environments)
8.06 7.31 97.93% 21.24
15. It is important to keep the area in good condition for future generations
8.17 7.25 93.79% 21.07 Observed environmental degradation, threats (weeds, fire, water extraction, erosion)
14. A place for research, teaching, and learning
7.99 7.23 93.79% 20.76
11. A place that is relatively free from congestion and major development
7.10 6.89 93.79% 20.73
13. A place to preserve traditional (e.g., indigenous) cultural values
7.42 7.01 92.41% 20.48 Hard to get to country to practice culture 2. The catchment provides habitat for a
variety of plants and animals
7.69 7.16 92.41% 20.15
1. The river provides habitat for iconic species (like barramundi, black bream, long-neck turtles, sawfish)
7.89 7.40 90.34% 18.55
3. A place where the river flows naturally and there are no dams
7.98 7.63 95.86% 18.16 Lack of transparent analysis on the costs and benefits of increased water extraction and dams
Dam would change the river irrevocably 16. Even if I could never visit ANY part of
the Daly, I would still like to know “it is there”
7.69 7.48 89.66% 17.35
19. Fishing and hunting for fresh food 7.26 7.46 92.41% 17.03 Decreased fish numbers
Fig. 6. Mean satisfaction (0 being much more dissatisfied and 9
being much more satisfied) and confidence intervals for percentages of clearing in the catchment for three groups of respondents: those who earn an income from agriculture, indigenous respondents, and total respondents. Significant differences between agricultural and indigenous respondents are circled.
perceptions of well-being, in particular for biodiversity factors, maintaining fish populations (for both biodiversity and recreation), supporting communities through further investment in infrastructure, and planning of land use to ensure that land and water resources are used sustainably and appropriately.
A key goal for DRMAC is to plan for development; however, our analysis highlights that this goal could result in conflicts with residents’ preferences. Development goals are well aligned with stakeholders who earn an income from agriculture, but could result in decreases in well-being of other, particularly indigenous, residents (Fig. 4). This accords with a previous study of the impacts of development, specifically concerning water-related values, demonstrating that these impacts would be greater for the indigenous population (Zander and Straton 2010, Jackson et al. 2012, Woodward et al. 2012, Stoeckl et al. 2013). This earlier work supports our own in highlighting likely trade-offs between stakeholder preferences for development in the catchment.
The Index of Dissatisfaction is one method for identifying issues that should be priorities for policy makers (Larson 2010). Based on Index of Dissatisfaction rankings, the top policy priorities for the Daly are associated with commercial factors (Table 5). Providing contextual detail to the index ranking, respondents listed concerns associated with both the current environmental impacts and future increased impacts associated with development. Respondents also stated desires for further restrictions on certain types of land uses and their impacts and more transparent decisions by policy makers. The importance of effective policy development surrounding future development and management of associated impacts is also highlighted by the
respondents’ satisfaction ratings for changes in the catchment. Respondents were on average dissatisfied with hypothetical increases in development (more agriculture, tourists, or mining) and associated environmental impacts (decrease in dry-season river-level, fewer fish, and fewer trees) (Fig. 5). Therefore, a rigorous analysis of how different levels of development will interact with biodiversity and recreational factors needs to be undertaken to ensure that a level of development is selected that balances these factors according to residents’ preferences.
An important aspect of development in the catchment is the associated clearing of native vegetation. The stated actions and objectives associated with the development goals include clearing all suitable land within a limit of 20% of the catchment. The limit of 20% is based on clearing guidelines that DRMAC helped to develop. However, current government policy has indicated that these guidelines will not be implemented and the limit on total clearing is likely to be removed (Adams and Pressey 2014). The responses to hypothetical clearing in the catchment suggest that clearing more than 20% of the total catchment would result in increased dissatisfaction of residents. It is notable that the recommended clearing limit in the guidelines (guided by environmental principles) is similar to the level of clearing that residents would be willing to accept. Furthermore, a study including a sample of respondents from capital cities (Darwin and Sydney) found that people are prepared to pay substantial amounts to maintain the quality of the ecosystem services associated with the Daly River and less than half (43%) of respondents considered ‘Income from irrigated agriculture’ when considering their preferences (Zander et al. 2013). Thus there is strong alignment of local, regional, and national preferences for the Daly. Furthermore, analyses show that this limit need not be restrictive for development and is thus consistent with territory policy for development in the north (Adams and Pressey 2014). Given this concurrence of environmental policy and public acceptability, the current government should reconsider enforcing the clearing limit of 20%.
An associated aspect of clearing is how much water extraction is required to support different types and extents of intensive land uses. Given the high reported importance values associated with water (specifically well-being factors 1, 3, and 18) and reported concerns associated with recreational factors (decreased fish numbers), potential future impacts on water resources will need to be evaluated and communicated to residents, recognizing also the rarity of perennial rivers in northern Australia and the significance of the Daly’s freshwater biodiversity (Kennard 2010).
consensus around future decisions about development and conservation. Targeted engagement with these two groups could therefore yield high returns in terms of selecting land-use options that minimize impacts on two divergent sets of values. Our results can also help structure the engagement to build consensus around shared values before exploring trade-offs for divergent values. For example, indigenous respondents and those who earn an income from agriculture were positive predictors of recreational factors (Table 4, factor 17) and both reported similar levels of importance for these factors (Fig. 4). Therefore, starting a conversation first around the importance of and strategies to protect recreational factors could help create a shared vision as a basis for then navigating potential trade-offs between biodiversity and commercial factors.
The next step in the planning process is to use our results to both inform and evaluate a range of land-use scenarios. Scenario analysis (Peterson et al. 2003) allows for the assessment of impacts of different mixes of land uses over regional extents and medium to long terms relevant to assessing cumulative impacts. Scenarios can also be used in participatory stakeholder workshops in which the different regional futures and expected changes in indicators of well-being can be explored by different groups (e.g., Carlson et al. 2011, Francis and Hamm 2011). Given the potential conflicts between different stakeholder groups over increased development, demonstrated in our analyses, a key variable to be explored in our land-use scenarios will be the level of development characterized primarily by different amounts of overall clearing. These scenarios will then be compared using an existing tool for management strategy evaluation (MSE; Pantus et al. 2011) to test how land clearing and associated water extraction affect key aspects of social, economic, and environmental well-being. For example, the abundance of fish and expected dry-season water-levels are two measurable indices that we can relate to reported satisfaction across different stakeholder groups. The MSE tool also estimates recognized social and economic indicators such as jobs and income across different stakeholder groups. If commercial indicators increase over time, but at the expense of environmental and other indicators, these changes can be related to expected changes in satisfaction and well-being across stakeholder groups. Based on the estimated social, economic, and environmental impacts of different clearing levels on the Daly’s landscapes and freshwater ecosystems, the final development targets could be refined. Further refinement of objectives and selection of a final land-use scenario will rely on engagement by either the Northern Territory Government or other appropriate advisory committees such as NTCAC.
CONCLUSIONS
Planning for multiple land uses requires navigating trade-offs between social, economic, and environmental outcomes arising from different possible futures. An important aspect of land-use planning is identifying alternative futures and building consensus among stakeholders around the best land-use options, based soundly on an understanding of perceptions of present and future well-being. This requires participation of stakeholders not only in the evaluation of potential scenarios but in the identification of explicit objectives that shape planning and scenarios. This participatory approach can be challenging, particularly for regional-scale planning that involves diverse stakeholders and complex mixes of land uses. Our analysis found different
preferences between groups of residents. Being aware of these differences is an important aspect of facilitating engagement to ideally create a consensus between groups but at the very least to acknowledge that differences exist. Although our analysis focused on preferences of local residents, the result that there are divergent preferences is likely to extrapolate to other scales (e.g., regional) and our framework provides a useful way of exploring these differences.
Estimating responses of stakeholders to multiple aspects (social, economic, and environmental) of scenarios adds a further level of difficulty. Although the types of indicators being used in eliciting stakeholders’ responses to scenarios have become increasingly sophisticated (e.g., social indicator developments, Mitchell and Parkins 2011), changes in indicators have not been summarized into measures of overall well-being. For example, increases in income and population size are often assumed to correlate with increases in well-being; however, depending on population preferences, these changes might not result in substantial increases in well-being if measures of environmental, social, or cultural outcomes decline (e.g., Carlson et al. 2011, Francis and Hamm 2011). Therefore, an understanding of the relative importance of different factors of well-being can contribute significantly to a more sophisticated understanding of how different land-use scenarios affect people in a region. Furthermore, measuring indicators related to well-being factors in scenario planning can make outputs more relevant to stakeholders and contribute to the overall success of participatory processes.
Responses to this article can be read online at:
http://www.ecologyandsociety.org/issues/responses.
php/7168
Acknowledgments:
This research was conducted with the support of funding from the Australian Government’s National Environmental Research Program (NERP), specifically to the Northern Australia NERP Hub. RLP also acknowledges the support of the Australian Research Council Centre of Excellence for Coral Reef Studies. We thank Elizabeth Sullivan, Mona Liddy, Kathleen Parry, and Philapine Parlene for assisting with in-person interviews of indigenous residents.
LITERATURE CITED
Adams, V. M., and R. L. Pressey. 2014. Uncertainties around the implementation of a clearing-control policy in a unique catchment in Northern Australia: exploring equity issues and
balancing competing objectives. PLoS ONE 9(5):e96479. http://
dx.doi.org/10.1371/journal.pone.0096479
Adams, V. M., R. L. Pressey, and N. Stoeckl. 2014. Estimating landholders’ probability of participating in a stewardship program, and the implications for spatial conservation priorities. PLoS ONE 9(6):e97941. http://dx.doi.org/10.1371/journal. pone.0097941
Adams, V. M., and S. A. Setterfield. 2013. Estimating the financial risks of Andropogon gayanus to greenhouse gas abatement projects in northern Australia. Environmental Research Letters
8:025018. http://dx.doi.org/10.1088/1748-9326/8/2/025018
Ball, I. R., M. E. Watts, and H. P. Possingham. 2009. Marxan and relatives: software for spatial conservation prioritisation. Pages 185-195 in A. Moilanen, K. A. Wilson, and H. P. Possingham, editors. Spatial conservation prioritization: quantitative methods and computational tools. Oxford University Press, New York, New York, USA.
Barnaud, C., C. Le Page, P. Dumrongrojwatthana, and G. Trébuil. 2013. Spatial representations are not neutral: Lessons from a participatory agent-based modelling process in a land-use
conflict. Environmental Modelling & Software 45:150-159. http://
dx.doi.org/10.1016/j.envsoft.2011.11.016
Carlson, M. J., R. Mitchell, and L. Rodriguez. 2011. Scenario analysis to identify viable conservation strategies in Paraguay’s imperiled Atlantic Forest. Ecology and Society 16(3): 8. [online]
URL: http://www.ecologyandsociety.org/vol16/iss3/art8/
Convention on Biological Diversity (CBD). 2010. Aichi Biodiversity Targets. CBD, Montréal, Québec, Canada. [online]
URL: http://www.cbd.int/sp/targets/
Costanza, R., R. d’Arge, R. de Groot, S. Farber, M. Grasso, B. Hannon, K. Limburg, S. Naeem, R. V. O’Neill, J. Paruelo, R. G. Raskin, P. Sutton, and M. van den Belt. 1997. The value of the world’s ecosystem services and natural capital. Nature
387:253-260. http://dx.doi.org/10.1038/387253a0
Costanza, R., B. Fisher, S. Ali, C. Beer, L. Bond, R. Boumans, N. L. Danigelis, J. Dickinson, C. Elliott, J. Farley, D. E. Gayer, L. M. Glenn, T. Hudspeth, D. Mahoney, L. McCahill, B. McIntosh, B. Reed, S. A. T. Rizvi, D. M. Rizzo, T. Simpatico, and R. Snapp. 2007. Quality of life: an approach integrating opportunities, human needs, and subjective well-being. Ecological Economics 61
(2-3):267-276. http://dx.doi.org/10.1016/j.ecolecon.2006.02.023
Cummins, R. A. 2003. Normative life satisfaction: measurement issues and a homeostatic model. Social Indicators Research 64
(2):225-256. http://dx.doi.org/10.1023/A:1024712527648
Dale, A. P., R. L. Pressey, V. M. Adams, J. G. Álvarez- Romero, M. Digby, R. Dobbs, M. M. Douglas, A. Auge, M. Maughan, J. Childs, D. Hinchley, I. Lancaster, I. Perdrisat, and N. Gobius. 2014. Catchment-scale governance in Northern Australia: a preliminary evaluation. Journal of Economic and Social Policy 16
(1):Article 2. [online] URL: http://epubs.scu.edu.au/jesp/vol16/
iss1/2
de Groot, R. S., R. Alkemade, L. Braat, L. Hein, and L. Willemen. 2010. Challenges in integrating the concept of ecosystem services and values in landscape planning, management and decision
making. Ecological Complexity 7(3):260-272. http://dx.doi.
org/10.1016/j.ecocom.2009.10.006
Department of Climate Change and Energy Efficiency (DCCEE). 2011. Methodology for savanna burning. DCCEE, Canberra, Australia.
Diener, E. 2009. The science of well-being: the collected works of Ed Diener. Springer, Dordrecht, The Netherlands.
Dillman, D. A. 2007. Mail and internet surveys: the tailored design method - 2007 update. John Wiley, Hoboken, New Jersey, USA. Fernandes, L., J. Day, A. Lewis, S. Slegers, B. Kerrigan, D. Breen, D. Cameron, B. Jago, J. Hall, D. Lowe, J. Innes, J. Tanzer, V. Chadwick, L. Thompson, K. Gorman, M. Simmons, B. Barnett, K. Sampson, G. De’ath, B. Mapstone, H. Marsh, H. Possingham, I. Ball, T. Ward, K. Dobbs, J. Aumend, D. Slater, and K. Stapleton. 2005. Establishing representative no-take areas in the Great Barrier Reef: large-scale implementation of theory on marine
protected areas. Conservation Biology 19(6):1733-1744. http://dx.
doi.org/10.1111/j.1523-1739.2005.00302.x
Francis, S. R., and J. Hamm. 2011. Looking forward: using scenario modeling to support regional land use planning in Northern Yukon, Canada. Ecology and Society 16(4) 18. [online]
URL: http://www.ecologyandsociety.org/vol16/iss4/art18/http://
dx.doi.org/10.5751/ES-04532-160418
Game, E. T., G. Lipsett-Moore, R. Hamilton, N. Peterson, J. Kereseka, W. Atu, M. Watts, and H. Possingham. 2011. Informed opportunism for conservation planning in the Solomon Islands. Conservation Letters 4(1):38-46. http://dx.doi.org/10.1111/ j.1755-263X.2010.00140.x
Jackson, S., M. Finn, and P. Featherston. 2012. Aquatic resource use by Indigenous Australians in two tropical river catchments: the Fitzroy River and Daly River. Human Ecology 40(6):893-908. http://dx.doi.org/10.1007/s10745-012-9518-z
Kennard, M. J., editor. 2010. Identifying high conservation value aquatic ecosystems in northern Australia. Final report for the Department of Environment, Water, Heritage and the Arts and the National Water Commission. Tropical Rivers and Coastal Knowledge (TRaCK) Commonwealth Environmental Research Facility, Charles Darwin University, Darwin, Northern Territory,
Australia. [online] URL: http://track.org.au/publications/
registry/track843
Knight, A. T., R. M. Cowling, and B. M. Campbell. 2006. An operational model for implementing conservation action. Conservation Biology 20(2):408-419. http://dx.doi.org/10.1111/ j.1523-1739.2006.00305.x
Kristoffersen, I. 2010. The metrics of subjective wellbeing: cardinality, neutrality and additivity. Economic Record 86
(272):98-123. http://dx.doi.org/10.1111/j.1475-4932.2009.00598.
x
Larson, S. 2009. Communicating stakeholder priorities in the Great Barrier Reef region. Society & Natural Resources 22
(7):650-664. http://dx.doi.org/10.1080/08941920801992102
Larson, S., and K. Alexandridis. 2009. Socio-economic profiling of tropical rivers. Land and Water Australia, Canberra, Australia. Larson, S., N. Stoeckl, B. Neil, and R. Welters. 2013. Using resident perceptions of values associated with the Australian tropical rivers to identify policy and management priorities. Ecological Economics 94:9-18. http://dx.doi.org/10.1016/j. ecolecon.2013.07.005
Malinga, R., L. J. Gordon, R. Lindborg, and G. Jewitt. 2013. Using participatory scenario planning to identify ecosystem services in changing landscapes. Ecology and Society 18(4): 10.
[online] URL: http://www.ecologyandsociety.org/vol18/iss4/
art10/http://dx.doi.org/10.5751/ES-05494-180410
Marans, R. W. 2003. Understanding environmental quality through quality of life studies: the 2001 DAS and its use of subjective and objective indicators. Landscape and Urban Planning 65(1-2):73-83. http://dx.doi.org/10.1016/S0169-2046 (02)00239-6
Margules, C. R., and R. L. Pressey. 2000. Systematic conservation
planning. Nature 405:243-253. http://dx.doi.org/10.1038/35012251
Maynard, S., D. James, and A. Davidson. 2010. The development of an ecosystem services framework for South East Queensland. Environmental Management 45(5):881-895. http://dx.doi.org/10.1007/ s00267-010-9428-z
McShane, T. O., P. D. Hirsch, T. C. Trung, A. N. Songorwa, A. Kinzig, B. Monteferri, D. Mutekanga, H. V. Thang, J. L. Dammert, M. Pulgar-Vidal, M. Welch-Devine, J. P. Brosius, P. Coppolillo, and S. O’Connor. 2011. Hard choices: making trade-offs between biodiversity conservation and human well-being. Biological Conservation 144(3):966-972. http://dx.doi.org/10.1016/ j.biocon.2010.04.038
Millennium Ecosystem Assessment. 2005. Ecosystems and human well-being: synthesis. Island Press, Washington, D.C., USA. Mitchell, R. E., and J. R. Parkins. 2011. The challenge of developing social indicators for cumulative effects assessment and land use planning. Ecology and Society 16(2) 29. [online] URL: http://www.ecologyandsociety.org/vol16/iss2/art29/
Northern Territory Department of Natural Resources, Environment, The Arts and Sport (NRETAS). 2010. Land clearing guidelines. NRETAS, Palmerston, Northern Territory,
Australia. [online] URL: http://www.lrm.nt.gov.au/__data/assets/
pdf_file/0018/5526/NT-Land-Clearing-Guidelines-2010_040310_Updated-April-2013.pdf
Pantus, F. J., C. L. Barton, L. Bradford, and M. Stroet. 2011. Integrated science support for managing Australia’s tropical rivers: a case study in the Daly river catchment. Tropical Rivers & Coastal Knowledge Research Hub, Charles Darwin University, Darwin,
Northern Territory, Australia. [online] URL: http://www.track.
org.au/publications/registry/track956
Pascoe-Bell, A., B. Lynch, J. Hill, C. Green, A. Cameron, and S. Smith. 2011. Identification of potential land for long-term sustainable food production. Department of Natural Resources, Environment, The Arts and Sport (NRETAS), Palmerston, Northern Territory, Australia.
Peterson, G. D., G. S. Cumming, and S. R. Carpenter. 2003. Scenario planning: a tool for conservation in an uncertain world. Conservation Biology 17(2):358-366. http://dx.doi.org/10.1046/ j.1523-1739.2003.01491.x
Polasky, S., E. Nelson, J. Camm, B. Csuti, P. Fackler, E. Lonsdorf, C. Montgomery, D. White, J. Arthur, B. Garber-Yonts, R. Haight, J. Kagan, A. Starfield, and C. Tobalske. 2008. Where to put things? Spatial land management to sustain biodiversity and economic
returns. Biological Conservation 141(6):1505-1524. http://dx.doi.
org/10.1016/j.biocon.2008.03.022
Polasky, S., E. Nelson, E. Lonsdorf, P. Fackler, and A. Starfield. 2005. Conserving species in a working landscape: land use with biological and economic objectives. Ecological Applications 15
(4):1387-1401. http://dx.doi.org/10.1890/03-5423
Pressey, R. L., and M. C. Bottrill. 2009. Approaches to landscape-and seascape-scale conservation planning: convergence, contrasts
and challenges. Oryx 43(4):464-475. http://dx.doi.org/10.1017/
S0030605309990500
Pressey, R. L., M. Mills, R. Weeks, and J. C. Day. 2013. The plan of the day: managing the dynamic transition from regional conservation designs to local conservation actions. Biological Conservation 166:155–169. http://dx.doi.org/10.1016/j.biocon.2013.06.025 Salter, J. D., C. Campbell, M. Journeay, and S. R. J. Sheppard. 2009. The digital workshop: exploring the use of interactive and immersive visualisation tools in participatory planning. Journal of Environmental Management 90(6):2090-2101. http://dx.doi. org/10.1016/j.jenvman.2007.08.023
Stoeckl, N., S. Jackson, F. Pantus, M. Finn, M. J. Kennard, and B. J. Pusey. 2013. An integrated assessment of financial, hydrological, ecological and social impacts of ‘development’ on Indigenous and non-Indigenous people in northern Australia. Biological Conservation 159:214-221. http://dx.doi.org/10.1016/j. biocon.2012.12.007
Summers, J. K., L. M. Smith, J. L. Case, and R. A. Linthurst. 2012. A review of the elements of human well-being with an emphasis on the contribution of ecosystem services. Ambio 41
(4):327-340. http://dx.doi.org/10.1007/s13280-012-0256-7
Syakur, A., J. T. Wibowo, F. Firmansyah, I. Azam, and M. Linkie. 2012. Ensuring local stakeholder support for marine conservation: establishing a locally-managed marine area
network in Aceh. Oryx 46(4):516-524. http://dx.doi.org/10.1017/
S0030605312000166
Tallis, H., P. Kareiva, M. Marvier, and A. Chang. 2008. An ecosystem services framework to support both practical conservation and economic development. Proceedings of the National Academy of Sciences of the United States of America
105(28):9457-9464. http://dx.doi.org/10.1073/pnas.0705797105
Venter, O., H. P. Possingham, L. Hovani, S. Dewi, B. Griscom, G. Paoli, P. Wells, and K. A. Wilson. 2013. Using systematic conservation planning to minimize REDD+ conflict with agriculture and logging in the tropics. Conservation Letters
6:116-124. http://dx.doi.org/10.1111/j.1755-263X.2012.00287.x
Marxan with zones: software for optimal conservation-based land- and sea-use zoning. Environmental Modelling & Software
24:1513-1521. http://dx.doi.org/10.1016/j.envsoft.2009.06.005
Weber, M., N. Krogman, and T. Antoniuk. 2012. Cumulative effects assessment: linking social, ecological, and governance
dimensions. Ecology and Society 17(2): 22. [online] URL: http://
www.ecologyandsociety.org/vol17/iss2/art22/http://dx.doi.org/10.5751/
ES-04597-170122
Wilson, K. A., E. Meijaard, S. Drummond, H. S. Grantham, L. Boitani, G. Catullo, L. Christie, R. Dennis, I. Dutton, A. Falcucci, L. Maiorano, H. P. Possingham, C. Rondinini, W. R. Turner, O. Venter, and M. Watts. 2010. Conserving biodiversity in production landscapes. Ecological Applications 20(6):1721-1732. http://dx.doi.org/10.1890/09-1051.1
Woodward, E., S. Jackson, M. Finn, and P. M. McTaggart. 2012. Utilising Indigenous seasonal knowledge to understand aquatic resource use and inform water resource management in northern Australia. Ecological Management & Restoration 13(1):58-64. http://dx.doi.org/10.1111/j.1442-8903.2011.00622.x
Zander, K. K., S. T. Garnett, and A. Straton. 2010. Trade-offs between development, culture and conservation - willingness to pay for tropical river management among urban Australians. Journal of Environmental Management 91(12):2519-2528. http:// dx.doi.org/10.1016/j.jenvman.2010.07.012
Zander, K. K., R. Parkes, A. Straton, and S. T. Garnett. 2013. Water ecosystem services in Northern Australia—How much are they worth and who should pay for their provision? PLoS ONE
8(5):e64411. http://dx.doi.org/10.1371/journal.pone.0064411