3-dimensional ultrasound in the evaluation of female pelvic organ prolapse of the posterior compartment
188
0
0
Full text
(2) SCHOOL OF MEDICINE. 3-DIMENSIONAL ULTRASOUND IN THE EVALUATION OF FEMALE PELVIC ORGAN PROLAPSE OF THE POSTERIOR COMPARTMENT.. Thesis submitted by Dr Christopher Leo Barry MBBS (Lond), FRCOG, FRANZCOG Senior Lecturer James Cook University In 25 February 2014. For the degree of Doctor of Philosophy in the School of Medicine at James Cook University.
(3) DECLARATION I declare that this thesis is my own work and has not been submitted in any other form for any other degree or diploma at any University or other institution of tertiary education. Information derived from the published or unpublished work of others has been acknowledged in the text and a list of references is given.. C. L. Barry 25 February 2014. I, the undersigned, the author of this thesis, understand that James Cook University of North Queensland will make it available for use within the University Library and, by microfilm or other photographic means, allow access to users in other approved libraries. All users consulting this thesis will have to sign the following statement: “In consulting this thesis I agree not to copy or closely paraphrase it in whole or part without the written consent of the author, and make proper written acknowledgement for any assistance which I have obtained from it.” Beyond this, I do not wish to place any restrictions on access to this thesis.. …………………….. (signature). 25 September 2013. C.L. Barry. II.
(4) ABSTRACT Studies in the USA suggest that approximately 1 in 9 women will require an operation for pelvic organ prolapse (POP) by the age of 80, and of significant concern is that up to 30% of these women will require re-operation. This implies that either our assessment or our treatment of POP is unsatisfactory. Comparison of therapeutic interventions in the research setting has been difficult due to a lack of standardisation of assessment. Most clinical methods to quantify POP have not been rigorously tested. In an attempt to standardise the assessment of pelvic organ descent a pelvic organ prolapse quantification system (POPQ) has been developed, which has been validated for reliability and reproducibility. However, only 40% of clinicians who have a special interest in urogynaecology actually utilise this system in routine clinical practice. In addition it has been difficult to quantify defects of the lateral vaginal support mechanisms. The place of two-dimensional ultrasound for the investigation and management of women with gynaecological problems is now well established. Both transabdominal and transvaginal scanning permit the identification of the uterus and adnexae with excellent resolution to more accurately direct appropriate management. However transabdominal ultrasonography provides poor imaging of the lower pelvic structures, due to the depth of the tissues from the transducer. Transvaginal ultrasound permits excellent visualisation of the bladder, urethra and the posterior compartment but distorts the pelvis thereby precluding accurate assessment of POP. Transperineal ultrasonography avoids these problems. Ultrasonography may therefore improve assessment for both clinical and research purposes by adding a further objective measuring system to vaginal examination. The addition of threedimensional ultrasonography provides the opportunity for visualisation of the axial plane of the pelvis (the third dimension), the ability to store volumes of data (data as opposed to images are stored) and therefore allow offline, independent audit by remote observers. The objective of this thesis was to study the use of 3–dimensional ultrasonography in the investigation of disorders of the posterior compartment of the vagina. The initial experiment was designed to obtain normal values for the incidence and measurement of rectocele prolapse and other posterior compartment defects of the rectovaginal septum, descent of the perineum of the pelvis, and measurements of the levator hiatus. After initial training in the technique and confirmation of the. III.
(5) protocol, a test-retest series together with intraclass correlation test was undertaken in 12 women who were undergoing objective measurements for suburethral sling position, as part of a large, randomised sub-urethral sling outcome study and in whom it was clinically noted that they had at least a grade 2 (Baden-Walker grading system) rectocele prolapse.. This first experiment confirmed the reliability of. measurements with intraclass correlation (ICC) of between 0.68 and 0.79 between observation measurements and test-retest series of between 0.72 and 0.84. Mean depth of defects was 1.45cm, width 0.95cm with a mean perineal excursion of 0.46cm. Mean levator area dimensions increased from 15.6cm2 to 28.4cm2. The technique was therefore felt to be reliable enough for the following experiments. Ninety-seven nulliparous women then underwent the same standardised technique and methodology of ultrasound evaluation. Eighty-nine datasets were available for analysis. Results demonstrated a wide variation of dimensions for levator hiatal diameters and area at rest and on straining. Rectocele protrusions were seen in 11 women (12%), 10 women had protrusions less than 1cm in depth. Median depth was 0.69cm (SD 0.3), width 0.45cm (SD 0.3). There was no correlation with bowel symptoms (p=0.12 ANOVA). Levator area ranged from a mean 17.76cm2 at rest to 20.9cm2 on strain. Again the technique seemed reliable and confirmed in a nulliparous population the presence of congenital or acquired rectocele defects. Having obtained normal values in this control population and confirmed the methodology, the same methods were applied to 82 women who had undergone a standardised surgical repair of a rectocele with mesh overlay, to assess the technique as an objective audit tool. Comparisons were made with clinical evaluation and symptomatology using two-sample t-test and Pearson correlation. Seventy-one datasets were available. Average duration following surgery was 0.7 years. Clinical evaluation revealed recurrence in 4 women (5.6%), while on ultrasound (US), 16 women (23%) had recurrence. Most of the defects seen on US were small and less than 1 cm. Mean depth of rectocele was 0.92cm (SD 0.2), width 1.56cm (SD 0.35). There was no correlation with bowel symptoms (p=0.477 twosample t-test), but a moderate negative correlation with descent of the rectal ampulla and levator hiatal area on strain (r= -0.428, p=0.002). In addition there was an association between a larger levator hiatal area and who on ultrasound had evidence of a recurrence of a defect (p=0.031) as well as recurrence clinically but less so (p=0.067). This would suggest identification of defects was more common with ultrasound but correlation with post-operative symptomatology was poor. This. IV.
(6) may relate to the depth of the rectocele recurrence which were mostly less than 1cm, and therefore below the threshold for symptoms. There was however a trend noted between failure of surgery and increased levator hiatal dimensions on straining. In view of the reproducibility and reliability of the techniques a further experiment was undertaken to compare US against Magnetic Resonance Imaging (MRI). Eleven women with rectocele prolapse underwent 3D US evaluation and rapid sequence MRI scans using T2 image acquisition at rest and on straining. Intra-class correlation using dot-plots were analysed for all the measurements. Women underwent examination using the POPQ scoring system. Pre-op Ap was 0.2cm (SD 1.2), Bp was -0.3cm (SD 1.4), and overall clinical grading was 2. US was significantly better at diagnosing enterocele prolapse versus clinical (p=0.3) but less so MRI (p=0.11). There was no correlation between symptoms and rectocele parameters on either MRI nor US. Correlation between US and MRI for all levator dimensions and rectocele measurements was poor precluding formal analysis. ICC was also poor at 0.485 for levator area at rest and 0.16 for levator area on strain. This study found poor correlation between the two techniques, however small numbers were involved in a group of women with multiple compartmental prolapse. To test 3D US prospectively, 33 women with a diagnosis of rectocele awaiting surgery were recruited and prospective data gathered on ultrasound parameters, POPQ and symptoms. Twenty-nine datasets were available for analysis. Mean age was 59 years and average ordinal staging was 2 with point Bp was 0. All women had fascial repair and composite mesh graft. Enterocele prolapse was again diagnosed more commonly on US than clinically (3 vs. 1). All symptoms improved with surgery. However again there was poor correlation between clinical measurements, ultrasound quantification and symptomatology in relation to successful treatment. Although there was a trend towards more accurate diagnosis of enterocele with ultrasound as defined by surgical staging this did not reach statistical significance. Why is there such a poor correlation between symptoms and both clinical and ultrasound findings. This may relate to the complex interaction between rectal function, neurological damage and prolapse of the vagina. It is proposed that larger studies be conducted to further identify the place of ultrasonography and assessment of POP in women and in particular the pre-operative factors that may influence outcome.. V.
(7) TABLE OF CONTENTS. DECLARATION……………………………………………………......................... pII ABSTRACT………………………………………………………………………….. pIII TABLE OF CONTENTS.................................................................................... pVI LIST OF FIGURES........................................................................................... pV. LIST OF AND TABLES.................................................................................... pXII. LIST OF APPENDICES................................................................................... pXIII. PERSONAL BIBLIOGRAPHY........................................................................... pXIV ACKNOWLEDGEMENTS................................................................................. pXV ABBREVIATIONS............................................................................................. pXVI OVERVIEW....................................................................................................... p1 CHAPTER 1.. INTRODUCTION AND REVIEW OF LITERATURE.......... p9. CHAPTER 2.. REVIEW OF NORMAL AND ABNORMAL ANATOMY...... p38. CHAPTER 3.. METHODOLOGY............................................................... p66. CHAPTER 4.. EXPERIMENT 1- A prospective observational study to test the. reproducibility and reliability of rectocele prolapse and levator measurements of the posterior compartment of the female pelvis................................................ p72 CHAPTER 5. EXPERIMENT 2- A prospective observational longitudinal study. of the incidence of rectocele prolapse and measurement of levator hiatal muscular dimensions in nulliparous women..................................................................... p80 CHAPTER 6. EXPERIMENT 3- An independent audit of outcome using 3D. ultrasound following surgery using composite polypropylene and polyglactin mesh for the treatment of ventral herniation of the posterior vaginal compartment..... p88 CHAPTER 7. EXPERIMENT 4- A comparative study of magnetic resonance. imaging versus 3-dimensional ultrasound for the assessment of levator hiatus and pelvic floor prolapse of the posterior compartment ............................................... p93 CHAPTER 8. EXPERIMENT 5- A prospective observational study comparing. ultrasound assessment against clinical evaluation of prolapse of the posterior. VI.
(8) compartment using the POPQ system of prolapse classification, both pre- and postoperatively ........................................................................................................ p103 CHAPTER 9. DISCUSSION..................................................................... CHAPTER 10. CONCLUSION................................................................... p128. p114. REFERENCES................................................................................................. p129 APPENDICES................................................................................................... p153. VII.
(9) LIST OF FIGURES Figure 0.1 Why women need to have optimal assessment and treatment based on validated assessment and treatment. Personal files. .……………………………….p1 Figure 0.2 POPQ (ICS) measurement scheme for POP. Reprinted with permission (Hall, et al. 1996)………………………………………………………………………….p3 Figure. 0.3. Diagrammatic. drawing. of. transverse. plane. of. female. pelvis. demonstrating the levator hiatus from an inferior view. The red circle indicates the area of interest visualised on imaging. IC (Iliococcygeus); PR (Puborectalis); C (Coccygeus); U (Urethra); V (Vagina); R (Rectum.) Adapted with permission from (R. and R. 2005) ………………………………………………...................... p5 Figure 0.4 Bitmap image of a volume of data stored using 3-dimensional ultrasonography of the lower female pelvis at rest. The bottom right image is the rendered image, i.e. a computer derived 3D impression….................................... p6 Figure 1.1. Mid-sagittal view of the posterior compartment. Reprinted with permission (Nichols and Randall 1996) .…………………………………………….. p10 Figure 1.2. Axial view at the level of the upper-vagina. Reprinted with permission (Nichols and Randall 1996).................................................................................... p11 Figure 1.3. Three levels of support of the vagina Reproduced with permission (DeLancey 1994a). ……………………………….....................................................p12 Figure 1.4. Baden-Walker grading system for pelvic organ prolapse. Reproduced with permission from (Rock and Jones 2003) ........................................................p14 Figure 1.5. ICS POPQ. a) identifies points of reference on the vagina. b) how these results are tabulated. Aa indicates a point 3cm cranial to the hymen on the anterior vaginal wall, corresponding to the urethra-vesical junction; Ba is the point on the anterior vaginal wall which is the most caudal on straining; C is the anterior fornix of the vagina or most anterior portion of the cervix; gh is the genital hiatus; pb perineal body length; tvl total vaginal length; Ap point on posterior wall normally 3cm cranial to hymen; Bp is the point on the posterior vaginal wall which is the most caudal on straining; D only present with cervix present is posterior fornix. Reprinted with permission (Bump, et al. 1996) ............................................................................. p15 Figure 1.6. An example of POPQ assessment of severe prolapse. This schematic drawing represents a mid-sagittal map with co-ordinates defined by crosses and described in numerical terms to define the severity of the prolapse. Adapted from (Bump, et al. 1996) Reprinted with permission ......................................................p16. VIII.
(10) Figure 1.7. This is a schematic diagram of the paravaginal sulci with anatomical reference points. IS, ischial spine; ATFP, arcus tendineous fascia pelvis; Cx, cervix; HS, hysterectomy sulci; A, anus; U, urethra; PT, pubic tubercle. Areas with jagged lines represent defects detected. a) diagram with cervix b) diagram without cervix. Adapted from Te Lind’s Operative Gynaecology 9th Ed. Chapter 35; 943, Chapter editor, Zimmerman (Rock and Jones 2003) (Reproduced with permission)………p18 Figure 1.8. Measurement of POP utilizing the pubococcygeal line on MRI. (Bartram and DeLancey 2003). (Reproduced with permission)........................................... p23 Figure 1.9. a, Anterior rectocele in an asymptomatic 19 year old woman on straining. b, demonstrates continued trapping of contrast following defaecation.. p27 Figure 1.10 Diagram of US transducer placement for translabial scanning. S, symphysis pubis; US, ultrasound transducer; U, uterus; B bladder; R, rectum. Reproduced with permission (Dietz 2004a)........................................................... p30 Figure 1.11. Identification of sub-urethral sling in vaginal wall on mid-sagittal ultrasound. Barry personal study ………………..................................................... p31 Figure 1.12 a Diagrammatic appearance of a normal ultrasound view of the pelvis. (Dietz 2004a); b, transperineal 2D image of the female pelvis orientated as for the real time image (Barry personal image files)......................................................... p32 Figures 1.13 (a) Diagrammatic view of Voxels being used to create a 2 dimensional screen image. (b) 3D probe with scanning sectors. Reproduced with permission from GE.................................................................................................................. p34 Figure 1.14 Three D ultrasound volume of pelvic floor, using translabial ultrasound volume in three-dimensions in coloured Sepia mode. Mid-sagittal plane at top left, coronal plane on top right, axial plane bottom left. The bottom right image shows a rendered volume encompassing the pubococcygeus muscle. (Barry archived volumes with permission 2004) ..............................................................................p35 Figure 1.15 Images of the levator hiatus in axial view with anatomical drawing for comparison. (a) Axial plane imaging at rest (left) and on Valsalva (right) (Dietz with permission). (b) Diagram of levator hiatus as seen from caudally. (U, urethra, V, vagina, R, rectum, PR, puborectalis, IC, ischiococcygeus, C, coccygeus (d) Measurement of anteroposterior and transverse diameters and area of levator hiatus on Valsalva. Reproduced with permission from (R. and R. 2005) ......... p35 Figure 1.16. A right-sided paravaginal defect on three-dimensional ultrasound as shown by the arrows. (Barry from archive with permission)................................. p36. IX.
(11) Figure 2.1 a, Cross-sectional view in axial plane of midvagina showing loop of pubococcygeus (PC), rectovaginal septum (RVS); b; sagittal view of posterior compartment. Reproduced with permission from (Nichols and Randall 1996) ......p39 Figure 2.2. Three levels of support of the vagina with divisions of attachments at level I, II and III. Reproduced with permission (DeLancey 1992).......................... p40 Figure 2.3. Cross-section in axial plane of lower female pelvis at mid-vagina. This illustrates the surrounding compartments of the pelvis. Prevesical space (PS), paravesical spaces (PVS), pararectal spaces (PRS), rectovaginal septum (RVSe), ischial spine (IS), retrorectal space (RRS), rectovaginal space (RVS), arcus tendineous (AT), levator ani (LA). Reproduced with permission (Nichols and Randall 1996) ....................................................................................................................p42 Figure 2.4. Illustration of the internal and external sphincter complex of the anorectal canal. Sphincter is cut in mid-sagittal plane. Reproduced with permission (Oh 1972) ………………………………………………………………………............p45 Figure 2.5. An inferior view of the levator ani complex with attachments. Reproduced with permission from (Anson 1950) …..............................................p47 Figure 2.6. Comparative illustration of anatomy with old radiograph demonstrating closure of the urogenital hiatus in the upright position. Levator plate inclination (LPI), urogenital. hiatus. (UGH),. cardinal. ligament. (CL),. arcus. tendineous. (AT),. pubocervical fascia (PCF). Reproduced with permission from (DeLancey 1994b).p49 Figure 2.7. Perineal membrane and its attachments to the pubic ramus. Reproduced with permission (DeLancey 1999) …................................................ p51 Figure. 2.8.. Superficial. muscle. and. their. attachments. of. the. perineum.. Ischiocavernosis (IC), bulbospongiosis (BS), superficial transverse perinei (STP), external anal sphincter (EAS). With permission (Bartram and DeLancey 2003) ...p51 Figure 2.9. Embryological development of the cloacal region at 5 weeks of age. Reproduced from with permission (Bannister 1995) …………….......................... p52 Figure 2.10 a. Sagittal views of both anterior and posterior rectocele. A. Normal rectum; the vagina is to the left. B. Anterior rectocele displacing the vagina. C. The rare posterior rectocele. D. Combined anterior and posterior rectoceles. Adapted from (Nichols and Randall 1996). b, midsagittal view of female pelvic demonstrating an anterior rectocele protruding into the vagina. With permission (Netter 2011) .. p55 Figure 2.11 Diagrammatic representation of specific defects and their location of the rectovaginal septum. Reproduced with permission (Rock and Jones 2003)..…... p58 Figure 2.12. The stress areas on the utero-sacral/ cardinal ligament complex as shown by the arrows with descent of the fetal head into the pelvis. With permission from (Nichols and Randall 1996) ….................................................... p62. X.
(12) Figure 3.1. Diagrammatic representation of position of subject and transducer head for acquisition of volume data set. Reproduced with permission Dietz.................. p68 Figure 3.2. a; is the image obtained in the mid-sagittal plane with the pelvic organs labelled, SP symphysis pubis, V, vagina, R, rectum, U, urethra, B, bladder, PR, puborectalis. b; is a diagram highlighting the structures visualised represents a schematic diagram of the placement of the transducer for transperineal US. Reproduced with permission Dietz........................................................................ p69 Figure 3.3. a; two-dimensional mid-sagittal view of defect seen of recto-vaginal septum on Valsalva, with measurements of depth and anteroposterior diameters as shown. (Barry image files with permission), b; measurement of perineal mobility by measuring the ampulla relative to the symphysis pubis ……………...................... p70 Figure 3.4. (a) Levator dimension at the line of narrowest introital antero-posterior dimension at rest. (b) Same dimensions on Valsalva. (From author’s image files with permission).......................................................................................................... p70 Figure 4.1 a; This image demonstrates a typical picture in a normal woman at rest in the correct mid-sagittal plane. The rectum (R), symphysis pubis (SP) and bladder neck (BN) can all be seen in the image. Also seen are the urethra shadow (U), puborectalis (PR) and uterus. B; represents a diagrammatic representation of the captured image. Reproduced with permission (Dietz, et al. 2001) ……………….. p74 Figure 4.2. Images on 2-dimensional, mid-sagittal plane, of rectum at rest and on Valsalva strain demonstrating the measurements taken of a rectocele herniation.p75 Figure 4.3. The levator hiatus of minimal dimensions at rest and on Valsalva strain showing antero-posterior, transverse and circumferential measurements………..p75 Figure 4.4. An ultrasound image in mid-sagittal plane of enterocele prolapse. . Bowel gas can give an echolucent area but is not always present ....................... p76 Figure 4.5. This image demonstrates the measurement of rectal ampullary movement with the image on the left being at rest and Valsalva strain on the right. A line is drawn horizontally from the inferior margin of the symphysis pubis and a second vertical line is drawn to the sonodense area in the rectum corresponding to the ampulla. Excursion is measured between the two depending on the caudal displacement…………………………………………………………………………..... p76 Figure 5.1. This is a midsagittal image of a fetal head in the pelvis. Measurements are taken by drawing a horizontal line from the infero-posterior margin of the symphysis pubis and then a vertical line to the most caudal aspect of the presenting part, in this case the fetal head…………………………………………………………p81. XI.
(13) Figure 6.1: Axial view of the levator hiatus after successful mesh repair (left, arrow points to mesh anterior to anorectal junction) and midsagittal view of recurrent rectocele (arrow, right). Reproduced with permission Dietz. ................................ p89 Figure 7.1. Diagrammatic drawing of levator hiatus. The red circle indicates the area of interest visualised on imaging. IC (Iliococcygeus); PR (Puborectalis); C (Coccygeus); U (Urethra); V (Vagina); R (Rectum.). Reproduced with permission from (R. and R. 2005) ……………………………..................................... p94 Figure 7.2. Comparison of anatomical landmarks on US (left) and MRI (right) axial images of the levator hiatus................................................................................... p95 Figure 7.3. a; Dimensions of levator hiatus on Valsalva for MRI on left a and b; 3D USS on right (b). AP (antero-posterior), TD (transverse diameter), A (area) …....p96 Figure 7.4a. Dotplots for intraclass correlation between MRI and 3D USS for area of levator hiatus at rest. Levator area ICC = 0.485 (x axis MRI measurements, y axis USS measurements) ............................................................................................. p99 Figure 7.4b. Dotplots for intraclass correlation between MRI and 3D USS for area of levator hiatus on Valsalva. Levator area ICC = 0.13 (x axis MRI measurements, y axis USS measurements).......................................................................................p99. XII.
(14) LIST OF TABLES Table 4.1. Data for the range of results, standard deviation, median and mean are shown. The shaded area represents measurements on Valsalva straining ………p77 Table 5.1. Data for the range of results, standard deviation and mean are shown. The shaded area represents measurements on Valsalva straining…………..…....p82 Table 7.1. Summarizes the findings of both qualitative and quantitative findings from all examination modalities. Statistical significance is taken as p <0.05................. p97 Table 7.2. Descriptive Statistics for 3D USS and MRI measurements of levator hiatus ................................................................................................................... p 98 Table 7.3. Descriptive statistics for minimum and maximum area on US and MRI. Also shown are trimedians, SE means and StDev to identify the potential effect of outliers on the results……………………………………………………………………p98 Table 8.1. Comparison of symptom frequency pre-operatively versus postoperatively, level of significance p<0.05.............................................................. p107 Table 8.2. Comparison point Ap, Bp, US depth of rectal protrusion and levator hiatal area and posterior compartment symptoms pre-operatively, significance level p<0.05.................................................................................................................. p108 Table 8.3. Comparison of point Ap, Bp, US depth of rectal protrusion and levator hiatal area and posterior compartment symptoms post-operatively. (Pearson correlation & linear by linear association, significance level p<0.05)................... p108 Table 8.4. Comparison of perineal mobility and posterior compartment symptoms post-operatively, significant level p>0.05..............................................................p109 Table 8.5. Levator hiatal dimensions pre and post-operatively, means and standard deviation. Clear boxes represent women with no recurrence post-operatively. Shaded boxes are the subjects with recurrence (N=3) seen clinically and on ultrasound. Value of p<0.05 taken as significant..................................................p110. XIII.
(15) APPENDICES. Appendix 1. DESCRIPTION OF POPQ MEASUREMENT ....................................p153. Appendix 2. URINARY AND BOWEL SYMPTOM QUESTIONNAIRE ……...........p164. Appendix 3. CONSENT, INFORMATION SHEETS AND ETHICS APPROVAL ...p165. Appendix 4. COPYWRIGHT FOR PUBLICATIONS …………….…………………..p169. Every reasonable effort has been made to gain permission and acknowledge the owners of copyright material. I would be pleased to hear from any copyright owner who has been omitted or incorrectly acknowledged.. XIV.
(16) PERSONAL BIBLIOGRAPHY PUBLICATIONS Barry C, Dietz HP. The Use of Ultrasound in the Evaluation of Pelvic Organ Prolapse. Reviews in Gynaecological Practice. September 2005;4 637-646. Barry CL, Dietz HP, Lim Y, Greenland H, Rane AP. A short term independent Audit of mesh repair for the treatment of rectocele in women, using 3 Dimensional Volume ULTRASOUND: A Pilot Study. Australian & New Zealand Continence Journal. 12:4 p94-95, 2006. Barry CL, Dietz HP, Lim Y, Greenland H, Rane AP. MRI versus 3-dimensional ultrasonography: a comparative study of levator hiatal dimensions in women with pelvic organ prolapse. Australian and New Zealand Continence Journal. 12:3 p6465, 2006. HP Dietz, C Barry, Y. Lim, A Rane A two dimensional and 3 dimensional ultrasound imaging of suburethral slings: Data from the ‘SUSPEND’ randomised control trial. Ultrasound in Obstetrics and Gynaecology, 26: 175-179, 2005. Barry CL, Guzman R, Steensma A. Review of the use of 3 dimensional ultrasound imaging for female rectovaginal compartment dysfunction. Can 3-dimensional transperineal ultrasound offer any advantages over traditional imaging? International Surgery Submitted Sept 2013.. PAPERS PRESENTED AT CONFERENCES Barry C, Dietz HP, Lim YN, Greenland H, Hitchins S, Rane A. Imaging of the levator hiatus using magnetic resonance imaging and 3-dimensional ultrasound- a comparative study. Abstract IUGA Copenhagen 2005 s99, abstract 286, Int Urogynecol J (2005) 16 (Suppl 2): S35–S130 . PRESENTATIONS OF RESEARCH TO LEARNED SOCIETIES The role of 3-dimensional ultrasonography for the clinician in pelvic organ dysfunction. ASUM Australian Society of Ultrasound Medicine annual meeting. March 2005 Finding the Flaws in the Floor. Keynote speaker RANZCOG ASM Hobart 2005 The use of 3D US for imaging abnormalities of the female pelvis. 3D ultrasonography- imaging to guide the pelvic surgeon- results from a prospective study of 3D US versus clinical assessment for outcome related to rectocele repair. Annual CFA (Continence Foundation of Australia) meeting 2005.. XV.
(17) ACKNOWLEDGEMENTS. I would like to thank Professor Roger Soames and Professor Yik-Hong Ho for their kind support, work and guidance throughout this study. Dr Hans Peter Dietz for his patience, inspiration and continuing support and advice on ultrasonography techniques and guidance for experimental studies. I would like to thank Prof Ajay Rane for his inspiration and access to clinical subjects. I would like to thank James Cook University for providing logistical support in the form of use of the ultrasound equipment for the project. For their individual contributions during this period of clinical research I would also like to thank: Professor Richard Hays for his encouragement and enthusiasm as well as his practical advice for organising the thesis Assoc. Professor Reinhold Muller for guiding me through the interpretation of statistical data Ms Sarah Hitchins for providing clerical support in contacting and co-ordinating women to participate in the studies. Dr Sandeep Bhuta for helping me with the interpretation and measurement of MRI data. All the nursing and midwifery support for their help in providing information to women seeking to participate in the study. My wife Alison for her patience and support My children Patrick and Nicholas. XVI.
(18) ABBREVIATIONS DCP. Defaecating cystoproctography. FDP. Fluoroscopic defaecating proctography. ICS. International Continence Society. MR. Magnetic resonance. MRI. Magnetic resonance imaging. OAB. Overactive Bladder. POP. Pelvic organ prolapse. POPQ. Pelvic organ prolapse quantification- a system for measuring prolapse. QoL. Quality of life. UI. urinary incontinence. US. ultrasonography. 3D. 3 dimensional. 4D. 4 dimensional. ICC. Intraclass correlation coefficient. ANOVA. Analysis of Variance. SP. symphysis pubis. 2D. 2 dimensional. CT. Computerised Tomography. SD. standard deviation. AP. anteroposterior. TD. transverse diameter. XVII.
(19) OVERVIEW. Aim. Does three-dimensional ultrasonography of the pelvis provide useful information in the evaluation of pelvic floor prolapse in women? To help answer this question the following questions will be addressed: 1. Can 3-dimensional ultrasound accurately measure the variables listed while performing dynamic imaging of the pelvis compared to magnetic resonance imaging, the gold standard?. a. size of prolapse of the posterior compartment, including depth and width b. location of defect c. mobility of prolapse d. levator hiatal dimensions 2. If 3-dimensional ultrasound is reproducible as clinical assessment measurement techniques, then does it correlate better with clinical symptoms than current clinical methods of evaluation?. Background. This thesis has been undertaken by frustration at the lack of scientific evidence for the correct management of pelvic organ prolapse, especially in relation to the appropriate surgical techniques for repair of the posterior compartment of the vagina.. Figure 0.1 Why women need to have optimal assessment and treatment based on validated assessment and treatment. Personal files.. 1.
(20) Studies in the United States of America have suggested that 1 in 9 women will require an operation for pelvic organ prolapse (POP) by the age of 80, and of significant concern is that up to 30% of these women will require re-operation (Olsen, et al. 1997). This would suggest that either the assessment is less than satisfactory, or treatment is unsatisfactory. Success rates of between 70 and 100% have been reported in the literature for repair of rectocele (Arnold, et al. 1990, Kahn and Stanton 1997, Kenton, et al. 1997, Lopez, et al. 2001, Mellgren, et al. 1995). There is a significant. discrepancy. between. studies,. which. relates. to. different. clinical. assessments and outcome parameters. When individual symptoms are sub-analysed then the disparity increases.. Comparison of treatments in the research setting has been difficult due to a lack of standardisation of assessment methods. Initial attempts to quantify POP using clinical assessment utilized the Baden-Walker classification system (Baden and Walker 1992), which allowed the degree of POP to be described and documented as a grading scale of I-IV but which was never validated for its reproducibility. In an attempt to standardise the assessment of pelvic organ descent a pelvic organ prolapse quantification system (POPQ) (Fig 0.2) (Bump, et al. 1996) has been developed, which has been validated for both intra- and inter-observer reliability (Hall, et al. 1996), and adopted by the International Continence Society (ICS) (Weber, et al. 2001). However, in a recent study it was suggested that only 40% of clinicians who have an interest in urogynaecology actually utilise this system on a routine basis, as it is considered by some to be clumsy to use (Auwad 2004). In addition this system does not address potential defects of the lateral vaginal support mechanisms, which may or may not be important in the pathogenesis of pelvic organ prolapse (Miklos and Kohli 2000, Shull and Baden 1989).. 2.
(21) Figure 0.2 POPQ (ICS) measurement scheme for POP. Reproduced with permission (Hall, et al. 1996).. Three-dimensional ultrasonography may permit the study of anatomical changes of the female pelvis and thereby provide an investigative method, which may correlate better with both clinical symptoms and objective outcome, as compared to currently available methods.. The place of two-dimensional ultrasound in the investigation and management of women with gynaecological problems is now well established. Both transabdominal and transvaginal scanning permit identification of the uterus and adnexae with excellent resolution to direct appropriate management.. However transabdominal. ultrasonography provides poor imaging of the lower pelvic structures, particularly the support structures of the vagina and levator muscle group, due to the depth of the tissues from the transducer. Transvaginal ultrasound permits excellent visualisation of the bladder, urethra and the posterior compartment but distorts the pelvis thereby precluding accurate assessment of POP (Quinn, et al. 1988).. In an attempt to. overcome this investigators have utilised transintroital (Tunn and Petri 2003), transperineal and translabial ultrasonography (Khullar and Cardozo 1998, Koelbl, et. 3.
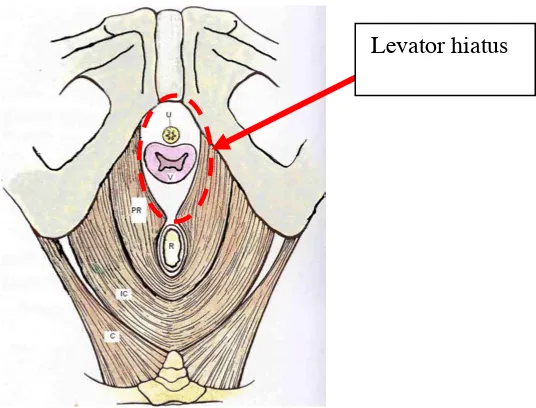
(22) al. 1988). Information can be obtained with no discomfort to the patient as part of a routine pelvic examination. It is therefore possible to improve the understanding of POP using transperineal ultrasound for both clinical and research purposes by providing an alternative objective measuring system to the ICS POPQ system. The addition. of. three-dimensional. ultrasonography. provides. the. opportunity. for. visualisation of the axial plane of the pelvis, improved data storage and therefore independent audit.. Three-dimensional ultrasonography has lagged behind imaging modalities such as computed tomography and magnetic resonance imaging. Substantial improvements in three-dimensional ultrasound have developed in the last 13 years, as a result of improved mechanised sector transducers and computer software. For the first time this allows a relatively simple and easy to use technique for the dynamic evaluation of the female lower pelvis, with reasonable resolution in the axial plane. Deeper structures of the pelvis can be assessed, such as the muscles of the levator hiatus and its fascial attachment, that are not visible on routine clinical examination. A diagrammatic representation of the area of the female pelvis of interest is shown in Figure 0.3.. 4.
(23) Levator hiatus. Figure 0.3 Diagrammatic drawing of transverse plane of female pelvis demonstrating the levator hiatus from an inferior view. The red circle indicates the area of interest visualised on imaging. IC (Iliococcygeus); PR (Puborectalis); C (Coccygeus); U (Urethra); V (Vagina); R (Rectum.) Adapted with permission from Dalley and Moore: Clinical Orientated Anatomy. 4th Ed. p156.. The posterior compartment of the female pelvis is subject to structural changes resulting. from. a. number. of. factors,. including. childbirth,. ageing,. collagen. abnormalities, co-morbidities such as obesity and smoking-related diseases as well as hormonal changes. The relative contribution of each factor is not known. In addition it is not clear why some women are affected by these factors and some are not. Do structural changes in the support mechanisms of the posterior female pelvic compartment lead to functional bowel or vaginal symptoms? This is also not clear. Are surgical treatments correctly dealing with both anatomical and functional changes? None of these questions have been adequately addressed in the literature.. Anatomical changes are the final consequences of these other influences. If specific changes to support structures can be identified this may provide clues as to the. 5.
(24) relative contributions of each of these factors. The anatomical structures encompassing and supporting the vagina may now be assessable, allowing morphometric and biomechanical changes of the levator hiatus to be studied using 3dimensional ultrasonography. Postpartum assessment as well as the effect of biomechanics, fascial tissue differences, lifestyle factors, and surgical techniques as factors influencing surgical outcome. Figure 0.4 gives an example of the image acquisition in all 3 planes using 3-dimensional volume acquisition in ultrasonography. A better understanding of the use of this imaging modality will lead on to further research in this poorly understood area and thus attempt to resolve some of the dilemmas in terms of standardising clinical assessment, so that reliable and scientific comparisons of treatment options become available. I also wish to test whether this technology compares with measurements obtained and symptoms of pelvic organ prolapse/ dysfunction obtained through other imaging modalities.. Figure 0.4 Bitmap image of a volume of data stored using 3-dimensional ultrasonography of the female pelvis at rest. The bottom right image is the rendered image, i.e. a computer derived 3D impression. (Personal files). 6.
(25) Clinical Significance and Outcomes These are the clinical outcome measures that may result in publication of the studies listed above and become incorporated into mainstream clinical practice to improve outcomes for women. Outcome A A method of independent, objective audit of surgeon’s results for the purposes of clinical governance. Outcome B Independent audit of scientific data on surgical outcomes to strengthen research conclusions. Outcome C Improvements in pre-operative assessment to lower surgical morbidity. Outcome D Identify women at greater risk of pelvic floor dysfunction prior to going through vaginal childbirth, to offer preventative strategies.. Support The main financial cost of the thesis involved the cost of the ultrasound equipment. This was obtained with the help of a research grant. Other costs include stationary and consumables have been resourced separately through the Pelvic Health Care fund. Administrative assistance is available through the generous support of the School of Medicine, by way of funding for 3 years for a research assistant. Ethics committee approval was obtained through the Townsville Hospital and Queensland Health for all the studies.. These studies were based on initial studies using data collected during ultrasound assessment of women who had undergone insertion of the sub-urethral sling for urinary incontinence to identify its biomechanics. Based on this work it was noted that visualisation of the posterior compartment appeared to correlate subjectively with the outcome of posterior vaginal prolapse surgery. It was therefore thought that it may have a role in the assessment of structural changes of the female pelvis.. 7.
(26) Personal Development By undertaking this thesis I wish to understand the methodology of research techniques as well as answer the question that has been posed.. HYPOTHESIS.. This study aims to test the following hypotheses.. 1.Three dimensional US is a reliable and reproducible technique to identify and quantify the severity of rectoceles as well as measure levator hiatal dimensions for the posterior compartment. 2.Three-dimensional US can be used for the identification of posterior compartment defects and quantification of levator hiatal dimensions in a control population of primiparous women. 3.Three-dimensional US can be used as an independent measurement tool in the assessment of posterior compartment prolapse. 4.Three-dimensional US correlates as well as magnetic resonance imaging for dynamic imaging of the pelvic floor. 5.Three-dimensional US is better at predicting findings at surgery than clinical examination alone in women with pelvic organ prolapse.. 8.
(27) CHAPTER 1 LITERATURE REVIEW 1.1 INTRODUCTION This review was undertaken to provide a thorough understanding of the literature pertaining to the anatomy and imaging of the posterior compartment of the female pelvic floor, which is an integral part of this thesis. In addition I have identified publications relevant to imaging of this area of the female pelvis, to provide comprehensive information of all aspects of assessment of pelvic organ prolapse, and confirm that the work that I propose is original. In order to do this I identified all the English-speaking textbooks relevant to the subject material. A search was then undertaken using electronic Medline facilities through the Pub Med NCHI web portal, from 1966–2013, for all articles pertaining to the following search terms using the MESH database of keywords. These included; pelvic organ prolapse, rectocele, surgery, imaging, ultrasound, 3 dimensional ultrasound, pregnancy, MRI, magnetic resonance imaging, evacuatory proctography, defaecating. proctography,. dynamic. cystoproctography,. clinical. examination,. incontinence (urinary and faecal), pelvic organ prolapse quantification (POPQ), and female. In total 1789 references have been filed into Endnote, the electronic database reference manager. Further hand searches were made of review articles to identify missing references and all journals, which may contain relevant articles but which were not referenced on the Medline database.. 1.2 Review of anatomy of the posterior compartment of the female pelvis The posterior compartment of the female pelvis is bounded anteriorly by the vaginal wall, caudally by the perineal body, cranially by the vaginal vault and lower extremity of the pouch of Douglas, with the muscular pelvic floor providing the deep ventral boundary of the compartment. Within it is contained the rectum and caudally the anus. Laterally the posterior compartment is formed by the pararectal space, which contains loose areolar tissue, and in turn is bounded laterally by the continuation of the levator ani, which covers the lateral aspects of the pelvic floor. The anatomy is. 9.
(28) illustrated in Figures 1.1 and 1.2. The lateral boundaries consist of the iliopectineal line of the ischium of the bony pelvis, which extends down to the ischial tuberosities laterally, and progress anteriorly to form the pubic rami of the pubic bone. Posteriorly the compartment is enclosed by the sacrum and coccyx.. Figure 1.1. Mid-sagittal view of the posterior compartment. Reproduced with permission Chapter 11, p260 (Nichols and Randall 1996).. 10.
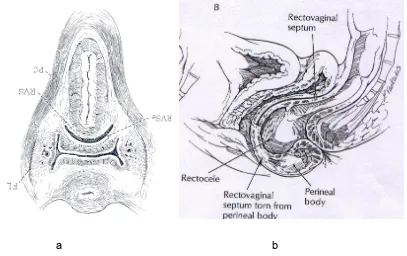
(29) Figure 1.2. Axial view at the level of the upper-vagina. Reproduced with permission and adapted chapter 1, p 31(Nichols and Randall 1996). The rectovaginal septum is a distinct fibromuscular elastic tissue septum, which is fused to the under surface of the muscularis of the posterior vaginal wall. It therefore demarcates the anterior aspect of the posterior vaginal compartment. It has also been described as the anterior layer of Denonvilliers fascia (Tobin and Benjamin 1945): there is sufficient cadaveric evidence clearly identifying the existence of this particular fascia (Milley and Nichols 1969). It appears to form by peritoneal fusion and extends from the peritoneal pouch created by the Pouch of Douglas to the proximal edge of the perineal body. It provides a clear demarcation point, as it is the upper part for fixation of the perineal body, which therefore provides the start of the inferior margin of the posterior compartment. It is therefore crucial not only for stability of this portion of the vagina but is also likely to be the area of weakness through which a hernia defect, such as a rectocele, can occur. Histologically the septum consists of a fibromuscular elastic layer of dense collagen with abundant smooth muscle and coarse elastic fibres (Milley and Nichols 1969). Embryologically this area becomes fused as the cloacal area of the embryo forms. Its strength not only prevents herniation into the vagina but may also be important for normal defaecation. Defects may arise in the septum as a result of congenital or. 11.
(30) acquired defects. Laterally the rectovaginal septum coalesces with the parietal endopelvic fascia. The vagina itself is a distensible, hollow structure, approximately 10 cm in length and changes shape from its distal to the proximal ends. This change in cross-section shape is related to the different support structures of the vagina, and is considered to be at three different levels (DeLancey 1992), (Figure 1.3). The anterior wall of the vagina is slightly shorter being approximately 7.5cm, compared to the posterior wall, which is approximately 9cm; its width increases as it ascends. The upper part of the vagina attaches and becomes confluent with the cervix uteri approximately one third of the distance from the external to the internal os of the cervix. Its lower margin comes from the remnants of the hymen, which demarcates it from the vulva where it continues as the vestibule of the vulva.. Fig 1.3. Three levels of support of the vagina with divisions of attachments at level I, II and III, Anatomic aspects of vaginal eversion after hysterectomy. American Journal of Obstetrics and Gynecology 166: 1718. Reproduced with. permission (DeLancey 1992). The vestibule separates the vaginal orifice from the labia minora, which are two folds of cutaneous epithelium that are devoid of fat. The vagina extends posterosuperiorly but is deflected where it is attached to levator ani creating an angle of approximately 120-130o. The shape of the vagina in the transverse plane can be described as an Hshape or W- shape due to the convex indentation both anteriorly, posteriorly and laterally. This is caused by the nature of the support structures and the impression of the visceral organs, i.e. bladder, urethra, rectum and anal canal. In addition, fat deposits laterally may lead to further bulging of the lateral walls into the cavity of the vagina. Anterolaterally and posterolaterally these form ridges or sulci which at the upper half of the vagina carry on to form small recesses known as the anterior and. 12.
(31) posterior fornices of the vagina. The upper part of the vagina is more capacious as the distal third is narrowed by the levator ani, which tends to compress the vagina against the urethra and pubic bone. The lower third of the vagina is fused anteriorly with the urethra, posteriorly with the perineal body and laterally to the levator ani. In the middle third it attaches to the bladder neck and bladder base anteriorly, with the rectum posteriorly and is continuous laterally with levator ani (DeLancey 1990). The upper third of the anterior vagina is adjacent to the bladder and ureters, posteriorly is the pouch of Douglas, and laterally the cardinal ligaments of the vagina.. 1.3 Clinical assessment of pelvic organ prolapse (POP) There have always been concerns about how to standardise the assessment of pelvic organ prolapse (POP) to quantify defects of the female pelvic floor and therefore adequately compare results for treatment for these defects. The advantage of such a system would be to communicate easily and effectively between clinicians to adequately describe anatomic position of the pelvic organs, thereby not only allowing comparison of the success of treatment but also give some insight into the aetiology of pelvic organ prolapse. Attempts have been made to use scoring systems to quantify pelvic organ prolapse. Traditional teaching suggests the use of the terms mild, moderate and severe to assess the degree of prolapse. Although simple to use such a system has never been tested for intra-observer or inter-observer variation and reproducibility. The Baden-Walker Half Way classification of vaginal defects (Baden and Walker 1992), at least offers an attempt to define numerically the position and thereby the extent of POP, and can be applied to all three compartments of the female pelvis (anterior, central and posterior). It uses a mid-sagittal grading system of I, II, III and IV. This is assessed at 6 points, two on the anterior vaginal wall, two at the cervix or pericervical cuff of the vagina (in the absence of the uterus) and two on the posterior wall. It is defined as follows: On maximal straining the leading edge of the prolapsed wall or organ is measured from the hymenal ring. Using a measuring system whereby a negative sign indicates distance within the vagina and a positive sign a distance outside the vagina, with the hymen being 0 centimetres, Grade 1 is descent to -1 from the hymenal ring, Grade II to the hymenal ring, Grade III is >+1 to the hymenal ring, and Grade 4 complete eversion. A positive sign indicates a more distal prolapse. This is illustrated in Figure 1.4.. 13.
(32) Figure 1.4. Baden-Walker grading system for pelvic organ prolapse. Reproduced with permission from Te Lind’s Operative Gynaecology 9th Ed Chapter 35; 940, Chapter editor, Zimmerman (Rock and Jones 2003).. There are however several limitations to this assessment system. Firstly, it has never been validated; i.e. intra and inter observer variation of measurements: secondly it does not describe the axial or coronal plane but simply refers to mid-sagittal plane. It provides no assessment of vaginal length, paravaginal sulci, nor does it describe the ordinal point of the vagina that is lowest and does not include a description of the variability in vaginal wall elasticity. There is no attempt to precisely define the area of the defect. In an attempt to improve pelvic organ prolapse quantification to aid research, the International Continence Society and American Urogynecological Society, as well as the Society of Gynaecological Surgeons, devised a method quantifying female pelvic organ prolapse and pelvic dysfunction. It is intended to be an objective site-specific system for describing, quantifying and staging pelvic support and position of the vagina. These measurements have been validated in a number of multicentre, international studies, and to date provides the only validated, clinical quantification of prolapse (Abrams, et al. 2002, Bump, et al. 1996). Figure 1.5 illustrates the points on. 14.
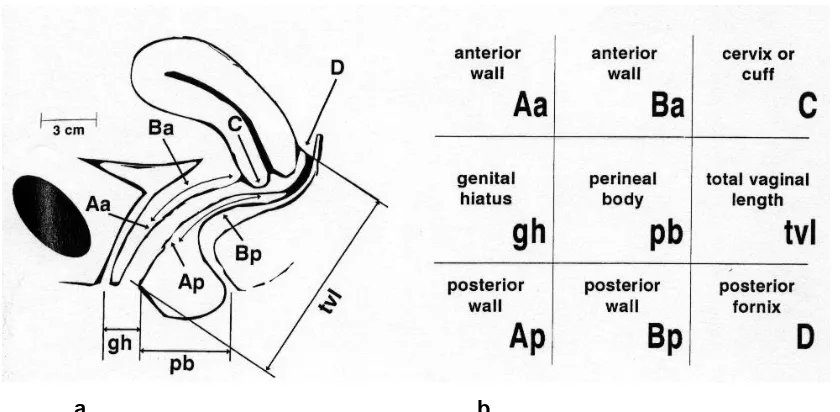
(33) the vagina, which are used as co-ordinates for the measurement system of the POPQ.. a. b. Figure 1.5. ICS POPQ. a) Identifies points of reference on the vagina. b) how these results are tabulated. Aa indicates a point 3cm cranial to the hymen on the anterior vaginal wall, corresponding to the urethra-vesical junction; Ba is the point on the anterior vaginal wall which is the most caudal on straining; C is the anterior fornix of the vagina or most anterior portion of the cervix; gh is the genital hiatus; pb perineal body length; tvl total vaginal length; Ap point on posterior wall normally 3cm cranial to hymen; Bp is the point on the posterior vaginal wall which is the most caudal on straining; D only present with cervix present is posterior fornix. Reproduced with permission American Journal Obstetrics Gynecology 1996; 174:10 (Bump et al 1996). The basis of the system is that reference points in the vagina are utilised to identify specific sites, to indicate descent in the mid-sagittal plane, with the level of the hymen used as the reference point and nominated as station zero. In addition the genital hiatal dimensions, perineal body length (anteroposterior in anatomical position) and perineal movement are also added. Measurements of total vaginal length, anterior and posterior wall descent, if they are both present are undertaken at rest and on maximal straining. An example of these measurements is shown in severe prolapse of the vaginal vault Figure 1.6. As compared to the Baden-Walker system where proportions are used to measure descent, there is a continuum of measurements taken in centimetres. Several papers have provided evidence validating the technique (Bland, et al. 1999, Hall, et al. 1996, Kobak, et al. 1996). Both inter-observer and intra-observer validation demonstrate high levels of concordance using Spearman’s. 15.
(34) rank correlation and tau B coefficient of correlation. In the study by Hall et al correlations of inter-observer reliability for each of the nine measurements were highly significant (rs 0.5- 0.89, p = 0.0008). Staging and sub-staging were also highly reproducible (tau b 0.702 and 0.652). In the same study of intra-observer reliability, 25 subjects were used and correlations for each of the nine measurements were equally strong (rs 0.69- 0.93). These examinations were all undertaken with the patient supine. Measurements in upright examinations were also highly reproducible (tau b 0.712 and 0.712). Therefore it would seem to be a reliable method of assessment for mid-sagittal, ordinal quantification of vaginal position relative to its normal intra-corporeal location.. Figure 1.6. An example of POPQ assessment of severe prolapse. This schematic drawing represents a mid-sagittal map with co-ordinates defined by crosses and described in numerical terms to define the severity of the prolapse. Adapted from Bump RC et al. The standardization of terminology of female pelvic organ prolapse and pelvic floor dysfunction. Reprinted with permission (Am J Obstet Gynecol 1996; 175:10) The assessment examination is simple to perform once taught but has still been seen by many gynaecologists as being time consuming within a busy clinical practice. An audit of gynaecological members of The International UroGynaecological Association. 16.
(35) (IUGA), a body with a self-declared interest in pelvic organ prolapse, found that less than 40% of members used the system in routine clinical practice (Auwad 2004). Furthermore, the International Continence Society (ICS) document on standardisation of terminology incorporates the addition of qualitative information concerning the degree of prolapse with supplementary physical examination and investigations (Abrams, et al. 2002). This may include endoscopic findings, photography, imaging procedures such as ultrasound, radiography, CT scans and MRI imaging. It also permits reassessment and re-evaluation of surgical procedures with descriptions of defects together with pre-operative assessment of pelvic floor integrity, muscle bulk, muscle function and integrity of the vaginal tissues. It is clearly important to describe functional symptoms, as well as including urinary, bowel and sexual function, and address associated effects on quality of life (QoL) parameters for patients. The qualitative information is optional and therefore variable in recording, despite evidence that QoL measures are an important determinant of success for women undergoing treatment (Radley and Brown 2005). Although this system provides an attempt to quantify the extent of the problem it still allows the potential for errors to be made. In addition it demands commitment on the part of the clinician to document adequately the findings. It does not address paravaginal or axial plane defects and there is no standardisation in terms of pressure on the pelvic floor during straining. It is for this reason that imaging techniques allowing precise measurements could offer potential for greater accuracy in the assessment of pelvic organ prolapse. An extension to the above system is to clinically identify the location of specific defects, not only in the sagittal plane but also in the axial and coronal planes, and attempt to translate this into a two-dimensional line drawing. This can be semiquantitative by adding measurement parameters: this is illustrated in Figure 1.7. There is however no evidence to show that the system shown in Figure 1.7 is reproducible between and within observers, however it may add information as to the presence of lateral defects of the vagina.. 17.
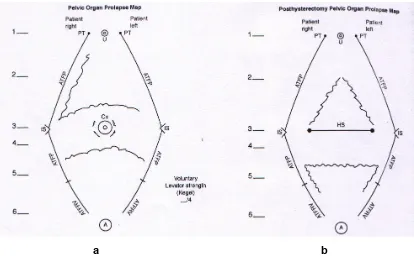
(36) a. b. Figure 1.7. A schematic diagram of the paravaginal sulci with anatomical reference points. IS, ischial spine; ATFP, arcus tendineous fascia pelvis; Cx, cervix; HS, hysterectomy sulci; A, anus; U, urethra; PT, pubic tubercle. Areas with jagged lines represent defects detected. a) diagram with cervix b) diagram without cervix. Adapted from Te Lind’s Operative Gynaecology 9th Ed. Chapter 35; 944, Chapter editor, Zimmerman (Rock and Jones 2003) Reproduced with permission. 1.4 IMAGING MODALITIES FOR PELVIC ORGAN PROLAPSE OF THE POSTERIOR COMPARTMENT 1.4.1 Computed Tomography (CT) CT has been used in a limited number of studies in relation to POP. One small study using fast image acquisition in lithotomy demonstrated prolapse correctly in 5 of 7 women when compared to surgical findings, although the author commented that adequate Valsalva was difficult to achieve (Pannu 2003). This is not adequate evidence to recommend CT imaging to identify POP, especially in view of the concerns over radiation to the pelvis. A recent abstract demonstrated the image acquisition and 3-dimensional modelling capabilities of helical CT imaging, to identify grafts inserted for POP and urinary incontinence (Palma 2006, Palma, et al. 2010). Subtraction modelling using 3-dimensional software was undertaken to identify placement and final resting location of a barium-impregnated prosthetic used for the surgical treatment of incontinence and prolapse. No attempt however was made to. 18.
(37) quantify or identify the type of POP or surgical grafts on straining. In addition there was no mention of the radiation emitted by this technique, which may raise concerns with the use of Barium impregnated implants within a human subject. No comment was made as to the dose of radiation released or the safe excretion of the Barium (Palma 2006, Palma, et al. 2010). At present there is no literature relating to the use of CT imaging specifically for the posterior compartment. 1.4.2 Magnetic Resonance Imaging (MRI) 1.4.2a Comparison with anatomy MRI permits the use of non-radiation image acquisition with superior definition of soft tissues of the pelvis compared to computed tomography. To correlate these images with tissue and organ positioning within the pelvis, direct comparison with anatomical dissection has been undertaken. These studies (Hussain, et al. 1996, Strohbehn, et al. 1996a) have been undertaken utilising cadaveric dissection particularly of the anterior compartment of the pelvis and to a lesser extent of the posterior compartment. Initial studies identified the separate components of the endoanal complex in 8 patients undergoing abdominoperineal resection of colon for rectal tumours and 10 controls using cadavers (Hussain, et al. 1996). In particular the different layers of the wall of the anal canal, incorporating the internal sphincter, longitudinal muscles, external sphincter and puborectalis muscle were correctly identified. Levator ani and ligamentous attachments were also identified and correlated with imaging location. Further studies were undertaken using two female cadaveric prosections: one of the prosections was imaged to permit axial and the other coronal slices to be examined in detail with anatomic correlation (Strohbehn, et al. 1996a). Cross-sectional anatomical tissue dissection permitted levator ani to be identified and insertion points correlated with MRI: there was excellent correlation. Similar histological comparison for microscopic anatomy of the urethra and anterior compartment complex has also been undertaken, again with good correlation (Strohbehn, et al. 1996b). It would seem that MRI accurately reflects the anatomy present. Examination of the posterior compartment specifically and correlation with cadaveric specimens has, however not been undertaken. 1.42b Comparisons with surgical findings Studies correlating MRI findings specifically with surgical findings are limited (Cortes, et al. 2004, Kester, et al. 2003). Two studies have provided evidence regarding the accuracy of MRI. The first involved 31 women imaged with severe multi or single. 19.
(38) compartment prolapse pre-operatively. There was a significant correlation between surgical and MRI diagnosis of POP (Kester, et al. 2003). Another study specifically targeting level I or vault prolapse, suggested that MRI may identify other compartmental prolapses missed at surgery (Cortes, et al. 2004). The evidence suggests that there may be greater accuracy with MRI, which implies that it could be a useful imaging tool in the surgical setting for the pre-operative assessment of gross POP. 1.4.2c Fascial and muscle morphology of the pelvis Central vaginal bulging can be identified clinically with loss of rugae over the herniation, specific areas of weakness and can be identified by rectal examination to find a defect. Evidence of the integrity of paravaginal support structures is inferred by collapse of the posterior lateral sulci. Specific endovaginal fascial defects are difficult to identify (Adekanmi, et al. 2002). Identification of defects in the rectovaginal fascia can be identified, in addition to rectal prolapse and intussusception, as long as rectal contrast is administered and the patient defaecates during the study (Wang, et al. 2005). Imaging the anal sphincter allows the precise delineation of the anatomy if an endorectal coil is used (Hussain, et al. 1995, Stoker, et al. 2001, Stoker, et al. 2002). The use of endovaginal and endoanal coils in magnetic resonance undoubtedly improves imaging of the anatomy, but distorts the vagina so that prolapse is difficult to visualise. With the good correlation between MR imaging and anatomical landmarks in cadavers and continued development of software, three-dimensional reconstruction of static, and possibly dynamic, in vivo anatomy is possible. These techniques will allow morphological aspects, volume measurements, hiatal and defect measurements to be analysed in different planes (Fielding, et al. 2000, Frohlich, et al. 1997). Changes following surgery can also be demonstrated (Healy, et al. 1997b). The morphological and morphometric aspects of levator ani have been studied using these techniques to identify patterns associated with POP in asymptomatic women and women who have had vaginal obstetric deliveries. One study examined 30 women including 10 case matched subjects with no symptoms, urinary incontinence (UI) or POP. Determination of levator hiatal height, bladder neck to pubococcygeal line, levator plate angle, and perineal descent at rest and maximum Valsalva was undertaken. In addition, manual segmentation and surface modelling was applied to generate 3-dimensional models of the separate organs. The models were then measured to determine levator muscle volume, shape and hiatus width, distance between symphysis and levator sling. 20.
(39) muscle, posterior urethrovesical angle, bladder neck descent, and levator plate angle. Both the two and three dimensional data demonstrated differences between control and symptomatic patients although 3 dimensional data was stratified rather than segmented between the groups, i.e. there was significant cross-over of variables between the two groups (Hoyte, et al. 2001b). Similar results were shown with levator colour mapping to measure thickness, although there was some overlap of the data between groups (Hoyte, et al. 2004). Post delivery disruption of levator ani support particuarily for pubococcygeus has been significantly correlated with vaginal delivery, parity and urinary stress incontinence (Dannecker, et al. 2004, DeLancey, et al. 2003, Tunn, et al. 1999). It has been suggested that some of these changes are early changes following pregnancy which appear to resolve as muscle and fat is replaced by scar tissue (Tunn, et al. 1999). Despite the excellent definition offered by this imaging modality, its use for imaging pelvic organ prolapse has been limited by its high cost and the static nature of the image acquisition. However, it is now possible to achieve image acquisition times of only two seconds with single shot, fast spin echo sequences using a T2-weighted technique (Unterweger, et al. 2001). Thus dynamic imaging of the pelvis under strain, to obtain a sagittal and axial image at rest, on straining and even during defaecation with the use of contrast can be obtained. It is also now possible to obtain standing MR images with a vertical configuration of magnets, or sitting using an open configuration of magnets (Hilfiker, et al. 1998). However these are extremely expensive and therefore limited to a small number of research units. One potential problem with obtaining such images is that the anatomy may be altered as well as adjusting for the configuration of magnets. There is, however no evidence either way as no comparisons have been undertaken between the supine and other positions. Nevertheless the newer configurations allows abnormalities associated with defaecation, such as anismus and rectal intussusception to be further evaluated (Lamb, et al. 2000). It has been suggested that abnormalities thought to be difficult to interpret compared to defaecating proctography, such as surrounding muscle spasm and anatomy, not seen easily in simple fluoroscopy may be identified more readily (Barber, et al. 2000, Hilfiker, et al. 1998). The goal is to mimic the strain that is placed on the female pelvic organs during normal activity to reproduce anatomical and symptomatic changes. These measures outlined above attempt to address this important issue. There also appears to be some merit in performing image acquisition in the seated position compared to supine, where levator ani morphology on straining appears different (Bo, et al. 2001, Sentovich, et al. 1995).. 21.
(40) Although dynamic imaging can be undertaken, difficulties arise in achieving a reliable and consistent Valsalva especially in the supine position, where controlling for Valsalva straining is difficult without direct access to the subject or pressure measurements in the vagina. Variance in inter-measurement analysis has been observed in repeated scans taken from the same patient: care is therefore required to minimise these variations (Morren, et al. 2005): one factor is consistent straining. Recent attempts to control for this have utilised MRI suitable transducers but in regular practice this may not be possible (Borghesi, et al. 2006).. 1.4.2d Comparison with clinical assessment Studies utilising MRI, have been undertaken with a limited number of subjects comparing the measurement of displacement of pelvic organs between rest and strain in symptomatic (26) and asymptomatic (16) women. Using a line drawn from the posteroinferior midline of the symphysis pubis to the tip of the most distal coccygeal bone, POP was quantified in all three pelvic compartments using measurements of organ descent below this line, to define the normal and abnormal range. A line drawn along the attachment of the pubococcygeus from the posteroinferior aspect of the pubic rami to the junction of the sacrococcygeal junction permits a co-ordinate from which to measure organ descent (Goh, et al. 2000, Yang, et al. 1991). Other researchers have similarly used this measurement system to validate its use (Goh, et al. 2000). An example of this measurement is shown in Figure 1.8 using the pubococcygeal line. Modification of this technique using rectal and vaginal contrast has provided better evaluation of images to likewise adopt similar guidelines for the measurement of POP (Lienemann, et al. 1997).. 22.
(41) Figure 1.8. Measurements showing reference points utilizing the pubococcygeal line on MRI for estimation of POP. This is a normal study. Reproduced with permission Dr Voyvodic There have also been attempts to use the levator hiatus, as in the HMO classification by drawing an H (levator hiatal) line from the pubis to the posterior anal canal, which measures the width of the levator hiatus and an M line (muscular pelvic floor relaxation) to measure the descent of the levator plate relative to the pubococcygeal line (Comiter, et al. 1999). The O represents organ descent relative to the H line. The transverse diameter can then be measured using this technique. Further classification suggests that the pubic bone may be used as a reference point as it correlates with the hymenal ring (Cortes, et al. 2004). In this study of 20 patients with prolapse a strong correlation was observed with clinical staging in 75% of patients (Cortes, et al. 2004): however it was not tested against the only validated scoring system, the POPQ. Nevertheless, using the pubococcygeal line seems to improve the clinical correlates of MRI over Yang’s original suggested guidelines (Yang, et al. 1994). All of these studies have been conducted on small numbers of women: it is therefore difficult to promote them as reliable sources of quantification of pelvic organ prolapse. A study into morphological features and their correlation with prolapse investigated 61 women subdivided into Stage I, II, III and IV (Baden-Walker grading system section 1.8) and also included nine asymptomatic volunteers (Singh, et al. 2002). Threedimensional models were constructed and identified the levator symphysis gap, the. 23.
Figure


+7


Related documents
The Trust also employs legal counsel with expertise in all areas of ERISA compliance, including but not limited to ERISA’s fiduciary duties, that assists the Trustees in
Our data attempt to remedy such shortcomings by bringing into the picture, in addition to militarized interventions by third states, (1) interventions by third parties other
Ak chcete nastaviť, aby sa klávesnica zablokovala automaticky po uplynutí definovaného času, keď sa zariadenie nepoužíva, vyberte položku Menu > Nastavenia > Telefón
(BH) mechanism, and then diagonal cracks were propagated in the joint after 1.00% drift ratio. 3) A substantial improvement in the global performance of BCJ-SS-S4 and BCJ-SS-F4 can
In that same decision, the Executive Board also decided the following: that this evaluation plan include evaluations in all programme areas assisted; that in addition to being
Vietor , Senator John Heinz Professor of Environmental Management Panelists: Manish Kejriwal , Senior Managing Director, Temasek Holdings Advisors India Pvt.. Kjaer , Former
He coordinates Bruegel’s research in this area and has written policy papers for Bruegel on banking supervision and crisis management, accounting standards, credit rating
A registered notification tool may be removed using the --remove flag ; the tool to be removed can be specified either by servicelog ID (using the --id option) or by a portion of
